
 ?Mathematical formulae have been encoded as MathML and are displayed in this HTML version using MathJax in order to improve their display. Uncheck the box to turn MathJax off. This feature requires Javascript. Click on a formula to zoom.
Abstract
Li1−xNb1+x/5O3 (where x = 0, 0.025, 0.045, 0.075) ferroelectric ceramics were prepared by the solid-state reaction method; X-ray diffraction patterns indicate that single phase was formed for pure LN ceramics. The electrical behavior of the ceramics was studied by impedance spectroscopy technique in the 300–1000 °C temperature range. Impedance analysis was performed revealing a conductivity data which fitted in the modified power, σac(ω) = A · ωn1 + B · ωn2 and evidence of two types of conduction process. The low-frequency conductivity is due to long-range ordering (near frequency-independent) and high-frequency conduction due to the localized orientation hopping mechanism. The static conductivity is determined for all compositions from Cole–Cole diagrams, and the evolution vs temperature is studied as a function of the Li/Nb ratio.
1 Introduction
Lithium niobate has been the subject of extensive studies. Due to its excellent piezoelectric pyro-electric, electro-optic and photorefractive properties, lithium niobate LiNbO3 (LN) has become one of the most important crystal materials for research because of its several device applications, such as in photorefractive devices, holographic memories, electro-optic modulators, waveguide structures, etc. [Citation1–Citation4]. The structure of ferroelectric LiNbO3(LN) belongs to space group R3C and can be considered as a superstructure of the α-Al2O3 corundum structure with Li+ and Nb5+ cations along the c axis [Citation5]. LN is well known to be narrow-range non-stoichiometric compounds; the solid solubility range extends from about 50 to 52% mol Nb2O5 for LN [Citation4].
LN is usually grown with congruent non-stoichiometric composition and exhibits a certain amount of deficit of lithium (Li) showing specific intrinsic defects in its crystals which considerably change its acoustical, optical and other properties because the excess Nb5+ ions in congruent position of LN occupy only the regular Li-sites. So its required local charge neutrality can be guaranteed by oxygen vacancies, by Li vacancy at Li-site or by Nb vacancy at Nb-sites [Citation6–Citation10]. Different defect models were proposed to account for the non-stoichiometry [Citation11], the oxygen vacancy model was eliminated [Citation7,Citation12] and among see the cation site vacancy models, the Li-site vacancy model [Citation7,Citation13,Citation14] seems more probable than the Nb-site vacancy model [Citation8,Citation15,Citation16]. Therefore, the Li-deficient crystal may be formally regarded as one with an Nb surplus, or in other words, a decreasing Li content is accompanied by an increasing content of the heavier Nb. The existence of such a stacking defect, Nb on a Li-site (Nb antisite), was repeatedly proved by structure studies [Citation8,Citation17]. According to precise data of X-ray and neutron diffraction, only 1% of the Li-site is occupied by Nb (Nb antisite), whereas about 4% of the Li-sites are empty (Li vacancy) [Citation5]. This existence of a high concentration of Li vacancies in congruent LN was confirmed by other structure reports [Citation17,Citation18] and NMR (Nuclear Magnetic Resonance) spectroscopy studies [Citation19].
However, polycrystalline lithium niobate due to its dielectric and piezoelectric properties, etc. also has important technological applications. Otherwise, those properties are strongly dependent on the method of preparation. Dielectric and electrical properties of LiNbO3 ceramics have been investigated in the past several years. To ensure practical device applications, it is necessary to improve the ferroelectric and electrical properties [Citation20–Citation22].
Recently, Mg-doped LiNbO3 ceramics has been prepared by polymeric precursor method [Citation23], the Simoes et al. analysis indicated that the pure LN and doped with 1 mol% Mg have good potentials for evaluation of their piezoelectric applications.
Nitta [Citation24] prepared the sodium-lithium niobate ceramic by the solid-state method.
The Nitta analysis indicated that the presence of small amounts of LiNbO3 dissolved in NaNbO3 modifies its dielectric characteristics.
Solid solution with LiNbO3 can exhibit piezoelectric, ferroelectric and electro-optic behaviors [Citation25]; sol–gel processing [Citation25,Citation26] has become popular for producing ceramic materials.
LiNbO3 (LN) is isomorphous with LiTaO3 (LT). Several studies have reported on the changes in electrical conductivity of the lithium tantalite ceramics [Citation27,Citation28]. By complex impedance spectroscopy, Huanosta et al. [Citation27] studied the variation of the conductivity as a function of the stoichiometry in Li1−5xTa1+xO3. F. Bennani et al. [Citation28] studied the modification of the electrical properties of pure and Ni-doped lithium tantalate.
The electrical properties of polycrystalline LiNbO3 have been less studied, although some related works are found in the literature [Citation20,Citation29]. This study presents the contribution of the complex impedance spectroscopy to the investigation of the properties of polycrystalline LiNbO3 in the 300–1000 °C temperature range.
In the present paper, we study the modification of the electric properties of LN ceramics with different stoichiometries; the electrical properties were investigated by impedance spectroscopy. We have tried to improve our understanding by analyzing the electrical response of the grain and grain boundary effects, making an interpretation of the microscopic process that allows discerning the role of grain and grain boundary.
2 Experimental
Pure LiNbO3 samples, with a general formula Li1−xNb1+x/5O3 (where x = 0, 0.025, 0.045, 0.075), from Li2CO3 and Nb2O5 powders, were used. The starting materials were high-purity LiCO3 (>99.9%) and Nb2O5 (>99.9%). Lithium carbonate and niobium oxide are mixed by attrition with ZrO2 balls in isopropanol in the 1/3 balls, 1/3 isopropanol and 1/3 solid phase ratio and shaken for 12 h. After the sedimentation, the mixture was dried in a rot-vapor. The samples were fired in three steps of 10 h, with 400 °C, 600 °C and 800 °C. Powders were then isostatically pressed at 2500 bars to give pellets of 13 mm in diameter and 1 mm in thickness and were sintered at 1000 °C for 4 h with a heating rate of 100 °C/h. To clarify the exact composition of the materials studied, an analysis of cations was made using ICP-AES (inductively coupled plasma-atomic emission spectroscopy), in the central analysis unit of the CNRS in Vernaison (France).
For a few compositions, we analyzed three or four samples of the same composition, to check the reliability of the analyses. The concentrations of elements for each sample are S1 (Li: 0.4158, Nb: 0.4128), S2 (Li: 0.4033, Nb: 0.4153), S3 (Li: 0.3954, Nb: 0.4169), and S4 (Li: 0.3822, Nb: 0.4194) using the following equations (x ∗ 1 + y ∗ 5 =6 neutrality electric and ratio of concentration of elements with R is ratio prepared) with LixNbyO3 formulae of sample. The number of vacancies was calculated by subtraction of the amount of cation sites. The errors in the formulae obtained were estimated to be about 0.8% for Li, 0.1% for Nb. The formulae obtained are reported in .
Table 1 Chemical formulae obtained by analysis and proposed formulae in good agreement with the model of Iyi ([Li1−xNbx/5(VLi)4x/5] NbO3) [Citation13], with different stoichiometries of LN (where □ denotes the empty Li-site).
Ceramics were characterized by X-ray diffraction with a Philips PW 1729 diffractometer using the Cu Kα wavelength.
The electrical measurements are carried out as function of temperature in an atmosphere of normal lab air. Platinum electrodes were deposited on the pellet surface by painting. The painted pellets were placed in the oven at 700 °C for 2 h, to ensure the adhesion of the electrodes on the ceramic. The evolution of the conductivity was by complex impedance spectroscopy. Isothermal measurements were carried out between 300 and 1000 °C with temperature steps of 50 °C or 100 °C. The instrumentation comprised a solatron-1260 Impedance Gain phase analyzer controlled by a PC computer. The range of measuring frequencies was 1 Hz to 10 MHz. Applied voltage was always 0.5 V.
3 Results and discussion
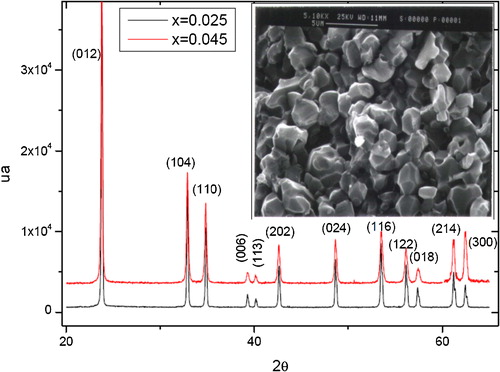
Ceramics were characterized by X-ray diffraction and scanning electron microscopy. shows the X-ray patterns of samples S2 and S3, and they exhibit the structure of pure LiNbO3 [Citation30], and uniform grain size of about 3 μm.
Fig. 1 XRD patterns of samples S2 (x = 0.025), S3 (x = 0.045) and SEM micrograph (inset) of sample S2.
3.1 Cell parameters
The cell parameters were determined from X-ray patterns recorded at scanning speed of ¼°2θ/min and were refined by least square method calculations. They are reported in . When the Li/Nb ratio decreases, cell parameters and volume increase because the content of substitution of Li+ ions by Nb5+ increases. If we know that the ionic radius of Nb5+ (64 pm) is slightly smaller than that of Li+ (76 pm), we should then observe a decrease in these parameters and not an increase. But as the substitution of Li+ by Nb5+ is accompanied by creation of vacancy to keep electrical neutrality of the product, the oxygen molecules forming the octahedron containing this vacancy have the tendency to repel because they are not any more attracted by the cation Li+. Therefore, the mesh increases in volume; these observations are in good agreement with the results obtained by Fan et al. [Citation31].
Table 2 Values of cell parameters a, c, ratio c/a and cell volume of samples S1, S2, S3 and S4.
The densities obtained after sintering stage average 4.1 g/cm3, or 89% of theoretical density (4.625 g/cm3), this value is similar to that obtained by Simoes [Citation23], and also the SEM micrograph of sample S2 (inset ) shows that the material is dense, and that its grains are homogeneous and almost spherical, fairly regular shape, with the presence of a low porosity, with an average grain size lying between 2 μm and 3 μm.
3.2 Impedance spectroscopy
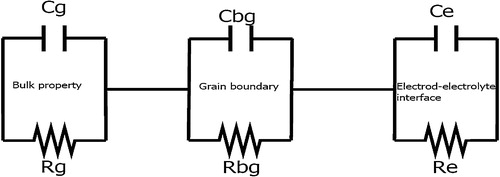
In order to analyze the grain and grain boundary effects in LiNbO3, we employ the impedance [Citation32] spectra as a function of temperature (300–1000 °C) and frequency (1–106 Hz). The goal of this investigation is to improve our understanding by analyzing the electrical response of the grain and grain boundary effects, making an interpretation of the microscopic process that allows discerning the role of grain and grain boundary. The impedance data were usually modeled by an ideal equivalent electrical circuit comprising of resistance (R) and capacitance (C). The equivalent circuit is based on the brick-layer model [Citation32]. These polycrystallines show that grain and grain boundary impedance can be represented by equivalent circuit as given in . The circuit consists of series combination of grain and grain boundary elements. The grain circuit consists of parallel combination of grain resistance (Rg) and grain capacitance (Cg) whereas grain boundary consists of parallel combination of grain boundary resistance (Rgb) and grain boundary capacitance (Cgb). These two circuits are connected in series with the contributions of the electrodes. The electrode–electrolyte interface circuit consists of parallel combination of resistance (Re) and capacitance (Ce). In order to analyze the grain boundary effects, we discussed our results in the context of impedance formalism. In order to calculate the impedance values, we have used the equation given below.
Fig. 2 Equivalent electrical RC circuit for grain, and grain boundary and electrode–electrolyte interface effects.
The real (Z′) and imaginary (Z″) parts of the complex impedance (Z*) were obtained using the following relations:(1)
(1)
(2)
(2) shows the Nyquist plot of LN samples as function of frequency at different temperatures. At low temperature, S1, S2, S3 and S4 show very high resistance value, almost straight line, and one can get resistance values to extrapolate these straight lines to meet zero frequency position (meet at X-axis). Due to high resistance (almost insulating behavior) of the LN, we have not observed the separate effects of grain and grain boundaries at low temperature. At elevated temperature, the resistance or impedance decreases with increase in temperature, showing typical negative temperature coefficient of resistance (NTCR) behavior. Even at elevated temperature, the grain and grain boundary effects are clear from the LN Nyquist plot. In order to get clear grain and grain boundary effects, we have observed the grain boundary contributions as shown in . In the range of low frequency (100 Hz to 1 kHz) the arc represents the grain boundary capacitance (Cgb) that increases with increase in temperature, which indicates the clear effects of grain boundary capacitance.
Fig. 3 Variation of Nyquist plots of samples (a) S1, (b) S2 and (c) S4 at different temperatures.
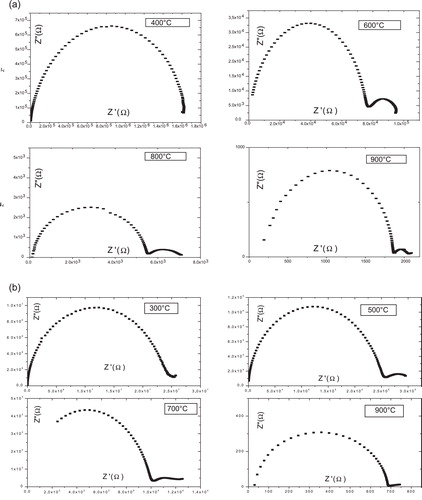
Fig. 3 (Continued).
At the temperature 400 °C, the impedance data for sample S1 take the form of single arc, and represents the grain effect; on the other hand, low-frequency arc represents the grain boundary attributed to grain boundary appears for other samples. Which means that polaronic conduction is predominant in this temperature; this is consistent with the formula proposed in where we see that this compound (sample S1) contains the minimum rate of vacancy, and that it presents the lowest conductivity in the series of samples, as will be seen later.
For all samples, when the temperature increased about 450 °C, grain boundaries effect becomes more prominent with well-defined semicircle.
3.3 ac conductivity analysis
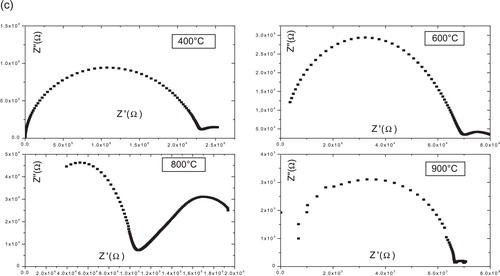
shows the frequency-dependent conductivity (σac) of LN at different temperatures. The ac conductivity (σac) was calculated using the following relation:(3)
(3) where b is the sample thickness, d is the diameter of the sample, and G is the conductance (Ω−1).
Fig. 4 Ac conductivity as a function of frequency at different temperatures for all samples (a) S1, (b) S2, (c) S3 and (d) S4.
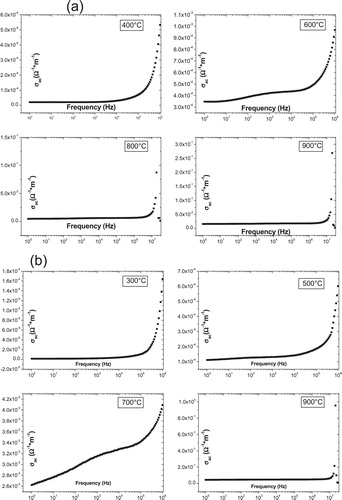
Fig. 4 (Continued).
The conductivity plots of samples S1, S2 and S3 possess the following characteristics:
| (i) | Two areas differ markedly; at high frequencies there is clearly an increase in conductivity with frequency, for all samples and at different temperatures, and then only for frequencies below a frequency critical (fc) that depends on the composition of the sample; it becomes almost independent of the frequency to a fixed temperature. | ||||
| (ii) | We see that the slope becomes very small relative to that observed in the region where f > fc. Also, for the area of low frequencies, we note the increase in the conductivity with temperature for the same frequency. | ||||
A convenient formalism to investigate the frequency behavior of conductivity at constant temperature in a variety of materials is based on the power relation proposed by Jonscher [Citation33].(4)
(4) where σac(ω) is the total conductivity, σdc is the frequency-independent conductivity, and the coefficient A and exponent n (0 < n < 1) are temperature and material intrinsic property dependent. The universal power law does not match well with our data. We have used the modified power laws:
(5)
(5) They matched well with our data. A and B are coefficients and n1 and n2 are critical exponents in different frequency regions. These observations in conductivity spectra can be explained on the basis of jump relaxation model and conduction through grain boundaries [Citation34–Citation36].
According to this model, the conductivity in the low-frequency region is associated with the successful hops to its neighborhood vacant site due to the available long time period; such successive jumps result in a long-range translational motion of ions contributing to dc conductivity. The frequency-dependent conduction could be attributed to localized orientation hopping (hopping of electron back and forth between two charge defects, the presence of induced or permanent dipoles) assisted by small polaron mechanism [Citation37].
The value of critical exponents of our fitted data for few temperatures is reported in , the value n1 decreases with increase in temperature. The value of n2 increases with increase in temperature. The first exponent is associated with the charge carriers, whose motion can be contributed due to dc conduction and dispersive ac response. According to [Citation38], n > 1 is possible when the electrical behavior of sample is made of two separate and independent dispersion processes.
Table 3 Values of critical exponent n1 and n2 for S1, S2, and S3 at different temperatures.
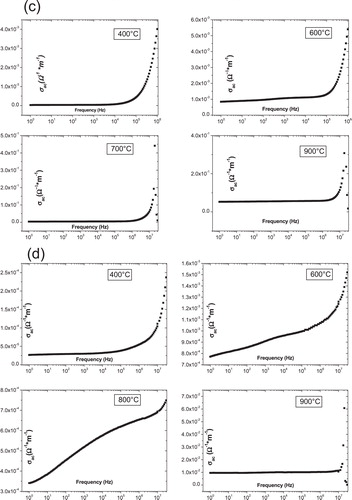
3.4 dc conductivity
The internal resistance of the sample for each temperature is determined from the intersection of the arc of a circle with the Z′ axis and static conductivity is deducted. The values of the static conductivity of LN to different stoichiometries are deducible from diagrams of complex impedance for each studied temperature and results of log(σ*T) vs 1000/T for the four samples (S1, S2, S3 and S4), and are shown in and . According to and , we note that the static conductivity shows a surprising behavior with temperature, that is to say that log(σ*T) shows a change in slope at a temperature threshold and is not the same for all samples. In , we gave (1000/T) values that correspond to this change for each sample, as well as the values of energy of activation and σ0, deducible from Arrhenius relationship, before and after this threshold temperature. The evolution of conductivity with temperature reveals a behavior thermally activated with two slopes. These slopes correspond to energies of activation means 0.84 and 1.2 eV.
Table 4 Values of Ea (activation energy) and σ0 (pre-exponential factor) before and after the temperature threshold of samples S1, S2, S3 and S4.
Fig. 5 Variation of static conductivity vs the 1000/T for the samples (a) S1 and (b) S2.
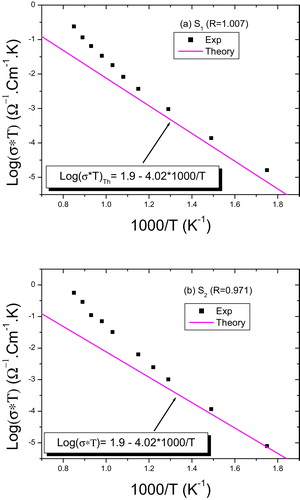
Fig. 6 Variation of static conductivity vs the 1000/T for the samples (c) S3 and (d) S4.
At the low temperature, the conductivity is attributed to polarons conduction. According to Schirmer [Citation39], three types of small polarons are present in the lithium niobate. The first, called “small polaron free”, is due to an electron self-trapped in a crystallographic site of Nb-noted NbNb4+. An electron can also be trapped on sites of antisite defect (NbLi4+). In addition, a pair of neighboring polarons (NbLi4+–NbNb4+) may form a bipolaron. These bipolarons may be thermally dissociated. However, the activation energies deducible for our samples are close to the activation energies given by Schirmer [Citation39].
On the other hand, the polaronic conductivity is given by the formula [Citation40]:(6)
(6) where
, N is about 8 × 1021 cm−3 density of polarons, e is charge of the electron, R is distance of the jump polaronic, r is radius of polaron, K is Boltzmann's constant, and Ea is activation energy.
According to [Citation1], the values of the parameters R, r and ϑ are respectively 4.165 Å, 1.4 Å and 1013 Hz.
Then we found the following equation:(7)
(7) This theoretical estimate is in good agreement with the experimental results ( and ). The results imply that transport properties in our samples before the threshold temperature are well described by the jump of polarons mechanism.
After the threshold temperature, this area corresponds to higher temperatures. The concentration of intrinsic defects increased, especially the vacancies, which facilitates the jump from lithium-ion and also protons; the ionic conductivity is a thermally activated process. The temperature dependence of ionic conductivity is generally given by the Arrhenius equation. In this temperature range, we can attribute the conduction to ionic conduction mechanism. However the activation energy for our samples in this temperature range values by means of 1.2 eV. This value is close to the values of the activation energy which exists in the literature (from 1 to 1.33 eV for protons H+ [Citation40–Citation43] and from 1.17 to 1.25 eV for Li+) [Citation13,Citation44,Citation45].
In , we see that σ0 is even greater when the number of vacancies is great (Li/Nb is small), except for the S4 sample, where it should have a value larger than that of 88.1 Ω−1 cm−1, since rate gaps are greater compared with S1, S2 and S3. This may be due to the fact that the amount of Nb in the antisite (NbLi) increases, and tends to block ionic conduction; however, before the threshold temperature, as already noted, the S4 sample presents the greater polaronic conductivity, due to formation of polarons in niobium antisite.
4 Conclusion
In summary, a mechanosynthesis followed by the conventional solid-state reaction approach was used for the synthesis of single-phase LiNbO3 ceramics. An XRD pattern shows hexagonal crystal structure. Impedance spectra revealed the presence of grain and grain boundary contributions in the electrical properties of LiNbO3. Our data matched well with the modified power laws: σac(ω) = A · ωn1 + B · ωn2 indicating that the charge carriers motion in the low-frequency region was due to dc conduction and dispersive ac response, whereas in the high-frequency region it was due to the presence of the local polar dipoles.
We showed that dc conductivity exhibits two activation energies in the ferroelectric phase for LN. The conduction mechanism changes from polaronic conduction in low temperatures with an average activation energy of 0.84 eV to ionic conduction in high temperatures with an average activation energy of 1.2 eV.
Notes
Peer review under responsibility of The Ceramic Society of Japan and the Korean Ceramic Society.
References
- A.DharN.SinghR.K.SinghJ. Phys. Chem. Solids742013146151
- V.TatyanaW.ManfredLithium Niobate Defect Photorefraction and Ferroelectric Switching1st ed.2008SpringerBerlin
- L.ArizmendiPhys. Status Solidi A2012004253283
- P.BoffiD.PiccininM.C.UbaldiInfrared Holography for Optical Communicationsvol. 862003SpringerBerlin
- S.C.AbrahamsJ.L.BernsteinJ. Phys. Chem. Solids28196716851692
- S.P.SafaryanR.S.FeigelsonA.M.PetrosyanJ. Appl. Phys.85199980798082
- N.IyiK.KitamuraF.J.IzumiK.YamamotoT.HayashiH.AsanoS.KimuraSolid State Chem.1011992340352
- S.C.AbrahamsP.MarshActa Crystallogr. Sect. B4219866168
- G.MalovichkoV.GracheO.SchimerAppl. Phys. B681999785793
- D.XueK.KitamuraSolid State Commun.1222002537541
- Q.LiB.WangC.H.WooH.WangR.WangJ. Phys. Chem. Solids68200713361340
- J.A.AllemannY.XiaR.S.A.MorrissP.WilkinsonH.SertJ.S.SpeckC.G.LeviF.F.LangeS.AndersonJ. Mater. Res.11199623762387
- N.IyiK.KitamuraY.YajimaS.KimuraY.FurukawaM.SatoJ. Solid State Chem.1181995148152
- Y.ToriiT.SekiyaT.YamamotoK.AbeMater. Res. Bull.18198315691574
- O.F.SchirmerO.ThiemannM.WohleckeJ. Phys. Chem. Solids521991185200
- H.DonnerbergJ. Solid State Chem.1231996208214
- N.ZotovH.BoysenF.FreyT.MetzgerE.BornJ. Phys. Chem. Solids551994145152
- A.P.WilkinsonA.K.CheethamR.H.JarmanJ. Appl. Phys.74199330803083
- J.BlumelE.BornT.MetzgerJ. Phys. Chem. Solids551994589593
- S.C.BhattB.S.SemwalSolid State Ionics2319877780
- N.EaswaranC.BalasubramanianS.A.K.NarayandassD.MangalarayPhys. Status Solidi A1291992443451
- R.M.HensonR.R.ZeyfangK.V.KiehlJ. Am. Ceram. Soc.6019971517
- A.Z.SimoesA.H.M.GonzalezA.A.CavalheiroM.A.ZagheteB.D.StojanovicJ.A.VarelaCeram. Int.282002265270
- T.NittaJ. Am. Ceram. Soc.511968623630
- L.PardoP.Duran-MartinJ.P.MercurioL.NibouB.JimfinezJ. Phys. Chem. Solids58199713351339
- N.Puyôo-CastaingsD.FrancoiseR.JeanJ. Mater. Res.31988557560
- A.HuanostaA.R.WestJ. Appl. Phys.61198753865391
- F.BennaniE.HussonJ. Eur. Ceram. Soc.212001847854
- Y.XiH.McKinstryL.E.CrossJ. Am. Ceram. Soc.661983637641
- S.C.AbrahamsP.MarshActa Cryst. B4219866168
- Y.FanH.LiL.ZhaoOpt. Mater.302007492496
- O.RaymondR.FontN.Suarez-AlmodovarJ.PortellesJ.M.SiqueirosJ. Appl. Phys.972005084108
- A.K.JonscherNature2641977673677
- A.Pelaiz-BarramcoM.P.Gutierrez-AmadorA.HuanostaR.ValenzuelaAppl. Phys. Lett.73199820392041
- A.R.JamesChandra PrakashG.PrasadJ. Phys. D: Appl. Phys.39200616351641
- S.MahboodG.PrasadG.S.KumarBull. Mater. Sci.292006347355
- I.RiveraA.KumarF.MendozaR.S.KatiyarPhysica B403200824232430
- J.Ross MacdonaldJ. Non-Cryst. Solids21019977086
- O.F.SchirmerM.ImlauC.MerschjannB.SchokeJ. Phys.: Condens. Matter212009129
- E.M.de Miguel-SanzM.CarrascosaL.ArizmendiPhys. Rev. B652002165170
- Y.P.YangI.NeeK.BuseD.PsaltisAppl. Phys. Lett.78200140764080
- S.KlauerM.WohleckeS.KapphanPhys. Rev. B45199227862799
- S.CarrascosaL.ArizmendiJ. Appl. Phys.73199327092713
- D.P.BirnieJ. Mater. Sci.281993302315
- A.El-BachiriF.BennaniM.BousselamtiSpectrosc. Lett.472014374380