
Abstract
This paper describes a method to fabricate gadolinium hydroxide (Gd(OH)3) nanoparticles. An opaque solution was prepared by adding basic anion exchange resin (BAER) to a Gd(NO3)3 aqueous solution at room temperature and aging the solution for 12–24 h; the solution became basic because of the exchange of H2O with OH−. The particles in the opaque solution have a needle structure, and their crystal structure was hexagonal Gd(OH)3. Their longitudinal and lateral average particle sizes tend to increase in the ranges of 175.0–222.1 and 33.9–52.3 nm when the aging time increases from 12 to 24 h, respectively. The relaxivity value for T1-weighted imaging was 0.79 mM−1 s−1 for the solution that was prepared at the aging time of 18 h, which was ca. 20% of that for a commercial Gd complex contrast agent.
1 Introduction
Gadolinium (Gd) compounds can function as a contrast agent for magnetic resonance imaging (MRI) in medical diagnosis [Citation1–Citation3]. The use of MR contrast agents exerts an influence on the longitudinal (T1) and transverse (T2) relaxation times of nearby protons on water, which changes its nuclear magnetic resonance signal intensity. As a result, images taken by the MRI technique are brightened and darkened with the T1 and T2 relaxations, respectively. For Gd-based contrast agents, T1 relaxation is mainly changed because of seven unpaired electrons of Gd ions.
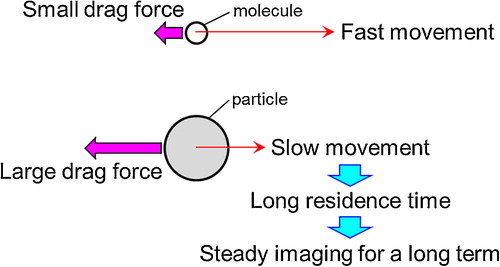
Typical commercial Gd compound-based contrast agents are solutions that homogeneously dissolve Gd complexes at the molecular level. The Gd compound molecules are not strongly dragged in fluid because of their small sizes. Consequently, they cannot stay in living bodies for a long period of time, which makes it difficult to take steady images. The formation of Gd compound particles or an increase in their projected area is a promising solution to the problem because the drag force for Gd compound particles with a larger projected area than the molecules should be larger than the drag force for the molecules. Thus, their residence time increases and may contribute to steady imaging. This explanation is illustrated in . However, because large particles tend to settle as sediment in solvent, the particle size is not necessarily as suitable as it is large.
Fig. 1 Illustration on effect of formation of particles containing contrast agents on imaging.
The growth of a tumor generated in tissue produces a number of slits with a size of several hundred nm on the vessel wall near the tumor. Materials such as molecules, polymers and fine particles that are smaller than the slit size may be able to pass through the slit. Their discharge from the tumor is controlled because the lymph, which allows discharge, is premature in the tumor. This behavior is called an enhanced permeation and retention (EPR) effect [Citation4–Citation6]. Accordingly, the particle formation has another advantage: particles that show imaging properties may be able to detect the tumor because of the EPR effect.
From the aforementioned viewpoint, we have studied the fabrication of Gd compound particles [Citation7,Citation8] and particles that contain Gd compound [Citation9–Citation11] and their silica-coating [Citation7–Citation11] because the processes increase the apparent size of the Gd compound. The Gd compound was synthesized using precipitation methods, where the pH of the solution that contained Gd salts was increased to promote the precipitation reactions of Gd compound with the addition of chemicals, such as sodium hydroxide and urea. Although these methods were useful for the particle formation, some chemicals, such as sodium ion, ammonium ion and carbonate ion, which were derived from sodium hydroxide and urea, remained as impurities in the produced particle colloid solutions. The presence of a large amount of ions, ammonium ions may provide particle aggregation and be toxic to living bodies, which is derived from amines.
Basic anion exchange resins (BAERs) exchange anions with hydroxide ions so that the solution pH increases, which induces the precipitation reaction of Gd compound. Only hydroxide ions are released from the resins, and anions that are derived from the added chemicals to increase the pH are maintained in the BAERs during ion exchange, which reduces the amount of impurities in the solution.
The present work proposes a method to fabricate Gd hydroxide (Gd(OH)3) nanoparticles using BAER. A colloid solution of Gd(OH)3 nanoparticles was prepared using a simple process that ages a Gd salt aqueous solution in the presence of the BAER. The present work also studies the MRI properties of the Gd(OH)3 particle colloid solution.
2 Experimental
2.1 Materials
Gd nitrate hexahydrate (Gd(NO3)3·6H2O) (99.5%, Kanto Chemical Co., Inc.) was used as received and as a raw chemical for Gd(OH)3 nanoparticles. A precipitation inducer in the preparation of Gd(OH)3 nanoparticles was BAER (Dowex® Monosphere® 550A, Dow Chemical Company). The BAER is spherical, and has a particle size of 590 ± 50 μm. Phenolphthalein (>98.0%, Kanto Chemical Co., Inc.) was used to confirm that the pH of solution increases with the addition of BAER. A phenolphthalein solution was prepared by dissolving the phenolphthalein in ethanol (99.5%, Kanto Chemical Co., Inc.) at the phenolphthalein concentration of 1 g/L. Water that was ion-exchanged and distilled with a Shimadzu SWAC-500 was used in all of the preparations.
2.2 Preparation
The BAER was dispersed in water that was deaerated by N2 gas bubbling. An aqueous solution of Gd(NO3)3 was added to the water that contained the BAER immediately after its preparation, and the mixture was aged at 35 °C for 12–24 h after vigorous stirring for a few minutes. The initial concentrations of Gd(NO3)3 and the BAER were 1.0 × 10⁻³ M and 10 g/L, respectively. The BAER was removed from the obtained Gd(OH)3 particle colloid solution by decantation. The Gd(OH)3 particles in the colloidal solution were washed by repeating centrifugation, supernatant removal, and water addition and were sonicated three times.
2.3 Characterization
The samples were characterized using transmission electron microscopy (TEM) and X-ray diffractometry (XRD). TEM was performed with a JEOL JEM-2000FX II microscope that operated at 200 kV. The samples for TEM were prepared by dropping and evaporating the nanoparticle suspensions on a collodion-coated copper grid. Dozens of particle diameters were measured to the 0.1 nm unit in the TEM images by a Mitsutoyo CD-15CX digimatic caliper, to determine the averaged particle size and standard deviation of the particle size distribution. XRD measurements were performed with a Rigaku RAD-B that operated at 7.5 kW CuKα radiation using a wide-angle goniometer. The samples for the XRD were obtained in the identical manner as the sample powder in the IR.
The actual Gd concentrations in particle colloid solutions were measured using inductively coupled plasma (ICP) emission spectroscopy. The ICP measurement was performed with a Shimadzu ICPS-7510 atom emission spectrometer. Emission from gadolinium that should have a wavelength of 342.247 nm was detected for measuring the Gd concentration. The samples for ICP were prepared by completely dissolving the particles with aqua regia and subsequently diluting the obtained solution with water to make its concentrations suitable for the measurements.
To estimate the MR signal intensity, T1-weighted images of colloid solutions with different Gd concentrations were taken with a Bruker AVANCE III 400WB magnetic resonance imaging system at a static magnetic field of 9.4 T. The times of echo and repetition were 8.5 and 1500 ms, respectively. The as-prepared colloid solution was diluted with water to prepare various colloid solutions with Gd concentrations.
3 Results and discussion
3.1 Morphology of particles
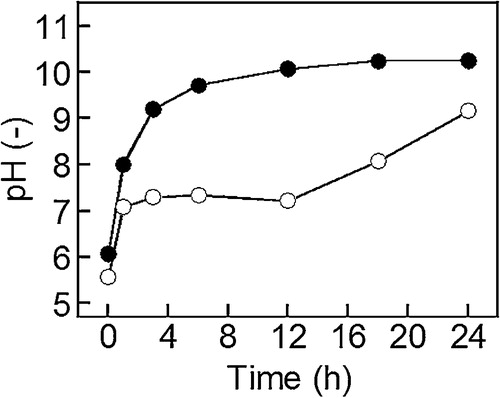
(a) shows pH of water containing BAER as a function of aging time. The pH increased with an increase in aging time. OH− was released from the BAER into the solution due to ion-exchange, which increased the pH of the solution. (b) shows pH of the Gd(NO3)3 aqueous solution containing BAER as a function of aging time. The pH increased with an increase in aging time, of which tendency was similar to the case of the water containing BAER without Gd(NO3)3 shown in (a). This result indicated that the ion-exchange followed by the pH increase took place even with the presence of Gd(NO3)3.
Fig. 2 pHs of water containing (a) BAER (●) and (b) Gd(NO3)3 aqueous solution containing BAER (○) as a function of aging time. The BAER concentrations were 10 g/L, and the initial Gd(NO3)3 concentration in the Gd(NO3)3 aqueous solution was 1.0 × 10⁻³ M.
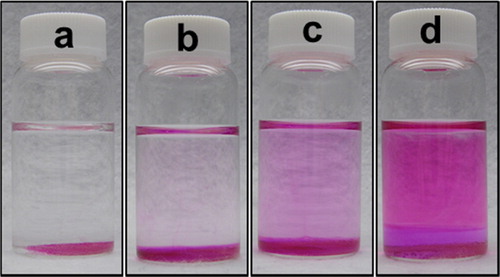
shows photographs of the Gd(NO3)3 aqueous solutions containing phenolphthalein in the presence of BAER. A few drops of the phenolphthalein solution were added to the aqueous solution, and the aqueous solution was aged with no stirring. When the aging time increased, the color of the solution became pink due to the increase in pH. It was noted that the pink color was uniform in the solution. This observation indicated that the pH increase took place uniformly in the solution, which expected that particles with uniform morphology could be produced with the present method using the BAER.
Fig. 3 Photographs of Gd(NO3)3 aqueous solutions (a) 0 h, (b) 3 h, (c) 6 h, and (d) 24 h after the addition of BAER. The concentrations of Gd(NO3)3 and BAER were 1.0 × 10⁻³ M and 10 g/L, respectively.
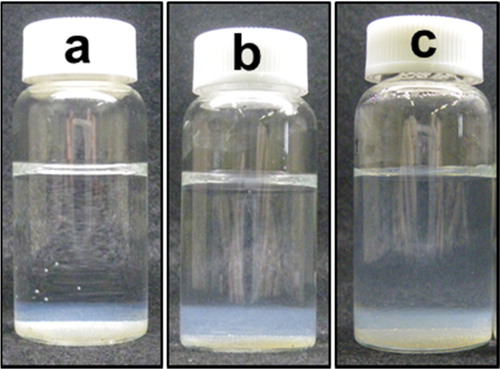
In a preliminary experiment, it was confirmed by naked eyes that no sediment was produced in the Gd(NO3)3 aqueous solutions in the presence of BAER under stirring. Fluid flow provided by the stirring was considered to prevent generated nuclei of gadolinium hydroxide from growing to form particles. shows photographs of the Gd(NO3)3 aqueous solutions in the presence of BAER, which were aged after vigorous stirring. The BAERs were sedimented on the bottom of the bottles. White products or sediment were obtained for all of the examined reaction times. The increase in pH after the BAER addition caused the production. White sediments were present together with the BAERs at the bottom. This observation indicated that the pH increase occurred predominantly near the BAER. The layer of sediments appeared to thicken with the increase in reaction time, which indicated that the released OH− diffuses toward the top.
Fig. 4 Photographs of Gd(NO3)3 aqueous solutions (a) 12 h, (b) 18 h, and (c) 24 h after the addition of BAER. The initial concentrations of Gd(NO3)3 and the BAER were 1.0 × 10⁻³ M and 10 g/L, respectively.
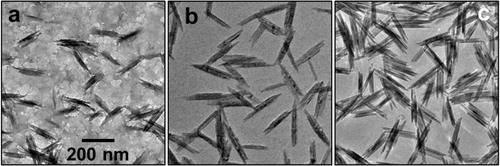
shows the TEM images of the particles that are produced at different reaction times. The particles had a needle-like structure for all of the examined reaction times. If the particles are crystalline, they should have various crystal planes. The crystal growth rate should depend on the type of crystal face. Various crystal growths occurred on each crystal face with different crystal growth rates, which produced non-spherical particles. Their longitudinal/lateral sizes were 175.0 ± 36.4/33.9 ± 9.1 nm for 12 h, 222.1 ± 50.3/45.4 ± 13.6 nm for 18 h and 218.3 ± 43.4/52.3 ± 20.5 nm for 24 h. Up to 18 h, both longitudinal and lateral sizes increased with increasing reaction time because the particle growth occurred with the progression of the particle formation reaction. The sizes leveled off over 18 h, which indicated that the generation of particle nuclei almost finished at 18 h.
Fig. 5 TEM images of particles that were produced at the reaction times of (a) 12 h, (b) 18 h and (c) 24 h.
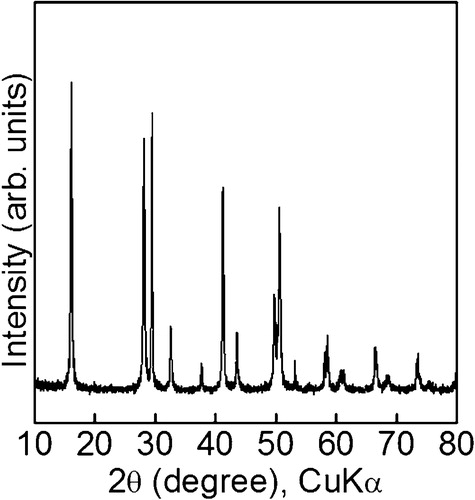
shows an XRD pattern of the particles. The detected peaks were at 16.2°, 28.1°, 29.5°, 32.6°, 37.7°, 41.3°, 43.7°, 49.8°, 50.6°, 53.2°, 58.6°, 60.9°, 66.5°, 68.6° and 73.7°. All the peaks were attributed to hexagonal Gd(OH)3 (JCPDS card No.: 83-2037), which proved that Gd(OH)3 was produced using the proposed method. The crystallites were confirmed to be produced by the XRD measurement. The mechanism on formation of needle-like structure was speculated to be explained with the dependence of crystal growth rate on the type of crystal face in the TEM observation. The confirmation of production of crystallites supported the explanation, although a precise mechanism on the formation of needle-like structure is still unclear.
The ICP measurement showed that in the Gd(OH)3 particle colloid solution with the initial Gd concentration of 1.0 × 10⁻³ M, the actual Gd concentration was 6.61 × 10⁻⁴ M, which indicated that 66.1% of the Gd(NO3)3 was transformed to the Gd(OH)3 particles.
Fig. 6 XRD pattern of the particles. The sample was identical to the sample in (b).
3.2 MRI property
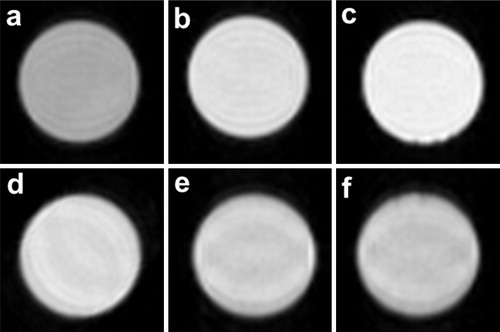
shows the T1-weighted images of the Gd(OH)3 particle colloid solutions with various actual Gd concentrations. The as-prepared Gd(OH)3 particle colloid solution with the actual Gd concentration of 6.61 × 10⁻⁴ M was diluted with water to adjust the Gd concentration to 0.03, 0.1, 0.3, and 0.6 M. The solution with the Gd concentration of 0 M was water containing no Gd(NO3)3. Strong magnetic resonance provides positive images with light contrast for T1-weighted imaging. All of the examined solutions were clearly imaged against a black background, and the light contrast of the image tended to increase when the actual Gd concentration increased.
Fig. 7 T1-weighted images of the Gd(OH)3 particle colloid solutions with actual Gd concentrations of (a) 0 mM, (b) 0.03 mM, (c) 0.1 mM, (d) 0.3 mM, (e) 0.6 mM and (f) 0.661 mM.
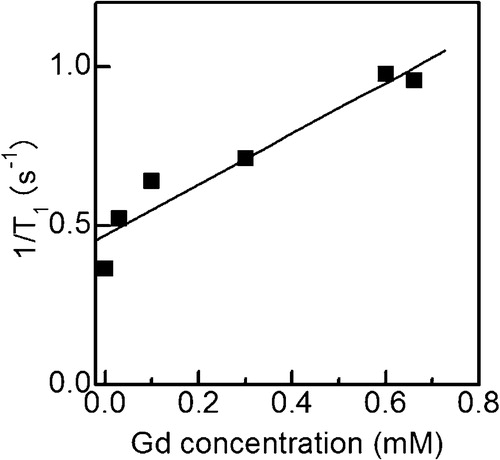
shows a plot of the longitudinal relaxation rate (1/T1) of the Gd(OH)3 particle colloid solution as a function of the actual Gd concentration. The relaxation rate linearly increased when the actual Gd concentration increased. The relaxivity (r1) is defined as the slope of the relaxation rate with respect to the actual Gd concentration and is commonly used as a guideline for the performance of positive contrast agents [Citation12–Citation14]. The r1 value, which was calculated from the linear fitting, was 0.79 mM−1 s−1. Next, this value was compared with that of Magnevist (gadopentetate dimeglumine), which is a typical commercial MRI contrast agent. Because the r1 value of Magnevist, which was measured in our previous work [Citation8], is 4.23 mM−1 s−1, the r1 value of the Gd(OH)3 particle colloid solution was 18.7% of that of Magnevist. The active exchange of the protons with the contrast agent decreases T1 and increases r1 [Citation14,Citation15]. Because most Gd ions should have been present inside the particles, the interaction between water protons and Gd ions was not as significant as that of the Gd complex molecules in Magnevist. Thus, a smaller r1 was obtained for the Gd(OH)3 particle colloid solution.
Fig. 8 Longitudinal relaxation rate (1/T1) of the Gd(OH)3 particle colloid solution as a function of the actual Gd concentration.
4 Conclusions
The present work proposed a preparation method of a colloid solution of Gd(OH)3 nanoparticles. The process is composed of the addition of BAER to a Gd(NO3)3 aqueous solution at room temperature and aging the solution for 12–24 h, which makes the solution basic after the exchange of H2O with OH−, to prepare an opaque colloid solution. The opaque solution contains the particles with a needle structure and a crystal structure of hexagonal Gd(OH)3. The average longitudinal and lateral sizes of the particles are 175.0–222.1 and 33.9–52.3 nm, respectively. The particle sizes tend to increase when the aging time increases in the examined range. The r1 value for the T1-weighted imaging of the solution that was prepared at the aging time of 18 h is 0.79 mM−1 s−1, which corresponds to ca. 20% of that for a commercial Gd complex contrast agent. The Gd(OH)3 particle colloid solution has the function of an MRI contrast agent with respect to its r1 value for T1-weighted imaging. Further studies, particularly on the toxicity of particle colloid solutions, are in progress toward practical use.
Acknowledgments
The authors acknowledge the contribution of Prof. T. Noguchi at the College of Science of Ibaraki University, Japan (current affiliation: Faculty of Arts and Science of Kyushu University, Japan) for his help with the TEM observation, and to Ms. T. Li and Ms. M. Yokokawa at the Graduate School of Science and Engineering of Ibaraki University, Japan for the discussion on the pH of solutions. This work was supported by a Grant-in-Aid for Scientific Research on Innovative Areas “Nanomedicine Molecular Science” (No. 2306) from the Ministry of Education, Culture, Sports, Science, and Technology of Japan and JSPS KAKENHI Grant Number 24310085.
Notes
Peer review under responsibility of The Ceramic Society of Japan and the Korean Ceramic Society.
References
- A.MakinoH.HaradaT.OkadaH.KimuraH.AmanoH.SajiM.HiraokaS.KimuraNanomed. Nanotechnol.72011638646
- L.TelgmannM.SperlingU.KarstAnal. Chim. Acta7642013116
- J.TangY.ShengH.HuY.ShenProg. Polym. Sci.382013462502
- T.HaraS.IriyamaK.MakinoH.TeradaM.OhyaColloids Surf. B7520104246
- H.HatakeyamaH.AkitaH.HarashimaAdv. Drug Deliv. Rev.632011152160
- H.MaedaH.NakamuraJ.FangAdv. Drug Deliv. Rev.6520137179
- H.MorimotoM.MinatoT.NakagawaM.SatoY.KobayashiK.GondaM.TakedaN.OhuchiN.SuzukiJ. Sol-Gel Sci. Technol.592011650657
- Y.KobayashiH.MorimotoT.NakagawaK.GondaN.OhuchiAdv. Nano Res.12013159169
- Y.KobayashiJ.ImaiD.NagaoM.TakedaN.OhuchiA.KasuyaM.KonnoColloids Surf. A30820071419
- Y.KobayashiT.NozawaT.NakagawaK.GondaM.TakedaN.OhuchiJ. Mater. Sci.47201218521859
- Y.KobayashiH.InoseT.NakagawaY.KubotaK.GondaN.OhuchiMater. Focus22013369373
- F.XuH.HanH.ZhangJ.PiY.FuMagn. Reson. Imaging292011827834
- G.-P.YanZ.LiW.XuC.-K.ZhouL.YangQ.ZhangL.LiF.LiuL.HanY.-X.GeaJ.-F.GuoInt. J. Pharmaceut.4072011119125
- Y.LiuZ.ChenC.LiuD.YuZ.LuN.ZhangBiomaterials32201151675176
- H.Bagher-EbadianR.PaudyalT.N.NagarajaR.L.CroxenJ.D.FenstermacherJ.R.EwingNeuroimage542011S176S179