
Abstract
ZnO doped with different concentrations of Al2O3 (2, 4, 6, 8 and 10 wt%) is prepared by conventional solid-state reaction method. X-ray diffraction results revealed that the samples were crystalline with a hexagonal wurtzite phase. As the concentration of alumina (Al2O3) increases in ZnO, the X-ray diffraction peaks shifts towards higher angle. This shifting in peak position and decrease in intensity reflect that Al is successfully replaced Zn in ZnO matrix. X-ray peak broadening analysis was used to evaluate the crystallite size and lattice strain by the Williamson–Hall (W–H) method and size-strain plot (SSP) method. The physical parameters such as strain, stress, and energy density values were also calculated using W–H method with different models namely uniform deformation model, uniform stress deformation model and uniform deformation energy density model. The surface morphology and elemental analysis of the prepared samples were characterized by field emission scanning electron microscopy and energy dispersive spectra.
1 Introduction
Zinc Oxide is a well known important semiconductor due to its fundamental and technological importance. It is a wide band gap semiconductor (3.37 eV) with high exciton binding energy of 60 meV, excellent chemical stability, abundance in nature and non-toxic. It had a wide range of applications such as solar cells, luminescent devices, laser diodes, chemical sensors, surface acoustic wave devices etc, whose conductivity can be tuned by controlling the deviation from stoichiometry and by doping [Citation1 Citation2013;Citation4]. Al2O3 is an n-type semiconducting material with a wide band gap of 8.8 eV, different crystalline form and good thermal stability. It can be act as a good catalyst with semiconductor when the gases such as H2S and Ethanol come in contact with it. Group IIIA elements (Al, Ga, In) have been used to improve the electrical conductivity and thermal stability of ZnO material [Citation5 Citation2013;Citation7]. In this work, alumina doped ZnO ceramics were prepared by the conventional solid-state reaction method using ZnO and Al2O3 as the starting materials. In the conventional oxide-mixing technique, the powders produced are more homogeneous after the sintering process [Citation8].
X-ray peak profile analysis (XPPA) is used to estimate the micro-structural quantities and correlate them with the observed material properties. XPPA is an averaging method and a powerful tool to estimate the crystallite size and lattice strain [Citation9]. The crystallite size and lattice strain affect the Bragg peak to increase the peak intensity, peak width and a shift in the 2θ peak position. The methods reported in the literature to estimate the crystallite size and lattice strain are the Warren–Averbach analysis, Rietveld refinement and pseudo-Voigt function [Citation10 Citation2013;Citation12]. However, the Williamson–Hall (W–H) analysis is a simplified integral breadth method used for estimating crystallite size and lattice strain, considering the peak width as a function of 2θ [Citation13,Citation14]. In the present work, XPPA is carried out to evaluate the crystallite size (D), lattice strain (ε), lattice stress (σ) and lattice strain energy density (u) of Al2O3 doped ZnO ceramics based on modified W–H plots using uniform deformation model (UDM), uniform stress deformation model (USDM), uniform deformation energy density model (UDEDM) and size-strain plot (SSP). Literature survey reports that a detailed study using these models on solid-state sintered ZnO doped with different concentrations of Al2O3 is not yet reported.
2 Experimental details
ZnO doped with 2, 4, 6, 8 and 10% of alumina (Al2O3) were synthesized by conventional solid-state reaction method. The appropriate stoichiometry of the constituent oxides i.e., ZnO (Sigma Aldrich, 99.999%) and Al2O3 (Sigma Aldrich, 99.9%) was milled in planetary ball miller (Retsch PM 200) with tungsten carbide milling media (10 mm dia balls) at a ball-to-powder weight ratio of 10:1 and at a speed of 350 rpm. Milling was carried out in ethyl alcohol medium for a period of 24 h. These mixed powders was calcined at 900 °C for 10 h in programmable SiC furnace to avoid oxygen deficiency and to make proper incorporation of Al through Zn lattice sites and then pressed into cylindrical pellets of 2 mm thickness and 12 mm in diameter using PVA (polyvinyl alcohol) as a binder at a pressure of 400 kg/cm2. Finally these pellets were sintered at 1200 °C for 6 h with a heating and cooling rate of 10 °C/min. The X-ray diffraction (XRD) patterns of the compounds were recorded using Philips: PW 1830 with CuKα radiation (λ = 1.5418 Å) in a range of Bragg angles 2θ (10° < 2θ < 70°) with a step rate of 2° min−1 at room temperature. The X-ray diffraction data were refined using the FULLPROF program of the Rietveld method. The surface morphology of the synthesized samples has been carried out using Field Emission Scanning Electron Microscope (FESEM, Model: Carl Zeiss, EVO MA15) instrument operated at 20 kV with a resolution of 3.5 nm. The compositional analysis of ZnO doped with Al2O3 was carried out using Energy Dispersive X-ray Spectroscopy (EDS, Model: Horiba, EMAX, 137 eV).
3 Results and discussion
3.1 Structural properties
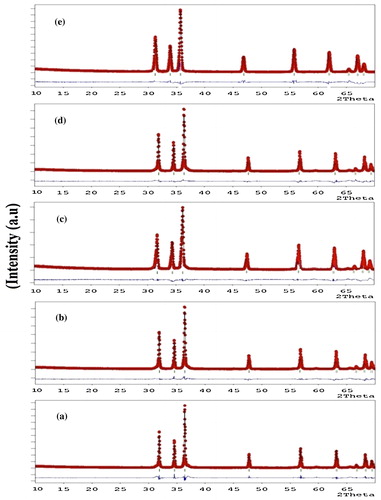
X-ray diffraction patterns of ZnO doped with different concentrations of alumina (Al2O3) are shown in . The X-ray diffraction peaks at an angle 2θ are indexed by their miller indices (1 0 0), (0 0 2), (1 0 1), (1 0 2), (1 1 0), (1 0 3), (2 0 0), (1 1 2) and (2 0 1) corresponding to ZnO (space group p63mc, JCPDS no. 36–1451) indicating that the phase of the sample was wurtzite structure. The XRD peaks shifts towards the higher angles with the increase of doping concentration of Al2O3 in ZnO. The major diffraction peak intensities increased with the increase of alumina content upto 6% and then at higher doping concentrations (8 and 10%) of alumina the peak intensity decreased, which indicates Al-doping resulted in a decrease in the crystalline quality. A large amount of Al dopants resulted in lattice disorder, which is associated with the stress generated. Besides the stress problem, the grains grew more easily when Al dopants were incorporated with ZnO. The lattice parameters ‘a’ and ‘c’ of the prepared samples are calculated from X-ray diffraction measured data using the equations as reported in the previous literature [Citation15]. The volume of the unit cell and number of unit cells in the particle are determined by the equations as reported in the previous work [Citation16]. The volume (V) of the unit cell and number of unit cells in the particle (n) decreases with the increase of alumina concentration in ZnO. The structural parameters of different concentrations of Al2O3 doped ZnO estimated from X-ray diffraction data are given in .
Table 1 Structural parameters of ZnO doped with different concentrations of alumina.
Fig 1 X-ray diffraction patterns of ZnO doped with (a) 2% Al2O3; (b) 4% Al2O3; (c) 6% Al2O3; (d) 8% Al2O3 and (e) 10% Al2O3.

XRD Rietveld refinements were performed with FULLPROF software program. The wurtzite ZnO structure (space group 186, P63mc) and Al (space group 225, Fm-3m) were selected as the starting model structures. The accurate unit cell parameters of various compositions of alumina doped ZnO were determined by Rietveld refinement of the observed X-ray diffraction profile [Citation17]. Pseudo-Voigt peak profile function was adopted and the background was approximated by linear interpolation between a set of background points with refinable heights. The refinement results of XRD patterns of alumina doped ZnO samples are shown in . The red and black lines represent the observed and fitted data, respectively. The blue line represents the difference between the observed and fitted data. The refined XRD patterns are in very good agreement with the measured data. No second phase is observed which revealed the first indication that the dopant atoms are incorporated in the wurtzite structure. The lattice parameters (a and c) decreases with the increase of doping concentrations of Al2O3 in ZnO. This behaviour has been attributed to the fact that the Zn atoms are replaced by the Al atoms. Because the ionic radii of Zn2+ and Al3+ are 0.074 nm and 0.053 nm, respectively with increasing substitution of Al for Zn the lattice parameters ‘a’ and ‘c’ should decrease monotonically due to the smaller radius of Al compared with that of Zn, reflecting the lattice contraction. The obtained reliability factors Rp, Rwp, Goodness-of-fitting (GOF), RBragg, χ2, RF and lattice parameters calculated from the Rietveld refinement are tabulated in .
Table 2 Rietveld refinement results for ZnO doped with different concentrations of alumina.
Fig. 2 Rietveld refinement analysis of XRD patterns of ZnO doped with (a) 2% Al2O3; (b) 4% Al2O3; (c) 6% Al2O3; (d) 8% Al2O3 and (e) 10% Al2O3.
3.2 Williamson–Hall (W–H) methods
The broadening of XRD pattern is attributed to the crystallite size-induced or strain induced broadening. The significance of the broadening of peaks evidences grain refinement along with the large strain associated with the powder. The instrumental broadening (βhkl) was corrected, corresponding to each diffraction peak using the relation(1)
The average crystallite size (D) was calculated using Scherrer’s formula [Citation18](2) where D is crystallite size, K (=0.94) is shape factor and λ (=0.154 nm) is the wavelength of Cukα radiation. It is found that the average crystallite size decreases from 56 to 25 nm with increasing alumina concentration in ZnO. It may be due to the enhancement in surface-to-volume ratio.
The strain induced in powders due to crystal imperfection and distortion was calculated using the formula [Citation19](3)
Assuming that the particle size and strain contributions to line broadening are independent to each other and both have a Cauchy-like profile, the observed line breadth is simply the sum of Eqs. Equation(2)(2) and Equation(3)
(3) .
(4) By rearranging the above equation
(5)
The above Eqs. Equation(4)(4) and Equation(5)
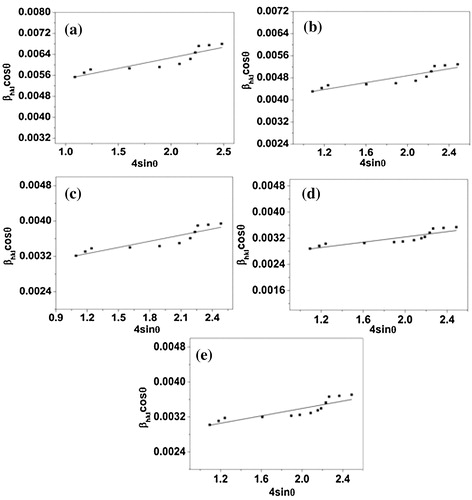
(5) are Williamson–Hall equations. To make Williamson–Hall analysis, a plot is drawn with 4sin θ along the x-axis and βhklcos θ along the y-axis for all orientation peaks of Al2O3 doped ZnO ceramics is shown in . The crystalline size was estimated from the y-intercept and the strain (ε) from the slope of the linear fit to the data. In UDM the strain is assumed to be uniform in all crystallographic directions, thus considering the isotropic nature of the crystal, where the material properties are independent of the direction along which they are measured. It is clear that there is a decrease in the lattice strain with increasing doping concentrations of Al2O3 in ZnO. The uniform deformation model for Al2O3 doped ZnO ceramics are shown in .
Fig. 3 W–H analysis of ZnO doped with (a) 2% Al2O3; (b) 4% Al2O3; (c) 6% Al2O3; (d) 8% Al2O3 and (e) 10% Al2O3 assuming UDM.
In the uniform stress deformation model (USDM) there is a linear proportionality between stress and strain given by σ = Yhklε which is known as the Hook’s law within the elastic limit. In this relation, σ is the stress of the crystal and Y is the Young’s modulus. Hook’s law is a reasonable approximation to estimate the lattice stress. In this approach, the Williamson–Hall equation is modified by substituting the value of ε in the second term of Eq. Equation(5)(5) yields
(6)
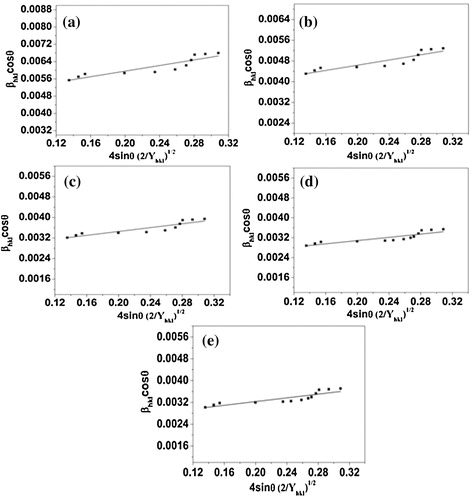
Yhkl is the Young’s modulus in the direction perpendicular to the set of crystal lattice plane (h k l). The uniform stress can be calculated from the slope line plotted between 4sin θ/Yhkl and βhklcos θ and the crystallite size (D) from the y-intercept as shown in . The strain can be measured if Yhkl of hexagonal ZnO nanoparticles is known. For samples with a hexagonal crystal phase, Young’s modulus Yhkl is related to their elastic compliances Sij as [Citation20](7) where S11, S13, S33, and S44 are the elastic compliances of ZnO and their values are 7.858 × 10⁻¹², 2.206 × 10⁻¹², 6.940 × 10⁻¹² and 23.57 × 10⁻¹² m2N−1, respectively [Citation21,Citation22].
The uniform deformation energy density model (UDEDM) is used to determine the energy density of a crystal. In Eq. Equation(4)(4) , we considered that the crystals are assumed to have a homogeneous, isotropic nature. In many cases, the assumption of isotropy and homogeneity is not justified. Moreover, the constants of proportionality associated with the stress-strain relation are not independent when the strain energy density ‘u’ is considered. According to Hooke’s law, the energy density u as a function of strain is u = ε2Yhkl/2. Therefore, Eq. Equation(6)
(6) can be modified to the form
(8)
Fig. 4 W–H plots of ZnO doped with (a) 2% Al2O3; (b) 4% Al2O3; (c) 6% Al2O3; (d) 8% Al2O3 and (e) 10% Al2O3 using USDM.

Plot of βhklcos θ and 4sin θ (2/Yhkl)1/2 is shown in and the value of energy density ‘u’ was calculated from the slope of the linear fit and the crystallite size is estimated from the y-intercept. From Eqs. Equation(6)(6) and Equation(8)
(8) , the deformation stress and deformation energy density are related as u = σ2/Yhkl. The lattice strain can be calculated by knowing the Yhkl values of the sample.
Fig. 5 W–H analysis of ZnO doped with (a) 2% Al2O3; (b) 4% Al2O3; (c) 6% Al2O3; (d) 8% Al2O3 and (e) 10% Al2O3 assuming UDEDM.
3.3 Size-strain plot (SSP) method
The corresponding W–H plots described that line broadening was essentially isotropic. This highlights that the diffracting domains were isotropic due to the contribution of microstrain. In case of isotropic line broadening, a better evaluation of the size-strain parameters can be obtained by considering an average “size-strain plot” (SSP). This method had an advantage that less importance is given to data from reflections at high angles, where the precision is usually much lower. In this method, it is assumed that the crystallite size profile is described by a Lorentzian function and the strain profile by a Gaussian function [Citation23]. Accordingly, we have:(9) where K is a constant that depends on the shape of the particles; for spherical particles it is given as 3/4. In , similarly to the W–H methods, the term (d βhkl cos θ)2 is plotted with respect to (d2 βhkl cos θ) for the all orientation peaks of alumina doped ZnO. In this case, the particle size is determined from the slope of the linearly fitted data and the root of the y-intercept gives the root mean square (RMS) strain.
Fig. 6 Plot of (dhkl βhkl cos θhkl)2 versus dhkl2 βhkl cos θhkl.
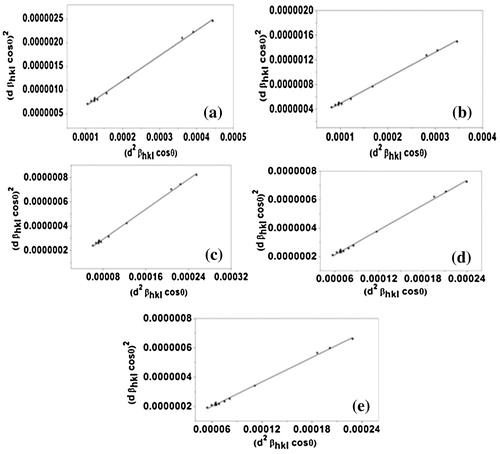
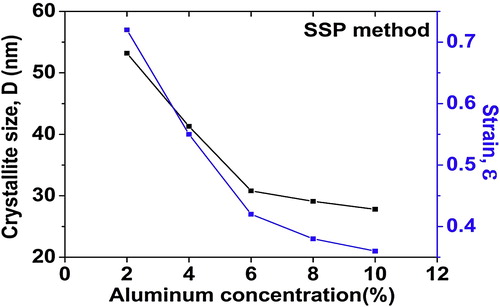
The results obtained from the Scherrer method, W–H models (UDM, USDM and UDEDM) and SSP methods are shown in Figs. 7–9 . The values of average crystallite size of alumina doped ZnO ceramics obtained from the different models are more or less similar, implying that the inclusion of strain in various forms has a very small change in the average crystallite size. By inspection of the plots, it appears that the result of the SSP model is found to be more accurate than the UDM, USDM and UDEDM, as the data were fitted more accurately in this method, with all high-intensity points touching the linear fit. It was observed that the strain and stress values decreased with decreasing average crystallite size as the dopant concentration was increased.
Fig. 7 Variation of crystallite size (D) with alumina concentration obtained from Scherrer method.
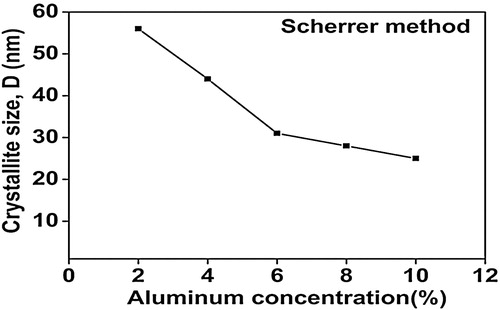
Fig. 8 Variation of D, ε, σ and u with alumina concentration estimated from (a) UDM; (b) USDM; and (c) UDEDM.
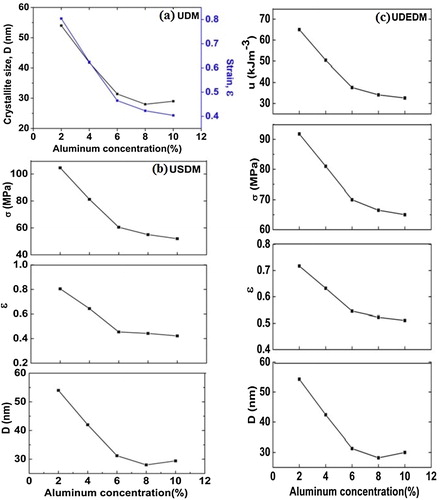
Fig. 9 Variation of crystallite size (D) and strain (ε) with alumina concentration obtained from SSP method.
3.4 Surface morphology and elemental analysis
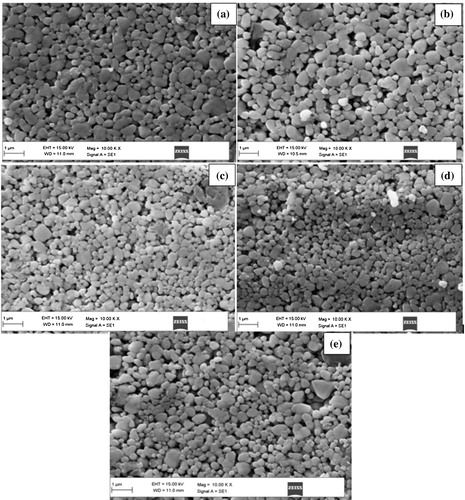
FESEM images of ZnO doped with different concentrations of Al2O3 are shown in (a)–(e). In the images, the grey grains are ZnO grains and the white ones are Al2O3 grains. It can be observed from the micrographs that the surface morphology of Al2O3 doped ZnO shows porous nature and petal-shaped grains oriented randomly of sizes varies from 190 to 276 nm. It can be seen that as the Al2O3 content is increasing the samples are becoming dense; shows less pores and the distribution of the grains are uniform. The EDS is recorded to determine the elemental composition of ZnO doped with different concentrations of alumina. The relative compositions obtained from EDS are in an atomic ratio of Zn/O/Al are 46.90/51.27/1.83%,45.37/50.81/3.82%,44.88/49.28/5.84 and 44.37/47.87/7.76%, 42.54/48.50/8.96% for ZnO doped with 2, 4, 6, 8 and 10% of Al2O3.
Fig. 10 FESEM images of ZnO doped with (a) 2% Al2O3; (b) 4% Al2O3; (c) 6% Al2O3; (d) 8% Al2O3 and (e) 10% Al2O3.
4 Conclusions
ZnO doped with different concentrations of Al2O3 were synthesized by conventional solid-state reaction method and characterized by X-ray diffraction. The results of Rietveld analysis indicate that the samples belongs to the hexagonal ZnO phase (space group 186, P63mc) and the cubic Al phase (space group 225, Fm-3m).The lattice parameters (a and c) of the samples are decreasing owing to the lattice contraction, hence confirming that Al has been successfully doped in the lattice. The X-ray peak broadening of the prepared samples are due to the small crystallite size and strain. A modified W–H plot has been worked out to determine the crystallite size and strain-induced broadening due to lattice deformation and energy density value with a certain approximation. The average crystallite size obtained from Scherrer’s formula, W–H analysis and SSP method shows a small variation because of the difference in averaging the particle size distribution. The strain values obtained from the graphs plotted for various forms of W–H analysis i.e., UDM, USDM, and UDEDM were found to be accurate and comparable. The above explained methods were helpful in determining the crystallite size, strain, stress, and energy density value, and among them SSP method is highly preferable to define the crystal perfection.
References
- S.HingoraniV.PillaiP.KumarM.S.MuntaiD.O.ShahMater. Res. Bull.28199313031310
- B.Rajesh KumarT.Subba RaoAppl. Surf. Sci.2652013169175
- S.J.PeartonD.P.NortonK.IpY.W.HeoT.SteinerProg. Mater. Sci.502005293340
- X.ZhangX.PuY.ChenX.GuD.XuS.ZhangMater. Lett.1122013129132
- M.ChenZ.PeiC.SunL.WenX.WangJ. Cryst. Growth2202000254262
- ThEl-NabarawyA.A.AttiaM.N.AlayaMater. Lett.241995319325
- C.LebludM.R.AnseauE.Di RupoF.CambierP.FierensJ. Mater. Sci. Lett.161981539544
- E.Y.GutmanasProg. Mater. Sci.341990261366
- B.D.CullityS.R.StockElements of X-ray Diffraction3rd ed.2001Prentice HallNew Jersey
- H.M.RietveldActa Crystallogr.221967151152
- D.BalzarH.J.LedbetterAppl. Crystallogr.26199397103
- B.E.WarrenB.L.AverbachJ. Appl. Phys.211950595599
- A.Khorsand ZakW.H.Abd. MajidM.E.AbrishamiR.YousefiSolid State Sci.132011251256
- C.SuryanarayanaM.G.NortonX-ray Diffraction: A Practical Approach1998Plenum Press publishingNew York
- P.BinduSabuThomasJ. Theor. Appl. Phys.82014123134
- PreetamSinghAshvaniKumarAjayKaushalDavinderKaurAsishPandeyR.N.GoyalBull. Mater. Sci.312008573577
- J.Rodrigueg-CarvajalFULLPROF 2000: A Program for Rietveld, Profile Matching and Integrated Intensity Refinements for X-ray and Neutron data, version 1.62009Laboratorie Leon, BrillouniGifsuryvette, France
- L.V.AzaroffElement of X-ray Crystallography1968McGraw-HillNew York
- G.K.WilliamsonW.H.HallActa Metall.119532231
- J.ZhangY.ZhangK.W.XuV.JiSolid State Commun.13920068791
- V.D.MoteY.PurushothamB.N.DoleJ. Theor. Appl. Phys.66201218
- J.F.NyePhysical Properties of Crystals: Their Representation by Tensors and Matrices1995Oxford University PressNew York
- M.A.TaglienteM.MassaroNucl. Instrum. Methods Phys. Res. B266200810551061