
Abstract
Crystal structures and electronic transformations of quadruple iron perovskite solid solution Ca1−xSrxCu3Fe4O12 (x = 0.2, 0.4, 0.6, and 0.8) have been investigated by synchrotrons X-ray powder diffraction, Mössbauer spectroscopy, and magnetization measurements. For x = 0.2, a charge disproportionation transition (2Fe4+ → Fe3+ + Fe5+) occur simultaneously with electron charge transfers from Fe to Cu below ∼200 K, as well as CaCu3Fe4O12. In contrast, negative thermal expansions derived from continuous electron charge transfers from Cu and Fe are observed for x = 0.6 and 0.8 at low temperatures below room temperature, as in SrCu3Fe4O12, followed by charge disproportionation transitions. A two-phase coexistence is observed at low temperature below ∼200 K for x = 0.4, indicating that the phase boundary locates in the vicinity of this composition. We have discovered that the Fe–O bond lengths are closely related to their covalency which were estimated from Mössbauer isomer shift parameters. The Fe–O bond covalency plays a crucial role in the types of electronic phase transitions for the Ca1−xSrxCu3Fe4O12 and R3+Cu3Fe4O12 (R: trivalent rare earth metal ions, Y, La–Lu) systems, where the two different low-temperature electronic phases are separated by a common isomer shift value of ∼0.17 mm s−1.
1 Introduction
Perovskite transition metal oxides are known for their rich variety of properties, including superconductivity, ferromagnetism, magnetoresistance, and ferroelectricity. Consequently, their structural and electronic properties have been extensively investigated over the past few decades [Citation1 Citation2013;Citation3]. The application of high-pressure synthesis under several GPa has resulted in expanding variety of novel perovskites and related compounds owing to substantial changes in ionic radius ratio under high pressures. Recently, the quadruple perovskite series AA’3B4O12 has been attracting much interest, exhibiting a wide range of intriguing phenomena such as a large magnetoresistance [Citation4,Citation5], giant dielectric constant [Citation6,Citation7], ordering of charge/spin/orbital [Citation8], multiferroicity [Citation9,Citation10], and catalysis [Citation11 Citation2013;Citation13]. Notably, the ACu3Fe4O12 (A = Ca2+, Sr2+, trivalent rare-earth ions R3+, Bi3+, or Ce4+) [Citation14 Citation2013;Citation19] series displays various electronic phase transitions. Thus, CaCu3Fe4O12 undergoes a charge disproportionation transition (simplified representation: 2Fe4+ → Fe3+ + Fe5+) at temperatures below 210 K [Citation14], whereas a nominally isoelectronic Sr-analog SrCu3Fe4O12 exhibits a negative thermal expansion (NTE) induced by a gradual intersite charge transfer between Cu and Fe ions, at temperatures ranging between 200 and 270 K (crystal structure in ) [Citation20]. Similarly, isoelectronic R3+Cu3Fe4O12 compounds display two contrasting electronic phase transitions. Thus, for smaller R ions (R = Y, Dy, Ho, Er, Tm, Yb, and Lu), charge disproportionation transitions (8Fe3.75+ → 5Fe3+ + 3Fe5+) are predominant [Citation17,Citation18]. Conversely, abrupt intersite charge transfer transitions (3Cu2+ + 4Fe3.75+ → 3Cu3+ + 4Fe3+) are favored by the larger R ions (R = La, Pr, Nd, Sm, Eu, Gd, and Tb) [Citation15,Citation18]. The origin of the difference between these two electronic phase transitions was initially investigated in terms of an instability of the charge-ordered states at an unequal abundance ratio of Fe3+ and Fe5+ species [Citation21]. However, a systematic study unveiled that strains on R–O and Fe–O bonds dominate the types of electronic phase transitions in RCu3Fe4O12 [Citation18]. On the other hand, structural and electronic properties of CaCu3Fe4O12–SrCu3Fe4O12 solid solutions have not been elucidated to date. Herein, we demonstrate the crystal structures and electronic properties of the solid solution Ca1−xSrxCu3Fe4O12 (x = 0.2, 0.4, 0.6, and 0.8). The electronic phase transitions depend on the Fe–O covalency associated with Fe–O bond lengths and Mössbauer isomer shifts (ISs). This relationship comprises the ACu3Fe4O12 series.
Fig. 1 Crystal structure of Ca1−xSrxCu3Fe4O12.
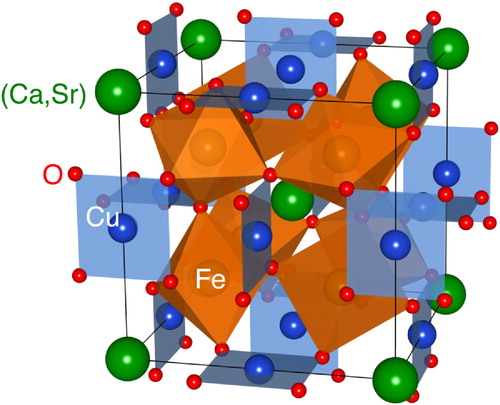
Fig. 2 Observed and calculated SXRD patterns for Ca1−xSrxCu3Fe4O12 (x = 0.2, 0.4, 0.6, and 0.8) at 20 and 300 K. Circles (black) and solid lines (red) represent observed and calculated patterns, respectively. The differences between the observed and calculated patterns are shown at the bottom (blue). The vertical marks (green) indicate the Bragg reflection positions of Ca1−xSrxCu3Fe4O12. The data of x = 0.4 at 20 K were refined using two-phase model.
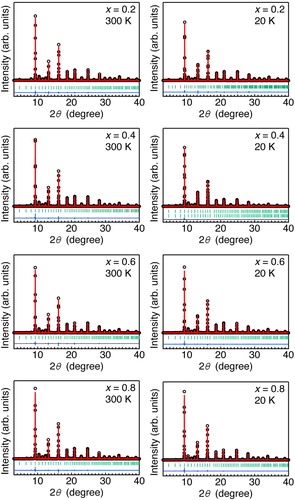
Fig. 3 Room-temperature lattice constant (a) as a function of x for Ca1−xSrxCu3Fe4O12 (x = 0, 0.2, 0.4, 0.6, 0.8, and 1). The data for x = 0 and 1 were taken from Refs. [Citation25,Citation26].
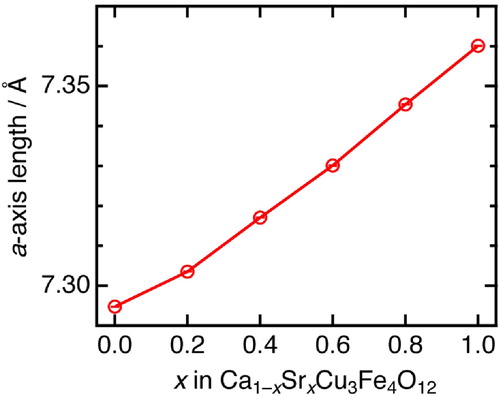
Fig. 4 (a) Temperature dependence of the lattice constant a for Ca1−xSrxCu3Fe4O12 (x = 0, 0.2, 0.4, 0.6, 0.8, and 1). The data for x = 0, 0.6, and 0.8 were obtained from XRD data, x = 0.2 and 0.4 from SXRD data, and x = 1 from Ref. [Citation26]. The error bars are included in the markers. (b) SXRD patterns of Ca1−xSrxCu3Fe4O12 (x = 0.4) in a selected 2θ range (39.5 and 42°) collected at temperatures ranging between 20 and 450 K. The red and blue lines represent deconvoluted Bragg peaks of two phases. The fraction of the two phases at 20 K was estimated to be ∼1:1 by Rietveld refinement.
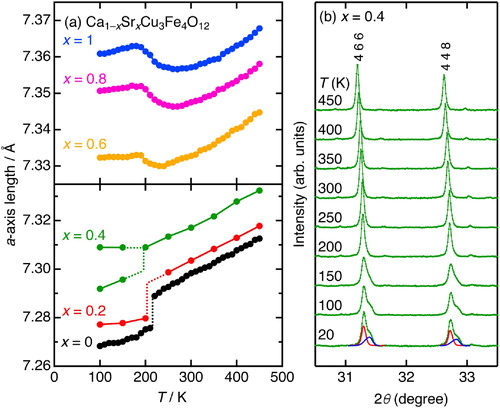
Fig. 5 Cu–O and Fe–O bond lengths at temperatures ranging between 20 and 300 K for Ca1−xSrxCu3Fe4O12 (x = 0, 0.2, 0.4, 0.6, 0.8, and 1). The Fe–O bond lengths were calculated by averaging two Fe–O bonds for the charge-ordered phases (x = 0, 0.2 at 20 K). The data for x = 0 and 1 were taken from Refs. [Citation25,Citation26].
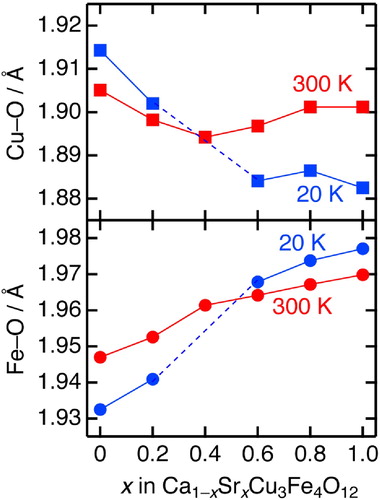
Fig. 6 Temperature dependence of the bond lengths and bond angle for Ca1−xSrxCu3Fe4O12 (x = 0, 0.2, 0.4, 0.6, 0.8, and 1). The data for x = 0 and 1 were taken from Refs. [Citation25,Citation26].
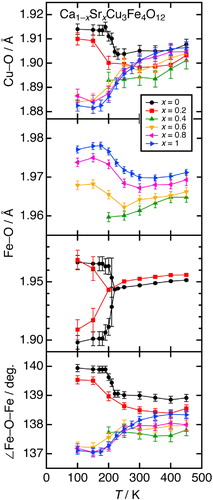
Fig. 7 (a) Temperature dependence of the magnetic susceptibility in Ca1−xSrxCu3Fe4O12 (x = 0, 0.2, 0.4, 0.6, 0.8, and 1) measured in field-cooling mode at temperatures ranging between 5 and 300 K. (b) Isothermal magnetization curves of Ca1−xSrxCu3Fe4O12 (x = 0, 0.2, 0.4, 0.6, 0.8, and 1) at 5 K. The data for x = 0 and 1 were taken from Refs. [Citation25,Citation26].
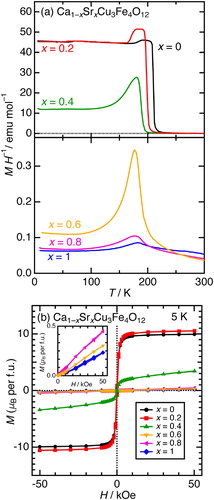
Fig. 8 Mössbauer spectra for Ca1−xSrxCu3Fe4O12 (x = 0.2, 0.4, 0.6, and 0.8). The sextet components attributed to α-Fe2O3 impurities were excluded in the fitting.
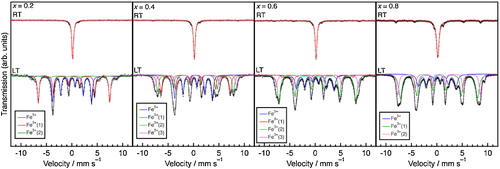
Fig. 9 (a) Atomic fractions of the Fe species at 4 K for Ca1−xSrxCu3Fe4O12 (x = 0, 0.2, 0.4, 0.6, 0.8, and 1). The data for x = 0 and 1 were taken from Refs. [Citation25,Citation26]. (b) Estimated average Fe valence at 4 K for Ca1−xSrxCu3Fe4O12 (x = 0, 0.2, 0.4, 0.6, 0.8, and 1).

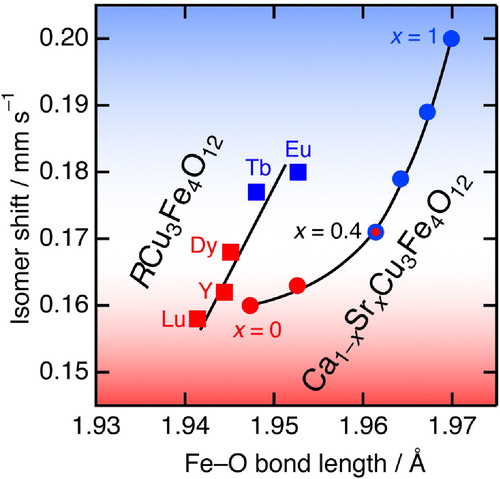
Fig. 10 IS versus Fe–O bond length for Ca1−xSrxCu3Fe4O12 (circles) and RCu3Fe4O12 (R = Eu, Tb, Dy, Y, Lu; squares) systems at RT. The data for Ca1−xSrxCu3Fe4O12 (x = 0, 1) and RCu3Fe4O12 were taken from Refs. [Citation25,Citation26]. The red and blue markers represent the compounds undergoing charge ordering transitions and Cu-to-Fe electron charge transfer transitions, respectively. The lines are guides to the eye.
2 Experimental
Precursors were prepared using the polymerized complex method [Citation20,Citation22]. Stoichiometric mixtures of CaCO3 (99.9%), SrCO3 (99.9%), Cu(NO3)2·3H2O (99.9%), and Fe(NO3)3·9H2O (99.9%) at molar ratios of (1−x):x:3:4 were dissolved in nitric acid, to which a five-fold excess of citric acid and a one-fold excess of 1,2-ethanediol were added while stirring. The resultant solutions were heated to 573 K, while stirring, and maintained at this temperature for 1 h to dry. Subsequently, the dried powders were fired in a furnace at 673 K for 1 h and 948 K for 12 h in air with occasional grindings. The afforded precursors with a nominal chemical composition of Ca1−xSrxCu3Fe4O12−δ (δ ∼ 2) were mixed with the oxidizing agent KClO4 (99.9%) in a molar ratio of 8:5. The mixtures were charged into Pt capsules. The capsules were placed into a (Mg, Co)O pressure medium and compressed to 20 GPa using a high-pressure apparatus. The sample was subsequently heated to 1473 K for 20 min, maintained at this temperature for 30 min, and quenched to room temperature (RT, ∼300 K). During the heat treatment, the pressure was maintained at 20 GPa; it was released slowly after the heat treatment. The afforded polycrystalline samples were washed several times with distilled water.
X-ray powder diffraction (XRD) measurements were performed at temperatures ranging between 100 and 450 K using a Rigaku Ultima IV diffractometer with a Cu Kα radiation. Synchrotron X-ray powder diffraction (SXRD) data were collected at temperatures ranging between 20 and 450 K using N2- and He-spray refrigerators installed at the BL02B2 beamline of SPring-8, Japan. Samples were contained in Lindemann glass capillary tubes (inner diameter of 0.2 mm), and the wavelength used was 0.42063 Å (determined by calicbation with a CeO2 standard). Structure parameters were refined by Rietveld analysis using the RIETAN-FP program [Citation23] and the crystal structures were drawn using the VESTA3 software [Citation24].
The 57Fe Mössbauer spectroscopy measurements for samples with x = 0.2, 0.4, 0.6, and 0.8 were performed in transmission geometry using 57Co/Rh as a radiation source and α-Fe as a control for the velocity calibration and IS. The collected Mössbauer spectra were fitted computationally using the Lorentzian function. Magnetization measurements were conducted using a superconducting quantum interference device (SQUID, Quantum Design MPMS-XL) at temperatures ranging between 5 and 300 K under external magnetic fields ranging between 0.1 and 50 kOe.
3 Results
3.1 Crystal structures
illustrates the observed SXRD patterns and Rietveld refinement results of Ca1−xSrxCu3Fe4O12 at 20 and 300 K (also see ). All SXRD patterns at 300 K could be indexed in the cubic quadruple AA’3B4O12-type perovskite structure (space group: Im, No. 204). The a-axis length at this temperature increased monotonically from 7.295 (x = 0) to 7.360 Å (x = 1) (). These observations confirm that the solid solutions of Ca1−xSrxCu3Fe4O12 at any composition could be successfully synthesized in this study. No significant amounts of oxygen deficiencies were confirmed in the Rietveld refinement results. Thus, we assumed that the nominal compositions were almost retained for any samples. (a) displays the temperature dependence of the a-axis length obtained from Rietveld refinement of the XRD (x = 0, 0.6, 0.8, 1) and SXRD (x = 0.2, 0.4) data. An abrupt drop was observed below ∼200 K for x = 0.2. This is attributed to the shrinkage (elongation) of the Fe–O (Cu–O) bonds due to Fe-to-Cu electron charge transfer, as has been reported for CaCu3Fe4O12 [Citation25]. The crystal structures of x = 0.2 sample below the phase transition temperature were refined with the charge-ordered structure model (space group: Pn
, No. 201), as well as x = 0 [Citation14]. Continuous NTEs in temperatures ranging between 180 and 280 K were observed in samples with x = 0.6 and 0.8, as well as in SrCu3Fe4O12. This behavior is induced by the Cu-to-Fe electron charge transfer [Citation26]. The structure refinement for x = 0.6 and 0.8 below phase transition temperatures were performed based on the charge-disordered structure model (space group: Im
, No. 204), as well as x = 1 [Citation26]. The x = 0.4 sample displayed coexistence of two phases with clearly different a-axis lengths below ∼200 K, as shown in (b). The peak broadenings induced by the local strains inhibit the phase transition [Citation27], remaining in the two-phase coexistence at 20 K.
Table 1 Refined structure parameters, selected bond lengths and angles for Ca1−xSrxCu3Fe4O12 at 300 and 20 K.
The metal–oxygen bond lengths/angles were calculated from Rietveld refinement results using the SXRD data at temperatures ranging between 20 and 450 K (see ). demonstrates the x dependence of the Cu–O and Fe–O bond lengths in Ca1−xSrxCu3Fe4O12. Reliable structure parameters (atomic positions) could not be obtained from the refinement for x = 0.4 at 20 K because of significant peak broadenings, thus only a-axis lengths were refined. The Cu–O bond lengths at 300 K were distributed across a small range (1.89–1.91 Å) for all compositions, implying that the Cu valence is almost identical at this temperature. We previously confirmed that the Cu valences of the CaCu3Fe4O12 and SrCu3Fe4O12 end-members at 300 K are almost identical (∼2.4) [Citation25,Citation26]. Thus, the Cu valence is held at the same level for all solid solutions. The Fe–O bond lengths at 300 K increased monotonically from 1.947 (x = 0) to 1.970 Å (x = 1). This does not signify that intrinsic changes in Fe valences are dependent upon x. The Fe–O bonds for Ca1−xSrxCu3Fe4O12 are flexibly expanded by structural distortions with larger A-site ions, as observed in RCu3Fe4O12 [Citation18]. Thus, we conclude that the adequate ionic model of all Ca1−xSrxCu3Fe4O12 phases at 300 K is retained as Ca2+1−xSr2+xCu∼2.4+3Fe∼3.7+4O12 [Citation25,Citation26].
displays the temperature dependence of the Cu–O/Fe–O bond lengths, and Fe–O–Fe bond angles for Ca1−xSrxCu3Fe4O12. For x = 0.2, the Cu–O bond length increased on cooling to temperatures below ∼200 K, and the Fe–O bonds were split into longer and shorter bonds. The former indicates that the Fe-to-Cu electron charge transfer occurs simultaneously with the charge disproportionation transition, resulting in Cu reduction. The latter is due to the charge ordering of the charge-disproportionated Fe3+ and Fe5+ ions, as has been reported for CaCu3Fe4O12 [Citation25]. For x = 0.6 and 0.8, the Cu–O bonds gradually shrank, but the Fe–O bonds gradually extended on cooling below 300 K. This behavior is identical to that of SrCu3Fe4O12, and is attributed to the electron charge transfer from Cu to Fe [Citation20,Citation26]. Similar to SrCu3Fe4O12, for x = 0.6 and 0.8, the Fe–O–Fe bond angles decreased on cooling. The volume expansions were partly compensated according to the following relationship: a = 4dFe–O × sin(ψ/2), where dFe–O and ψ represent the Fe–O bond length and Fe–O–Fe bond angle, respectively. However, the Fe–O bond elongations exceeded these values, resulting in substantial NTE when x = 0.6 and 0.8. The Cu–O and Fe–O bond lengths at 20 and 300 K are compared in . The Cu–O elongations/shrinkages, and Fe–O shrinkages/elongations are closely coupled when x is in the ranges of 0–0.2 and 0.6–1, respectively. This reasonably distinguishes two contrasting phase transitions; type-I: Fe-to-Cu electron charge transfer accompanied by charge ordering of charge-disproportionated Fe3+/Fe5+ ions like CaCu3Fe4O12 (x = 0–0.2), type-II: Cu-to-Fe electron charge transfer without charge ordering of charge-disproportionated Fe3+/Fe5+ ions like SrCu3Fe4O12 (x = 0.6–1).
3.2 Magnetic properties
Magnetic properties are closely related to the above-demonstrated structural transformations. (a) illustrates the temperature dependence of the magnetic susceptibility for Ca1−xSrxCu3Fe4O12. The type-I phases (x = 0, 0.2) exhibited ferromagnetic (ferrimagnetic) transitions simultaneously with charge-transfer/disproportionation/ordering transitions [Citation14]. The Curie temperature (TC) decreased from 210 K (x = 0) to 200 K (x = 0.2). This is derived from a decline in superexchange interactions on Fe–O–Fe due to the increase in the Fe5+ atomic fraction from 39% (x = 0) to 43% (x = 0.2), as indicated by Mössbauer spectroscopy in the next section. On the other hand, the type-II phases (x = 0.6, 0.8, 1) exhibited antiferromagnetic phase transitions at temperatures ranging between 180 and 190 K, simultaneously with charge disproportionation transition [Citation20,Citation26]. (b) illustrates the isothermal magnetization curves at 5 K for Ca1−xSrxCu3Fe4O12. Almost the same saturation magnetizations [∼10 μB per formula unit (f.u.)] were observed when x = 0 and 0.2. In contrast, linear dependences, attributed to antiferromagnetic properties, were observed when x = 0.6, 0.8, and 1. The x = 0.4 sample displayed intermediate behavior, with saturation magnetization of ∼3.5 μB per f.u., which was much smaller than those observed for x = 0–0.2. This was interpreted as the decrease in the ferromagnetic fraction (estimated at ∼30%) of charge-ordered phase in a two-phase coexistence state. A intense hump was observed below transition temperature for x = 0.6, like TbCu3Fe4O12 [Citation18]. The origin is probably related to the electronic transformation accompanying charge transfer, but the detail is not clear at this stage.
3.3 Mössbauer spectroscopy
The electronic state transitions for Ca1−xSrxCu3Fe4O12 were investigated by 57Fe Mössbauer spectroscopy. displays Mössbauer spectra for samples with x = 0.2, 0.4, 0.6, and 0.8 at low temperature (LT, 4–8 K), and RT (∼300 K). Singlet (B-site Fe, >90%) and doublet (A’-site Fe, <10%) paramagnetic components were predominantly observed at RT for all samples, as well as for CaCu3Fe4O12 and SrCu3Fe4O12 [Citation25,Citation26]. Small amounts of α-Fe2O3 impurity (∼5%) were excluded from the analysis. The Mössbauer hyperfine parameters are listed in . The IS of the paramagnetic singlet components increased monotonically from 0.16 (x = 0.2) to 0.19 mm s−1 (x = 0.8), all of which are included in the range between 0.16 mm s−1 (x = 0) and 0.20 mm s−1 (x = 1) [Citation25,Citation26]. This increase does not imply any intrinsic valence reductions in the Fe ions, but indicates changes in the Fe–O bonding character. In other words, the Fe–O covalency decreases monotonically with an increase in x. This is associated with the crystal structures. Thus, the elongation of the Fe–O bond from 1.947 (x = 0) to 1.970 Å (x = 1) accordingly decreases the overlap of Fe 3d–O 2p orbitals, resulting in less covalent (or more ionic) character of the Fe–O bonds. The LT Mössbuaer spectra of the two groups (x = 0.2 and x = 0.4–0.8) differed. In the former group, three magnetic sextet components attributed to the Fe5+, Fe3+(1), and Fe3+(2) were found. This is similar to the behavior observed in CaCu3Fe4O12 [Citation25]. The Fe5+ and Fe3+(1) components are derived from the charge ordering of the Fe5+ and Fe3+ ions in a rock-salt-type manner. On the other hand, the Fe3+(2) component is attributed to the randomly distributed Fe3+ ions at the B- and A’-sites [Citation25]. The slight increase in the Fe5+ abundance ratio from 39% (x = 0) to 43% (x = 0.2) indicates that the Fe-to-Cu electron charge transfer (Fe oxidation) is enhanced when x increases. Thus, the spectra of the x = 0.4–0.8 sample group were more complicated than that of x = 0.2 because of the apparent phase coexistence (x = 0.4) and/or charge disordering like SrCu3Fe4O12 [Citation26]. A clear difference in IS values between Fe3+ (0.4–0.45 mm s−1) and Fe5+ (0–0.1 mm s−1) species was adopted for the assignment of each component. The Fe3+(1) components for the samples with x = 0.4 and 0.6 were assigned to the Fe3+ ions in almost charge-ordered phases owing to hyperfine field values (∼430 kOe) that were similar to those of Fe3+(1) ions for the x = 0–0.2 sample group. In contrast, other Fe3+ components, Fe3+(2) and Fe3+(3) for the x = 0.4–0.8 sample group, were assigned to the Fe3+ ions in randomly distributed or charge-disordered phases, according to previous reports on La1−x(Ca/Sr)xFe(3+x)+O3 perovskites [Citation28,Citation29]. In these reports, two types of Fe3+ components with different hyperfine parameters in charge-disordered phases were distinguished. (a) displays the x dependence of the atomic fractions of the Fe3+ and Fe5+ species at LT. The increase in the Fe5+ fraction from x = 0 to 0.2 weakens the Fe–O–Fe superexchange interaction J (J is proportional of the product of spin quantum numbers) because of the smaller spin quantum number of Fe5+ (S = 3/2) when compared to that of Fe3+ (S = 5/3). This decreases the Curie temperatures gradually from ∼210 K (x = 0) to ∼200 K (x = 0.2), as shown in the magnetic susceptibility data. The Fe5+ fraction slightly decreases from x = 0.6 to 1, implying that the Cu-to-Fe charge transfer is enhanced by x in these compositions. This is consistent with the fact that the magnitude of NTE systematically increased from x = 0.6 to 1. (b) illustrates the calculated average Fe valences in the LT phases. The average Fe valence, initially increased from x = 0 to 0.2, suddenly decreased at the phase boundary (x = 0.4), and further decreased slightly from x = 0.4 to 1. This behavior indicates that the structural distortions induced by the A-site Ca/Sr ions dominate the Cu–Fe charge transfers ().
Table 2 Hyperfine parameters for Ca1−xSrxCu3Fe4O12 (x = 0.2, 0.4, 0.6, and 0.8) at RT and LT.
4 Discussion
We consider structural and electronic properties of Ca1−xSrxCu3Fe4O12 on the basis of SXRD, magnetic susceptibility, and Mössbauer spectroscopy data. displays the IS of B-site Fe as a function of Fe–O bond lengths at RT for Ca1−xSrxCu3Fe4O12 (x = 0, 0.2, 0.4, 0.6, 0.8, and 1), and RCu3Fe4O12 (R = Y, Eu, Tb, Dy, and Lu) [Citation17,Citation18,Citation25,Citation26]. This diagram demonstrates two common features for Ca1−xSrxCu3Fe4O12 and RCu3Fe4O12. The first is that the IS values increase monotonically when the Fe–O bonds are elongated. This indicates that the Fe–O bond covalency is weakened to increase IS values when the Fe–O bonds become longer because the overlapping of Fe 3d–O 2p orbitals decreases. The second is that the common phase boundary of the LT electronic phases for ACu3Fe4O12 is located at IS ∼0.17 mm s−1. In other words, all compounds with IS values >0.17 mm s−1 (x > 0.4 for Ca1−xSrxCu3Fe4O12 and R = Tb and Eu for RCu3Fe4O12, respectively) undergo Cu-to-Fe electron charge transfer transitions associated with volume expansions. In contrast, all compounds with IS values <0.17 mm s−1 (x < 0.4 for Ca1−xSrxCu3Fe4O12 and R = Y, Dy, and Lu for RCu3Fe4O12, respectively) go through charge disproportionation involving Fe3+/Fe5+ charge ordering. These results reveal that the Fe–O bond covalency is closely related to the types of electronic phase transitions. This tendency supports the previously proposed bond–strain-based phase diagram of the RCu3Fe4O12 system, where the forcedly elongated Fe–O bonds favor reduction to Fe3+ ions through intersite charge transfer (3Cu2+ + 4Fe3.75+ → 3Cu3+ + 4Fe3+) although unstrained or compressed Fe–O bonds prefer charge disproportionation transitions (8Fe3.75+ → 5Fe3+ + 3Fe5+) [Citation18]. The disagreement between Ca1−xSrxCu3Fe4O12 and RCu3Fe4O12 lines is probably attributed to the difference in A-site ion sizes. Larger alkaline-earth ions (Ca2+:1.12 Å and Sr2+:1.26 Å) at A-sites expand Fe–O bonds compared to smaller rare-earth metal ions (0.977–1.066 Å for Lu3+–Eu3+), resulting in the shift to right side (larger Fe–O) in .
5 Conclusions
We investigated the crystal structures and electronic transformations of the quadruple perovskite solid solutions Ca1−xSrxCu3Fe4O12. It has been found that the Fe–O bond lengths are closely related to their covalency which are estimated from Mössbauer isomer shift parameters for Ca1−xSrxCu3Fe4O12 and R3+Cu3Fe4O12. The electronic phase boundary dividing between charge-disproportionated phases involving Fe3+/Fe5+ charge ordering (x < 0.4 and R = Dy, Y, Lu) and others dominated by Cu-to-Fe electron charge transfer accompanying unit cell volume expansion (x > 0.4 and R = Eu, Tb) is commonly located at ∼0.17 mm s−1. These findings demonstrate that the covalency of metal–oxygen bonds is an essential factor in determining the electronic states of ACu3Fe4O12 perovskites
Acknowledgements
The synchrotron radiation experiments were performed at SPring-8 with the approval of JASRI (Proposal Nos. 2012A1619 and 2016A1229). This work was performed under the Visiting Researcher’s Program of Geodynamics Research Center, Ehime University. This work was supported by Grants-in-Aid for Scientific Research (B16H04220) from the Japan Society for the Promotion of Science, the Ministry of Education, Culture, Sports, and Science and Technology of Japan, and Toray Science Foundation.
References
- R.H.MitchellPerovskites: Modern and Ancient2002Almaz PressThunder Bay
- P.GrangerV.I.ParvulescuS.KaliaguineW.PrellierPerovskites and Related Mixed Oxides: Concepts and Applications2016Wiley-VCHWeinheim, Germany
- R.J.D.TilleyPerovskites: Structure-Property Relationships2016John Wiley & SonsNew York
- Z.ZengM.GreenblattM.A.SubramanianM.CroftPhys. Rev. Lett.82199931643167
- J.A.AlonsoJ.Sanchez-BenitezA.De AndresM.J.Martinez-LopeM.T.CasaisJ.L.MartinezAppl. Phys. Lett.83200326232625
- A.P.RamirezM.A.SubramanianM.GardelG.BlumbergD.LiT.VogtS.M.ShapiroSolid State Commun.1152000217220
- M.A.SubramanianD.LiN.DuanB.A.ReisnerA.W.SleightJ. Solid State Chem.1512000323325
- A.ProdiE.GilioliA.GauzziF.LicciM.MarezioF.BolzoniQ.HuangA.SantoroJ.W.LynnNat. Mater.320044852
- R.D.JohnsonL.C.ChaponD.D.KhalyavinP.ManuelP.G.RadaelliC.MartinPhys. Rev. Lett.1082012067201
- X.WangY.ChaiL.ZhouH.CaoC.-d.CruzJ.YangJ.DaiY.YinZ.YuanS.ZhangR.YuM.AzumaY.ShimakawaH.ZhangS.DongY.SunC.JinY.LongPhys. Rev. Lett.1152015087601
- J.H.ClarkM.S.DyerR.G.PalgraveC.P.IrelandJ.R.DarwentJ.B.ClaridgeM.J.RosseinskyJ. Am. Chem. Soc.133201110161032
- S.YagiI.YamadaH.TsukasakiA.SenoM.MurakamiH.FujiiH.ChenN.UmezawaH.AbeN.NishiyamaS.MoriNat. Commun.620158249
- I.YamadaH.FujiiA.TakamatsuH.IkenoK.WadaH.TsukasakiS.KawaguchiS.MoriS.YagiAdv. Mater.2920171603004
- I.YamadaK.TakataN.HayashiS.ShinoharaM.AzumaS.MoriS.MuranakaY.ShimakawaM.TakanoAngew. Chem. Int. Ed.47200870327035
- Y.W.LongN.HayashiT.SaitoM.AzumaS.MuranakaY.ShimakawaNature45820096063
- Y.W.LongT.SaitoT.TohyamaK.OkaM.AzumaY.ShimakawaInorg. Chem.48200984898492
- H.EtaniI.YamadaK.OhgushiN.HayashiY.KusanoM.MizumakiJ.KimN.TsujiR.TakahashiN.NishiyamaT.InoueT.IrifuneM.TakanoJ. Am. Chem. Soc.135201361006106
- I.YamadaH.EtaniK.TsuchidaS.MarukawaN.HayashiT.KawakamiM.MizumakiK.OhgushiY.KusanoJ.KimN.TsujiR.TakahashiN.NishiyamaT.InoueT.IrifuneM.TakanoInorg. Chem.5220131375113761
- I.YamadaH.EtaniM.MurakamiN.HayashiT.KawakamiM.MizumakiS.UedaH.AbeK.-D.LissA.J.StuderT.OzakiS.MoriR.TakahashiT.IrifuneInorg. Chem.5320141179411801
- I.YamadaK.TsuchidaK.OhgushiN.HayashiJ.KimN.TsujiR.TakahashiM.MatsushitaN.NishiyamaT.InoueT.IrifuneK.KatoM.TakataM.TakanoAngew. Chem. Int. Ed.50201165796582
- W.ChenY.W.LongT.SaitoJ.P.AttfieldY.ShimakawaJ. Mater. Chem.20201072827286
- M.KakihanaJ. Sol–Gel Sci. Technol.61996755
- F.IzumiK.MommaSolid State Phenom.13020071520
- K.MommaF.IzumiJ. Appl. Crystallogr.44201112721276
- I.YamadaM.MurakamiN.HayashiS.MoriInorg. Chem.55201617151719
- I.YamadaK.ShiroH.EtaniS.MarukawaN.HayashiM.MizumakiY.KusanoS.UedaH.AbeT.IrifuneInorg. Chem.5320141056310569
- S.W.ArulnesanP.KayserB.J.KennedyJ.A.KimptonK.S.KnightSolid State Sci.522016149153
- M.TakanoJ.KawachiN.NakanishiY.TakedaJ. Solid State Chem.3919817584
- S.KomornickiL.FournèsJ.C.GrenierF.MénilM.PouchardP.HagenmullerMater. Res. Bull.161981967973