
Abstract
SnS nanoflakes were synthesized by chemical route at a temperature of 80 °C. Stannous chloride and sodium sulphide was used as a source of Sn2+ and S2− ions respectively. The elemental stoichiometric analysis of SnS nanoflakes was done by employing energy dispersive analysis of X-rays (EDAX) technique. The structural study of the as-synthesized nanoflakes was studied by X-ray diffraction (XRD). The grain size was determined using X-ray diffraction (XRD) data employing Scherrer’s formula and Hall–Williamson plot. The residual strain produced in the synthesized nanoflakes during the synthesis was obtained from Hall–Williamson plot. The transmission electron microscopy (TEM) image showed that the synthesized nanoflakes have average crystallite size of 11 nm. The thermal decomposition of SnS nanoflakes was studied employing thermogravimetric (TG), differential thermogravimetric (DTG) and differential thermal analysis (DTA) techniques. The thermal behaviour of SnS nanoflakes was compared with SnS single crystals. The thermal parameters were evaluated of the SnS nanoflakes using two most common thermal analysis methods; Broido and Coats-Redfern (CR) relations. Thermal activation energy, enthalpy change (ΔH*), entropy change (ΔS*) and free energy change (ΔG*) related to the thermal decomposition process were calculated for the SnS nanoflakes. The obtained results are discussed in details.
1 Introduction
In the past few decades, tin sulfide (SnS) has gained much attention as a possible alternative absorber material for the next generation of solar cells to replace the current best developed technology based on CdTe and Cu(In,Ga)Se2 materials. Reason being it involves toxic cadmium and rare elements gallium, indium and tellurium. Whereas in case of SnS, the constituent elements Sn and S are of low toxicity, low cost and are in natural abundance. Also SnS has high optical absorption (α > 104 cm−1) above the direct absorption edge at 1.2–1.5 eV [Citation1,Citation2]. It belongs to IV–VI group compound semiconductor generally showing p-type conduction due to the small enthalpy of formation of tin vacancies, which generate shallow acceptors [Citation3]. SnS is very interesting for the photovoltaic conversion of solar energy into electrical energy, since its band gap is 1.2 eV is comparable to that of silicon. It is seen that SnS in nanoforms especially nanowires, nanorods, etc. have found potential applications in electronic and optoelectronic devices [Citation4,Citation5]. Reason being nanowires of other semiconductors like Si, Ge, GaN and InAs has exhibited high electron mobility in the axial direction due to quasi-ballistic transport of electrons. The field-effect-transistors based on these nanowires showed performance comparable to or even better than the reported for planar devices made from the same materials [Citation6 Citation2013;Citation9]. In same line to nanowires and nanorods, SnS in nanoflakes has found larger interest due to its potential characteristics [Citation10 Citation2013;Citation13]. In this present research paper, the authors report the synthesis of SnS nanoflakes by a simple chemical route method and study their thermal behaviour from ambient temperature to 1223 K.
2 Experimental details
SnS nanoflakes were synthesized by chemical route. The chemicals used for the synthesis of SnS nanoflakes were, stannous chloride dihydrate (SnCl2·2H2O; Assay 98%; Alfa Aesar, USA), sodium sulfide nonahydrate (Na2S·9H2O; Assay 97%; Chiti Chem Corporation, Vadodara, India), oxalic acid dihydrate (H2C2O4·2H2O; Assay 98%; Chiti Chem Corporation, Vadodara, India) and cetyltrimethyl ammonium bromide (CTAB); (C19H42BrN; Assay 98%; Chiti Chem Corporation, Vadodara, India). All the chemicals were of analytical grade and used without any purification.
In the typical SnS nanoflakes synthesis process, firstly 0.02 M H2C2O4·2H2O is added to 350 ml of 4.4 mM CTAB. Then 0.01 mM SnCl2·2H2O is added to the solution. Lastly, 0.01 mM Na2S·9H2O is added drop by drop into the solution. Here all the solutions were prepared in distilled water and mixing of the respective solutions were done under constant magnetic stirring. The ultimate solution was magnetically stirred for half an hour and the obtained final solution was held at 80 °C for 2 h. At last, the black suspension is filtered and washed several times in distilled water to remove impurities to get resulting nanoflakes yield. After multiple washes, they were dried in oven at 45 °C for 2 h.
In this synthesis mechanism, oxalic acid dihydrate worked as a reducing agent that formed stannous oxalate (SnC2O4) after reacting with the stannous chloride. The CTAB acted as a surfactant and Na2S as a source of S2− ion.
In this paper the thermocurves of as-synthesized SnS nanoflakes were recorded and compared with SnS single crystals thermocurves. The SnS single crystals were taken as-grown. They were grown by direct vapour transport (DVT) technique and comprehensively characterized. The single crystal growth parameters and characterization results are not discussed in this paper and have been reported elsewhere [Citation14].
2.1 Characterization
The EDAX analysis of the as-synthesized SnS nanoflakes were done by energy dispersive analysis of X-rays (EDAX) attached to XL 30 ESEM scanning electron microscope. The X-ray diffraction (XRD) pattern was recorded by a Philips Xpert MPD X-ray diffractometer using graphite monochromatized CuKα radiation (λ = 1.5405 Å). The scanning rate of 10° min−1 was applied to record the pattern in the 2θ range of 3°–90°. The transmission electron microscopy (TEM) analysis was carried out on Philips, Tecnai 20 microscope by operating at an acceleration voltage of 200 kV. The sample for TEM analysis was prepared by dispersing the nanoflakes in a solvent by sonication and then taking a drop of the solution on carbon coated copper grids. The solvent was allowed to evaporate under ambient condition. The excess solvent was removed by vacuum drying. The curves of thermogravimetric (TG), differential thermogravimetric (DTG) and differential thermal analysis (DTA) were recorded from ambient temperature to 1223 K at a heating rate of 5 °C/min in inert N2 atmosphere using Seiko SII-EXSTAR TG/DTA-7200. The same condition and instrument was employed for recording the thermocurves of as-grown SnS single crystals.
3 Results and discussion
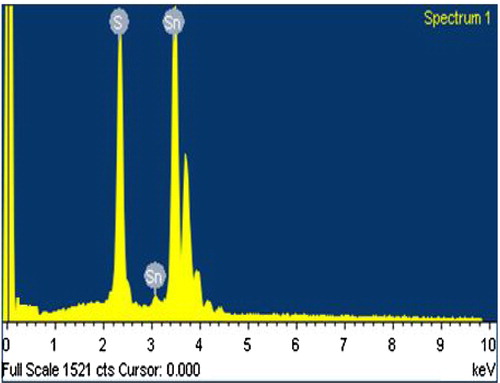
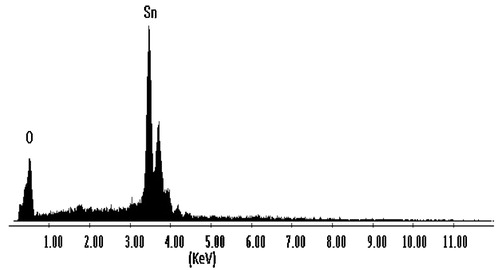
The stoichiometric composition and purity of the synthesized nanoflakes were determined by energy dispersive analysis of X-rays (EDAX) technique. The EDAX spectrum, , shows two elemental peaks of tin (Sn) and sulphur (S). The peaks next to the main Sn peak are also of tin element only, but they are from different energy shell. The obtained weight percentage from EDAX spectrum and the standard weight percentage of tin (Sn) and sulphur (S) elements are tabulated in for SnS nanoflakes. The weigh percentage data shows that the synthesized SnS nanoflakes are slightly rich in tin content. The EDAX spectrum also showed that the synthesized SnS nanoflakes are free of any other impurities and contaminants. The atomic percentage data of tin and sulphur are tabulated in .
Table 1 EDAX data of as-synthesized SnS nanoflakes.
Fig. 1 EDAX spectrum of SnS nanoflakes.
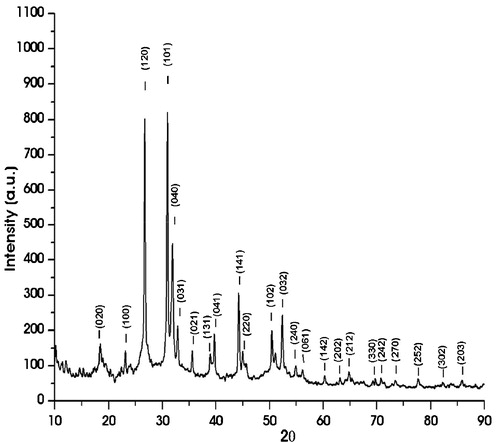
The XRD pattern of the as-synthesized SnS nanoflakes is shown in . All the diffraction peaks can be indexed as those of SnS possessing orthorhombic structure having lattice parameters as; a = 4.32 Å, b = 11.19 Å and c = 3.98 Å in good agreement with the standard data (JCPDS Card No. 39-0354). The XRD did not show any other phases like tin disulphide, tin oxide, etc.
Fig. 2 X-ray diffraction pattern of SnS nanoflakes.
The crystallite size was calculated using below Debye–Scherrer’s formula for different X-ray reflections [Citation2];(1) where K is the shape factor taken as 0.9 [Citation15], λ is the wavelength of X-ray (1.5405 Å), β is the angular line width at half maximum intensity and θ is the Bragg angle in degree. The average crystallite size estimated from the XRD analysis using Scherrer’s formula came out to be ∼13 nm.
The crystallite size and the micro strain in the as-synthesized SnS nanoflakes were estimated by Hall–Williamson relation [Citation2].(2)
The Hall–Williamson equation incorporates the Scherrer’s formula of crystallite size and the micro strain terms. Here β is full width at half maximum (FWHMs) of the diffraction peaks.
The plot of (β cos θ)/λ versus 4(sin θ)/λ for the as-synthesized SnS nanoflakes is shown in . In line to Eq. Equation(2)(2) , the plot is a straight line in which the reciprocal of intercept on (β cos θ)/λ axis gives the average crystallite size and the slope gives the residual strain. The crystallite size determined from the intercept comes out ∼17 nm. The residual strain obtained from the slope of the plot is 0.0023 for the as-synthesized SnS nanoflakes. The positive value of the residual strain for the SnS nanoflakes indicates it to be the tensile strain.
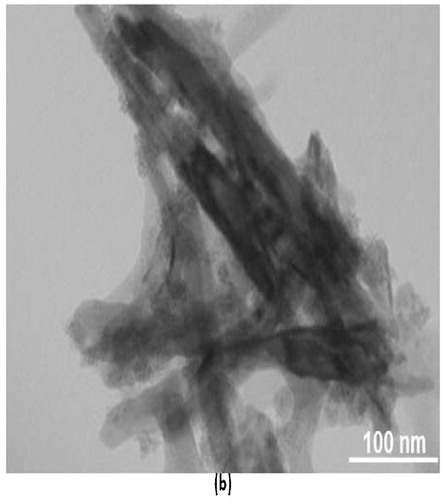
The morphology of the as-synthesized SnS nanoflakes was studied by transmission electron microscopy (TEM), . The TEM image clearly shows the synthesized SnS to be nanoflakes.
Fig. 3 Hall–Williamson plot for SnS nanoflakes.
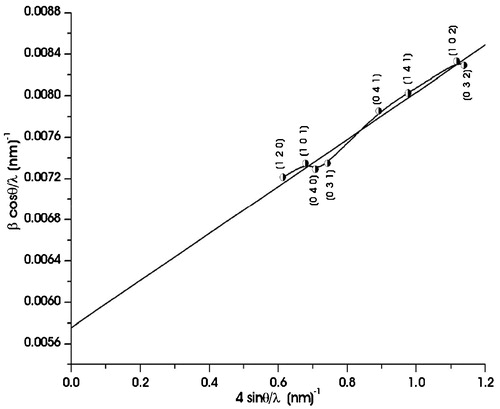
Fig. 4 The TEM image of SnS nanoflakes.
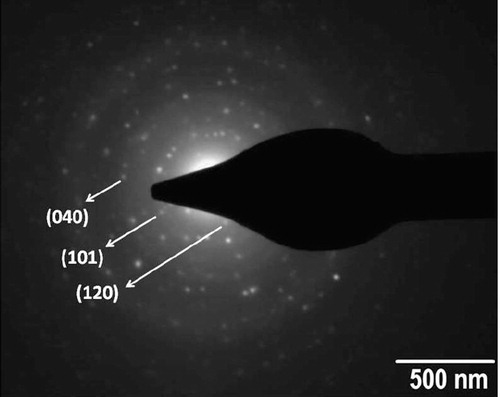
shows the selected area electron diffraction (SAED) image of the as-synthesized SnS nanoflakes. The image shows spot pattern forming the diffraction rings. The analysis of the image shows that the as-synthesized nanoflakes possess orthorhombic phase of SnS having reflections from (120) (101) and (040) planes. These are the prominent peaks also seen in the XRD pattern. The spot pattern in the SAED image indicates that the as-synthesized SnS nanoflakes have high crystalline nature.
Fig. 5 Selected area electron diffraction (SAED) pattern of SnS nanoflakes.
The TG curve of as-synthesized SnS nanoflakes is shown in . The simultaneously recorded DTG and DTA curves for SnS nanoflakes are shown in and , respectively. The initial weight of the nanoflakes taken in the thermal analysis was 10.41 mg.
The as-grown SnS single crystals TG, DTG and DTA curves are included along with the thermocurves of SnS nanoflakes, ;, for comparative study. The initial weight in case of SnS single crystals was 10.84 mg.
Fig. 6 Thermogravimetric curves of SnS nanoflakes and SnS single crystals in inert N2 atmosphere.
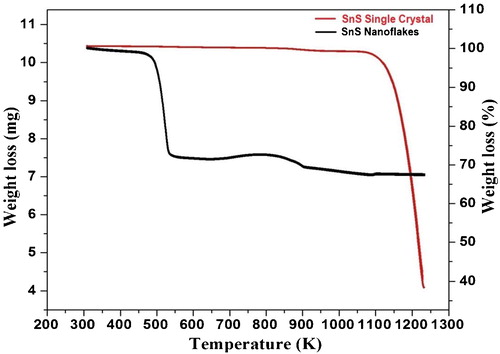
Fig. 7 DTG curves of SnS nanoflakes and SnS single crystals in inert N2 atmosphere.
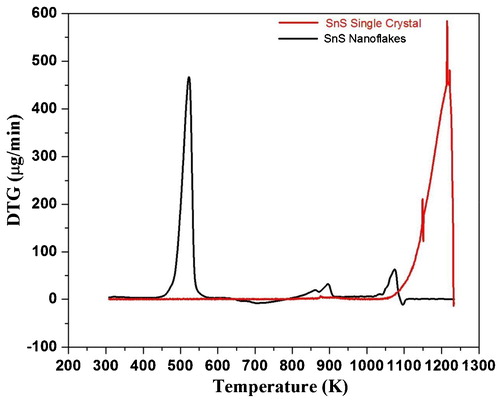
Fig. 8 DTA curves of SnS nanoflakes and SnS single crystals in inert N2 atmosphere.
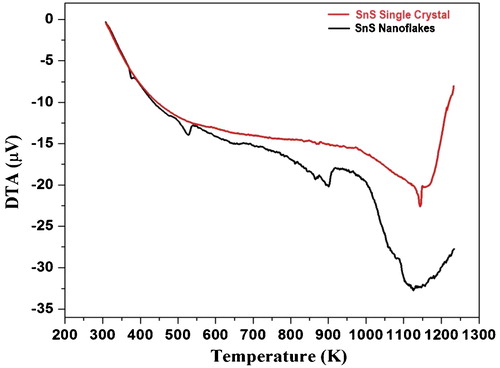
It is revealed from the TG curve, that the decomposition of SnS nanoflakes takes place in three steps. The temperature ranges corresponding to the three steps are; Step—I: 470–532 K, Step—II: 820 − 900 K and Step—III: 1020–1170 K. The three steps decomposition of as-synthesized SnS nanoflakes is supported by the three peaks observed in the DTG curve. Between ambient and 470 K temperatures, SnS nanoflakes are stable with very minor weight loss. The decomposition has maximum weight loss in Step—I. The DTA analysis show that the complete curve lies below the baseline all throughout the analyzed temperature stating it to be endothermic. The endothermic character states absorption of heat by the sample. This absorption of heat leads to thermal decomposition of SnS nanoflakes substantiated by the weight loss seen in TG curve. Thus the weight loss observed in TG is manifested by the endothermic nature of the simultaneously recorded DTA curve. The DTA shows an endothermic large dip at around the melting point of SnS (1153 K), after which the DTA curve shows increasing nature though it lies below baseline stating to be endothermic only.
Whereas in case of the SnS single crystals TG curve, , minor weight loss of 0.74 mg (12%) is observed between ambient to 1135 K and major weight loss of 5.41 mg (45.80%) in the temperature range of 1136 K to 1223 K. The DTG curve, , shows single peak. This single peak arises due to weight loss as seen in TG curve in the same temperature region. The corresponding DTA curve, , show endothermic behaviour, as the curve lies below baseline. The DTA curve for SnS single crystal shows continuous decrease up to nearly melting point of SnS (1153 K) followed by an increase. After increase also the curve lies below baseline stating to be endothermic in nature.
The comparison of thermocurves of SnS nanoflakes and single crystals clearly states that the nanoflakes are stable between ambient to 470 K, whereas single crystals are stable between ambient to 1135 K. This clearly states that SnS single crystals are more stable compared to SnS nanoflakes. Stability of SnS single crystals is nearly 665 K more than the SnS nanoflakes. The SnS nanoflakes decomposes by three steps while the single crystals has only single step decomposition. In both the cases the melting temperature remains nearly same at 1153 K.
The leftover residue of SnS nanoflakes after the thermal analysis was analyzed by EDAX technique. The EDAX spectrum of residual SnS nanoflakes is shown in . The EDAX analysis shows the presence of tin and oxygen elements that indicates that SnS becomes oxides of tin after thermal analysis up to 1223 K, though thermal analysis is done in inert N2 atmosphere. The atomic percentage data of tin and oxygen are tabulated in . The result states that SnS nanoflakes completely decompose around the melting point temperature of 1153 K leading to complete sulphur loss. The residual metal tin reacts with oxygen to forms tin oxide.
Table 2 Elemental analysis of SnS nanoflakes by EDAX after thermal analysis.
The thermal activation energy of the SnS nanoflakes was calculated by two standard thermal relations for the three decomposition steps [Citation16].
Fig. 9 EDAX spectrum of SnS nanoflakes after TG analysis.
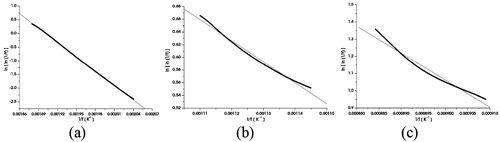
3.1 Broido relation [Citation17]
The Broido relation for a TG decomposition reaction is represented as;(3) where y is the fraction of the initial materials not yet decomposed.
The plot of ln[ln(1/y)] vs. 1/T of the Broido relation for three decomposition steps are shown in . The values of the thermal activation energy calculated from the slope of the straight-line plot for the decomposition is tabulated in .
Table 3 Thermal activation energy of SnS nanoflakes.
Fig. 10 Broido plots for thermal decomposition in (a) Step—I (b) Step—II and (c) Step—III of SnS nanoflakes.
3.2 Coats–Redfern (C–R) relation [Citation18]
The C–R relation for the thermal reaction,(4)
can be expressed in the form of the rate of the disappearance of A as;(5) where C(α) = (Wα − W)/W, Wα is the total mass loss in the reaction and W is the mass loss at the absolute temperature T.
Fig. 11 Plots of Coats–Redfern (C–R) relation for thermal decomposition in (a) Step—I, (b) Step—II and (c) Step—III of SnS nanoflakes.
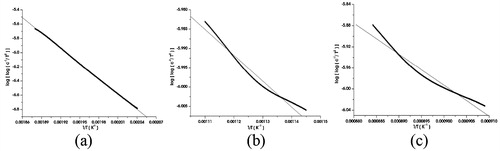
The plot of log[−log C(α)/T2] vs. 1/T of the C–R relation for three decomposition steps are shown in . From the slope of the straight-line plot for the decomposition, the determined values of activation energy are tabulated in .
The enthalpy change ΔH*, the entropy change ΔS*, and the free energy change (Gibbs function ΔG*) were calculated using the following equations [Citation19]:(6)
(7)
(8) where temperature T involved in the calculation is selected as the peak temperature from DTG, k and h are Boltzmann and Planck’s constants respectively. The calculated values of thermal parameters are tabulated in .
Table 4 Thermal parameters of SnS nanoflakes at the maximum differential conversion under the heating rate of 5 °C/min.
The activation energy values, , show that it is highest in the temperature range of Step—I for both the methods viz Broido and C–R. In that temperature range of Step—I, the enthalpy value, , is highest stating more heat being absorbed leading to more decomposition and more weight loss as observed in TG curve. The lowest value of activation energy is in Step—II for both the methods. The enthalpy value is also lowest in this temperature range. The lowest activation energy and enthalpy values are substantiated by the minimum weight loss observed in TG curve in Step—II temperature region. In Step—III, the activation energy values and enthalpy value is between the highest values seen in Step—I and lowest values observed in Step—II. The weight loss value of 2.4% in Step—III also lies between the weight loss of Step—I and II. This weight loss is very small compared to weight loss observed in Step—I, but the activation energy values and enthalpy value are not so small compared to Step—I. These large values of activation energy and enthalpy, but not showing weight loss may be due to melting of SnS nanoflakes at 1153 K corroborated by DTA dip.
4 Conclusions
The SnS nanoflakes have been successfully synthesized by simple chemical route at temperature of 80 °C. The energy dispersive analysis of X-rays (EDAX) confirmed that the as-synthesized SnS nanoflakes have near perfect stoichiometry. The X-ray diffraction (XRD) pattern of as-synthesized nanoflakes showed single phase of SnS possessing orthorhombic structure with good matching of lattice parameters to the standard data. The thermal analysis of SnS nanoflakes between room temperature and 1223 K by TG and DTA techniques showed that the decomposition takes place by three steps. The temperature ranges corresponding to the three steps are; Step—I: 470–532 K, Step—II: 870–900 K and Step—III: 1020–1170 K. Between room temperature and 470 K, the SnS nanoflakes are stable. In the three steps of decomposition, the TG shows sharp weight loss in Step—I. The comparison of SnS nanoflakes thermocurves with SnS single crystals showed that single crystal has single step decomposition and wider temperature stability compared to nanoflakes. The values of activation energy of SnS nanoflakes determined from the TG curve using Broido and Coats–Redfern relations for all the three steps showed that the activation energy values are in good agreement with each other. The continuous weight loss in TG is corroborated by the endothermic nature seen in DTA.
Acknowledgements
The authors are thankful to the BRNS-Department of Atomic Energy (DAE), Mumbai for providing financial assistance through DAE-BRNS Major Research Project Sanction No. 2010/34/34/BRNS/2060 dated 13th December 2010 for carrying out this research. All the authors are thankful to the Sophisticated Instrumentation Centre for Applied Research & Testing (SICART), Vallabh Vidyanagar, Gujarat, India for XRD and TEM analysis. The authors are also grateful to the Department of Metallurgical Engineering, Faculty of Engineering and Technology, M. S. University of Baroda, Vadodara, India for EDAX analysis of our samples.
References
- N.R.MathewsH.B.M.AnayaM.A.Cortes-JacomeC.Angeles-ChavezJ.A.Toledo-AntonioJ. Electrochem. Soc.15732010H337H341
- S.H.ChakiM.P.DeshpandeM.D.ChaudharyK.S.MahatoAdv. Sci. Eng. Med.5122013285290
- J.VidalS.LanyM.d’AvezacA.ZungerA.ZakutayevJ.FrancisJ.TateBand-Struct. Appl. Phys. Lett.10032012032104
- Y.LiJ.P.TuX.H.HuangH.M.WuY.F.YuanElectrochem. Commun.9120074953
- Y.LiJ.P.YuX.H.HuangH.M.WuY.F.YuanElectrochem. Acta523200613831389
- Y.LiF.QianJ.XiangC.M.LieberMater. Today91020061827
- Y.CuiZ.ZhongD.WangW.U.WangC.M.LieberNano Lett.322003149152
- J.P.ColingeC.W.LeeA.AfzalianN.D.AkhavanR.YanI.FerainP.RazaviB.O’NeillA.BlakeM.WhiteNat. Nanotechnol.532010225229
- W.LuC.L.M.LieberNat. Mater.6112007841850
- D.ChenG.ShenK.TangS.LeiH.ZhengY.QianJ. Crystal Growth2603–42004469474
- G.ShenD.ChenK.TangL.HuangY.QianG.ZhouInorg. Chem. Commun.622003178180
- Y.J.YangB.J.XiangAppl. Phys. A8332006461463
- C.R.PatraA.OdaniV.G.PolD.AurbachA.GedankenJ. Solid State Electrochem.1122007186194
- M.D.ChaudhuriPh.D. Thesis2015Sardar Patel University111124
- H.S.VirkNanowires—Implementations and Applications2011In TechChina
- S.H.ChakiFront. Mater. Sci. China232008322325
- A.BroidoJ. Polym. Sci.: Part A-2710196917611773
- A.W.CoatsJ.P.RedfernNature201491419646869
- S.H.ChakiM.D.ChaudharyM.P.DeshpandeJ. Therm. Anal. Calorim.1202201512611272