
Abstract
Monodispersed nanoparticles consisting of barium titanate (BaTiO3, BT) as the core and polyvinylpyrrolidone (PVP) as the shell were synthesized in a PVP-assisted low-temperature process in an aqueous solution at ambient pressure. In order to clarify the mechanism of this unique BT–PVP nanoparticle growth and the origin of the dispersion, the concentration and molecular weight of PVP used in the synthesis were varied, and the size and dispersion of the resulting nanoparticles in water were investigated by field-emission scanning electron microscopy and dynamic light scattering. Monodispersed nanoparticles with an average size of 130 nm were obtained by using an intermediate PVP concentration of 100 g/L and a PVP molecular weight of 10,000 g/mol. The thickness of the PVP shell was estimated by thermogravimetric analysis. For the highly dispersed BT–PVP, the thickness of PVP adsorbed on the BT surface was around 3–5 nm. Direct SEM observation of monodispersed BT–PVP in an aqueous solution using a unique sample holder was also demonstrated for the first time.
1 Introduction
Barium titanate (BT, BaTiO3) is a ferroelectric compound with a perovskite structure. It is an important ferroelectric ceramic material that is mainly used in multilayered ceramic capacitors, semiconductors, positive temperature coefficient (PTC) thermistors, and piezoelectric devices [Citation1 Citation2013;Citation6]. In recent years, the increasing trend for miniaturization in the electronics industry has created a strong demand for nanometer-sized BT particles with spherical shape, low sintering temperature accompanied by a high sintering density, and high dielectric constant accompanied by a low dissipation factor.
BT particles are commonly produced by either a high-temperature solid-state process [Citation7 Citation2013;Citation9] or a wet chemical process [Citation10,Citation11]. Compared to the solid-state process, the wet chemical process can produce BT particles with higher purity and smaller size at lower temperature. There are many approaches to the wet chemical process, such as sol–gel [Citation12], co-precipitation [Citation13], and hydrothermal [Citation14] techniques. In particular, low-temperature (below 100 °C) synthesis of BT in aqueous systems has attracted much attention because of its simplicity, cost effectiveness, and suitability for industrial-scale production. The low-temperature synthesis of BT can be carried out mainly by two methods: direct synthesis at atmospheric pressure, as reported by Wadda et al. [Citation15], and hydrothermal synthesis [Citation16]. To date, the minimum particle size of BT can be controlled to reach tens of nanometers.
Polyvinylpyrrolidone (PVP) is used extensively in the synthesis of nanoparticles as a stabilizer [Citation17], molding agent [Citation18], or reducing agent [Citation19]. It is an amphiphilic polymer that has an alkyl hydrophobic side group and a hydrophilic pyrrolidone group. It is easily soluble in water and many organic solvents because of the formation of hydrogen bonds between the carbonyl group (C=O) in PVP and the solvent.
Our group successfully synthesized BT via a PVP-assisted low-temperature process [Citation20], which is a simple method that can overcome the problems of particle size and aggregation in a single step. Recently, we investigated the effect of precursor concentration, reaction temperature and time, and KOH concentration on the particle size of BT. Our results indicated that the KOH concentration was a key factor that not only affected the particle size, but also the adhesion of PVP on the BT surface and the dispersion of BT in an aqueous solution. However, the investigation was inconclusive in terms of the role of PVP in the particle growth and the dispersion mechanism.
In this study, we investigated the effects of concentration and molecular weight of PVP on the growth of crystallites and particles of BT–PVP during its synthesis and the BT–PVP re-dispersion in an aqueous solution. The thickness of the PVP film adsorbed on the BT surface was estimated quantitatively, and the morphology of the adsorbed PVP was examined. Using a new type of sample holder for SEM measurements and the same method demonstrated by Izu et al. [Citation21], the dispersed particles of BT–PVP in an aqueous solution were directly observed for the first time.
2 Experimental method
2.1 Preparation of BaTiO3–PVP nanoparticles
Nanoparticles of BT–PVP were prepared according to previously reported procedures [Citation20]. The precursor concentration of TiCl4 and BaCl2 were 0.2 M, and the concentration of KOH was 1.8 M. The reaction temperature was 80 °C and the reaction duration was 1 h. In order to investigate the effect of PVP in this reaction solution, the concentration of PVP with molecular weight of 10,000 g/mol was varied from 0 to 450 g/L. The molecular weight of PVP was then varied from 2500 to 360,000 g/mol while the concentration was kept constant at 50 g/L. PVP is formed by polymerizing the N-vinylpyrrolidone (NVP) unit, and the molecular weight of each unit of NVP is 111 g/mol. The number of units of NVP in different molecular weights was calculated, and the length of each PVP was calculated using Eq. Equation(1)(1) [Citation22]:
(1) where Lmax is the length of the PVP polymer, n is the number of monomer units, and l is the length of an ethylene chain (0.154 nm). summarizes the reaction conditions in terms of the PVP concentration; summarizes the reaction conditions determined by the PVP molecular weight and PVP length.
Table 1 Reaction conditions and results of BT–PVP synthesis using solutions with different PVP concentrations. The molecular weight of PVP was 10,000 g/mol.
Table 2 Reaction conditions and results of BT–PVP synthesis using solutions containing PVP with different molecular weights. The concentration of PVP was 50 g/L.
2.2 Characterization
The phase and crystallinity of the prepared samples were investigated by X-ray diffraction (XRD; SmartLab, Rigaku, Japan). The morphology of the samples was observed by field-emission scanning electron microscopy (FE-SEM; JSM-700F, JEOL, Japan). Transmission electron microscope (TEM) images, high-resolution TEM (HRTEM) images, and the corresponding fast Fourier transform (FFT) patterns were obtained with a TEM (JEM-2100F, JEOL, Japan) operating at an accelerating voltage of 200 kV. Dynamic light scattering (DLS; FPAR-1000, Otsuka Electronics Co., Ltd.) was used for the evaluation of the nanoparticle size in a solvent to characterize the re-dispersion. The DLS measurements were repeated five times to estimate the re-dispersion in an aqueous suspension containing 1 wt% of dried BT–PVP nanoparticles. Thermogravimetry (TG; TG-DTA2010SA, Bruker AXS K.K., Japan) was carried out to evaluate the amount of in situ PVP coating on the surface of the as-prepared BT–PVP. The surface potential of the BT nanoparticles was analyzed by measuring the zeta potential (ELS-Z1/Z2, Ostuka Electronics Co., Ltd., Japan).
To directly observe the behavior of the BT–PVP nanoparticle suspension, a new type of sample holder—Trans-SEM—was used for the SEM measurements. The sample holder had a small chamber between two silicon nitride films, and the sample suspension was placed into this chamber. Following the procedures reported by Izu et al. [Citation21], a 3 μL sample of the aqueous suspension of 1 wt% BT was released dropwise into the chamber. The sample holder was then set in the FE-SEM for images to be scanned by a secondary electron detector.
The BT–PVP particles in our study were assumed to adopt a core–shell structure, where the core was made of BT, and the shell was made of PVP. The thickness of PVP adsorbed on the surface of BT was calculated using the following equations [Citation23]:(2)
(3) where WL is the amount of PVP adsorbed on the BT surface, calculated from TG data obtained between 200 and 700 °C; dc is the diameter of the BT core; ts is the thickness of the PVP shell; Dc is the density of BT (6.02 g/cm3); Ds is the density of PVP (1.66 g/cm3 [Citation24]); and dcs is the diameter of the BT–PVP core and shell.
3 Results and discussion
3.1 Effect of PVP concentration
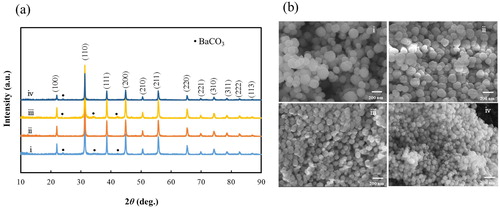
As discussed in previous reports, the morphology, size, orientation, and dispersion of nanoparticles could be controlled by in situ polymer-assisted particle growth [Citation21,Citation25]. In an earlier study, we investigated the effect of PVP content (60–200 g/L) on the particle size and the dispersion of the composite particles in water; our results showed that the size of the BT–PVP particles decreases with increasing PVP concentration [Citation20]. In this study, the precursor concentration was doubled, and the range in PVP concentration was expanded to 0–450 g/L. (a) shows the XRD patterns of BT–PVP prepared from solutions with different PVP concentrations. The good agreement of the patterns with data from the JCPDS card No. 01-79-2263 indicates that the BT–PVP particles were in the cubic phase. The figure shows no notable change in the peak positions of BT with variations in the PVP concentration. The crystallite size and lattice parameter of the BT–PVP samples were calculated using the XRD peak corresponding to the (110) plane and Scherrer’s equation, and the results are summarized in . The crystallite size decreased from 48.7 to 39.2 nm as the PVP concentration was increased from 0 to 300 g/L, and then increased to 50.7 nm when the PVP concentration exceeded 300 g/L. The lattice parameter of BT–PVP, which did not vary with PVP concentration, was 4.04 Å. A small amount of BaCO3 existed as impurities in the powder, as shown by the black dots in (a). The presence of these impurities can be avoided by releasing CO2 during synthesis. (b) shows FE-SEM images of these BT–PVP particles prepared from solutions with different PVP concentrations. The BT–PVP particles were spherical, and the particle size, measured by FE-SEM, decreased from 205 to 97 nm with increasing PVP concentration. These results indicate that the PVP concentration had no influence on the lattice parameter, but it affected the size of the crystallites and particles.
Fig. 1 (a) XRD patterns and (b) FE-SEM images of BT–PVP prepared at various PVP concentrations: (i) 0, (ii) 25, (iii) 100, and (iv) 450 g/L.
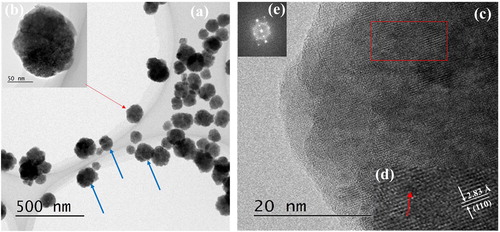
(a) shows TEM images of BT–PVP prepared from a solution with a PVP concentration of 100 g/L. Each particle consisted of several crystals separated by a grain boundary, as indicated by the blue arrows in the image. However, when the density of BT was high, the grain boundary could not be clearly observed. The distribution of the size of spherical particles was narrow and the dispersion was high. One of the particles, indicated by the red arrow, was selected for close inspection, and its magnified image is shown in (b). The size of a crystallite is about 30 nm although the boundary of crystallites could not be clearly observed of the particle. The particle size was about 131 nm, which is close to the average particle size of 130 nm measured by the FE-SEM. (c) shows an HRTEM image of the particle, and the lattice fringes indicate that the BT–PVP particle was crystalline. These fringes appear “spotty” in (c) and in the enlarged image ((d)) of a selected area of the particle (enclosed by the red rectangle in (c)), it can be clearly seen that the lattice fringes were discontinuous, indicating that the BT–PVP particle was polycrystalline. In (e), the corresponding FFT pattern of the area shows a ring representing the discrete diffraction spot, further proving that the BT–PVP particle was polycrystalline. It is well known that the phase of nanoparticle BT is cubic in room temperature for the size-dependent phenomena [Citation26] and low synthesis temperature [Citation27]. Our results were good agreement to their proposal.
Fig. 2 (a) TEM image of BT–PVP prepared in 100 g/L PVP reaction solution. (b) TEM image of the BT–PVP particle marked by the red arrow point in (a). (c) HRTEM image of a part of the particle shown in (b). (d) Enlarged HRTEM image and (e) corresponding fast Fourier transform (FFT) pattern of the area enclosed by the red rectangle in (c).
The effect of PVP concentration on the size of the particles and crystallites is shown in (a). The particle size decreased with increasing PVP concentration, which is in good agreement with the trend previously reported by Izu et al. [Citation23], while the crystallite size showed a slightly different trend. To understand the effect of PVP concentration on the growth of crystallites and particles, the average number of crystallites included in a particle was calculated from the volume of a single particle divided by the volume of a single crystallite. The particle and crystalline were regarded as spheres. (b) shows the relationship between the average number of crystallites in a single BT–PVP particle and the PVP concentration. The number decreased from 70 to 5 with increasing PVP concentration, indicating that the crystallite size became closer to the particle size with increasing PVP concentration. When the size of a crystallite and a particle are the same, the particle becomes a single crystal, but it was very difficult to synthesize single crystals of BT–PVP in our study because the process required a higher concentration of PVP that could not be completely dissolved in the reaction solution. Therefore, these results reveal that the composite particles of BT–PVP were formed by the aggregation of several nanocrystals.
Fig. 3 (a) Effect of PVP concentration on the size of particles measured by FE-SEM and the size of crystallites estimated from the XRD peak corresponding to reflection from the (110) plane. (b) Effect of PVP concentration on the average number of crystallites in an agglomerated particle of BT–PVP.

It has been reported that there is limited space between the polymer molecules in a polymer solution [Citation28]. Just as crystallites grew from the aggregates of the BT nuclei with high attractive force, the particles grew from the aggregates of crystallites with different orientations and relatively low attractive force. It is thought that as the polymer concentration increased, the space between the polymer molecules became narrower and the attractive force was blocked by the PVP network, thus restricting the growth of particles and crystallites. We believe that the attractive force of the crystallites was significantly blocked, and the particle growth stalled when the PVP concentration was above 300 g/L. As a result, crystallite growth became dominant and particle growth was inhibited in a solution when the PVP concentration was too high. At the same time, it was relatively easy for the nuclei to aggregate into crystallites in the narrowest space of the PVP network with high attractive force.
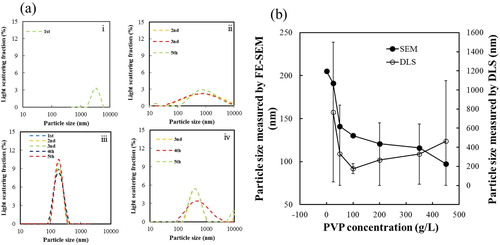
(a) shows DLS patterns of BT–PVP samples prepared with different concentrations of PVP. The highest degree of re-dispersion of BT–PVP with a narrow size distribution was observed for the sample with a PVP concentration of 100 g/L. The other samples showed wide size distributions, indicating aggregation of the BT–PVP nanoparticles. As shown in (b), the particle size, measured by SEM, decreased as the PVP concentration was increased. However, the DLS analysis shows that the particles initially became well dispersed with increasing PVP concentration, with the best dispersion at a PVP concentration of about 100 g/L. The particle dispersion then slightly deteriorated at higher PVP concentrations, and aggregation gradually occurred, indicating that there was an optimum amount of PVP for monodispersion of the BT–PVP particles.
Fig. 4 (a) DLS patterns of BT–PVP prepared at different concentrations of PVP: (i) 0, (ii) 25, (iii) 100, and (iv) 450 g/L. (b) Relationship between the particle size and PVP concentration. The particle size was measured FE-SEM and DLS respectively.
3.2 Effect of molecular weight of PVP
It has been reported that the particle size decreases with molecular weight of polymer. [Citation23] We have investigated to check whether the same role of PVP molecular weight appear in our study. The concentration of the PVP solution was fixed at a low value of 50 g/L, which also allowed PVP with Mw of 360,000 g/mol to be easily dissolved at room temperature. The effect of the molecular weight of PVP (Mw,PVP) on the size of BT–PVP crystallites and particles, as well as the particle re-dispersion, was also investigated.
The BT–PVP samples prepared with different values of Mw, PVP were first characterized by XRD. As shown in (a), they were all in the cubic crystal phase. The crystallite size and lattice parameter were also calculated using the peak corresponding to reflection from the (110) plane. The crystallite size (∼42 nm) and lattice parameter (4.04 Å) did not change as Mw, PVP increased, revealing that the molecular weight of PVP did not affect the crystallite growth or lattice parameter. The results are summarized in . (b) shows FE-SEM images of BT–PVP prepared from reaction solutions containing different PVP with different values of Mw. The BT–PVP particles were spherical, and the particle size remained at ∼140 nm with increasing Mw, PVP.
Fig. 5 (a) XRD patterns and (b) FE-SEM images of BT–PVP prepared from reaction solutions containing different molecular weight of PVP (i) 2500, (ii) 10,000, (iii) 130,000, and (iv) 360,000 g/mol.

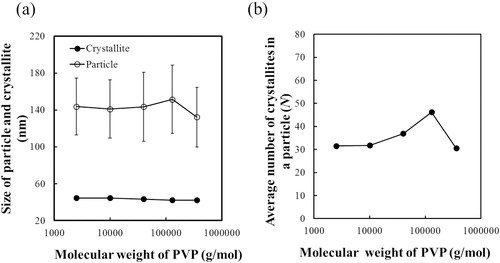
(a) shows the effect of PVP molecular weight on the size of particles measured by the FE-SEM and the size of crystallites estimated from the XRD peak corresponding to reflection from the (110) plane. The size of the particles and crystallites did not change with increasing Mw, PVP, and as shown in (b), the number of crystallites changed slightly from 30 to 50. Izu et al. [Citation29] proposal that the particle size reduce with Mw, PVP increasing, due to the viscosity of the reaction solution increasing. The discrepancy can be explained by the different reaction conditions used in the two studies: Izu et al. used the same concentration of PVP (but different molecular weights) for all samples, the concentration of PVP was 120 g/L, and reaction temperature was 190 °C. In our study, the concentration of PVP was low as 50 g/L because the PVP with Mw of 360,000 g/mol could be completely dissolved in the reaction solution at room temperature, and the reaction temperature was 80 °C. The concentration of PVP was very low in this study, which resulted in the very low viscosity of the reaction solution. Izu et al. [Citation29] think that the particle growth need force to migrate PVP in solution. The force increase with the Mw, PVP increasing, and results the particle size decreases. But the PVP concentration was very low and the space of PVPs became too large to restrict the growth particle and crystalline in our study. So under this condition, Mw, PVP was found to have no effect on the growth of the composite particles and crystallites.
Fig. 6 (a) Effect of PVP molecular weight on the size of particles measured by FE-SEM and the size of crystallites estimated from the XRD peak corresponding to reflection from the (110) plane. (b) Effect of PVP molecular weight on the average number of crystallites in an agglomerated particle of BT–PVP.
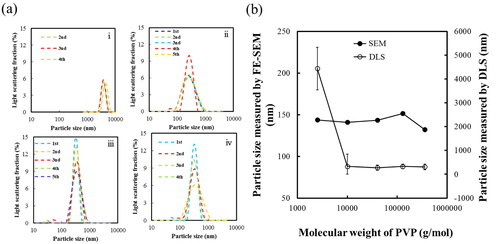
Next, the effect of Mw, PVP on the re-dispersion of BT–PVP was investigated by DLS using the aqueous suspension of 1 wt% BT–PVP. a shows DLS patterns of BT–PVP samples prepared from solutions containing PVP with Mw, PVP between 2500 and 360,000 g/mol. Based on these DLS results, the average particle size was determined to be 2500 nm, and the distribution was wide for the BT–PVP sample prepared from the solution containing PVP with Mw, PVP of 2500 g/mol. However, the average particle size of the other BT–PVP samples was 300 nm when they were prepared from solutions containing PVP with Mw, PVP of 10,000–360,000 g/mol. These results indicate that the aggregation was very strong among the BT–PVP nanoparticles prepared from PVP with Mw, PVP of 2500 g/mol, and high dispersion of the BT–PVP nanoparticles took place when they were prepared from PVP with Mw, PVP of 10,000 g/mol. The relationship between the particle size and PVP molecular weight is shown in (b). The BT–PVP particle sizes were almost the same for all samples when they were measured by SEM. However, the DLS measurements yielded a very large particle size for the BT–PVP sample prepared from PVP with Mw, PVP of 2500 g/mol. The DLS-based particle size dropped to ∼300 nm when Mw, PVP reached 10,000 g/mol and became constant as Mw, PVP was further increased. It was found that the coefficient of variation of the particle size decreased with increasing PVP Mw, which indicates that a minimum Mw, PVP was necessary to maintain high dispersion of the BT–PVP particles, and the high dispersion was remained unchanged when the Mw, PVP exceeds this minimum.
A PVP coating on a nanoparticle’s surface has been found to prevent nanoparticle aggregation [Citation25]. In order to clarify the dispersion mechanism of PVP, we compared the electrostatic stabilization phenomenon of BT prepared without PVP and BT–PVP samples prepared from solutions containing PVP with molecular weight of 2500 and 10,000 g/mol. The electrostatic stabilization can be estimated by measuring the zeta (ζ) potential, which is the charge at the particle surface of an electrical double layer. The value of the isoelectric point (IEP) is helpful in understanding the behavior of particles in a suspension. (a) shows the ζ potential of BT–PVP nanoparticles as a function of the pH value. The surface potential of BT prepared without PVP (BT only) decreased from +20 mV to −20 mV as the pH increased, and an IEP was observed near pH 9. Blanco-Lopez et al. [Citation30] reported that the true IEP of BT is around pH 6.5. However, the IEP of ceramic oxide has been reported to strongly depend on the source material and synthesis condition, with a variation range of ±2 in the pH value [Citation31,Citation32]. In our study, the particle size of BT prepared in an aqueous solution was about 200 nm, and the difference between the values of IEP in our work and the true value could have resulted from the differences in particle size and synthesis method. For the highly dispersed BT–PVP particles prepared from PVP with molecular weight of 10,000 g/mol (hereafter referred to as BT–PVP10000), the ζ potential of BT–PVP10000 in water was between −4 and −10 mV for a pH of 4–10. BT–PVP10000 exhibited excellent stability in a wide pH range and was less sensitive to charge variation in the solution as a function of pH because PVP could introduce steric repulsion to prevent aggregation of nanoparticles and realize monodispersion. On the other hand, the poorly dispersed BT particles prepared from PVP with a molecular weight of 2500 g/mol (hereafter referred to as BT–PVP2500) showed the same trend of ζ-potential dependence on pH as BT. However, their IEP shifted toward lower pH (around 7.5) than that of BT (around 9), possibly because the surface was covered by PVP when the IEP became lower, but the amount of PVP adsorbed on the BT was insufficient to prevent aggregation of the nanoparticles. The variation in the ζ potential as a function of the pH value suggests that PVP existed on the surface of the BT nanoparticles, and the short length of PVP could not prevent the aggregation of BT nanoparticles.
Fig. 7 (a) DLS patterns of BT–PVP prepared from solutions containing PVP with different molecular weight of PVP (i) 0, (ii)10,000, (iii)130,000, and (iv) 360,000 g/mol. (b) Relationship between particle size and molecular weight of PVP. The particle size was measured either by FE-SEM or DLS.
The dispersion of BT (without PVP) was compared with that of BT–PVP10000 in the DLS patterns shown in (a). The BT suspension could be measured only once because it aggregated immediately in water during the measurement. On the other hand, particle size of BT–PVP10000 was measured five times, and each set of measurements yielded a similar size distribution curve, indicating that the particles were well dispersed in the suspension. The average particle size of BT–PVP was 175 nm, which is similar to (although slightly larger than) the particle size of 130 nm estimated by SEM observations. This indicates that BT–PVP10000 consisted of isolated particles that were stabilized by PVP. In general, direct observation by SEM provides an easy way to characterize a sample; however, the need to prepare dry samples prior to SEM observation has limited its applicability in determining the dispersion of nanoparticles in water. Izu et al. [Citation21] reported the design and application of a new sample holder to directly observe wet samples with an SEM; it was used to directly observe the re-dispersion of ceria nanoparticles in water. In our study, the suspensions containing 1 wt% BT nanoparticles and 1 wt% BT–PVP10000 were prepared in water and transferred into the Trans-SEM holder. (b) and (c) shows SEM images of the BT–PVP and BT nanoparticle suspensions in the Trans-SEM holder. As the SEM scanned the transmitted secondary electrons, the BT–PVP nanoparticles appeared as spherical dark dots. In the image, the particles are separated one by one, and the bright space between the particles corresponds to the aqueous solution, as indicated by the yellow and green arrows. It should be noted that no overlap of particles is shown in the image of BT–PVP in (b), and we can assume that the particles were spread and dispersed as a single layer in the Trans-SEM holder. This monodispersion of BT–PVP realized by the PVP steric effect is supported by the zeta potential data shown in the previous section. Therefore, these images reveal that re-dispersion was successfully performed, and no agglomerated particles were formed in the suspension. In contrast, large dark BT particles with size of about 200 nm aggregated and overlapped each other, as shown in the image in (c). This indicates that the PVP-free BT nanoparticles existed in water as aggregates.
Fig. 8 (a) Relationship between pH and ζ-potential of three different types of nanoparticles: BT prepared without PVP; BT–PVP prepared from solution containing PVP with molecular weight of 2500 and 10,000 g/mol. FE-SEM images of an aqueous suspension containing 1 wt% nanoparticles of BT–PVP prepared with 10,000 g/mol PVP(b) and BT prepared without PVP(c).

Izu et al. [Citation29] have been clearly observed the 11–13 nm PVP shell of the nanoparticle CeO2-PVP with core–shell structure in TEM image. Although the PVP shell of BT–PVP was not clearly observed, there was no porous in the HRTEM image indicating that the BT have a dense structure in (c). The spherical BT–PVP particle is thus assumed to adopt a core–shell structure, with BT as the core and PVP as the shell. The thickness of PVP on the surface of BT was calculated as the method described in Section 2.2. The amount of PVP adsorbed on the surface was estimated by TG analysis from 200 to 700 °C, the range in which only PVP was consumed, and the average particle size was measured by the FE-SEM. (a) shows the effect of PVP concentration on the size of particles and cores and the shell thickness. The thickness of the PVP shell increased from 2.0 to 7.7 nm as the PVP concentration was increased from 25 to 450 g/L. Together with the DLS data, these results indicate that the thickness of PVP must be 3–5 nm to maintain high dispersion of BT–PVP in the aqueous solution. The length of the polymer was calculated from Eq. Equation(1)(1) to be about 12 nm for the PVP with molecular weight of 10,000 g/mol. The shell thickness of the highest dispersion BT–PVP prepared in 100 g/L PVP concentration was just 2.8 nm, indicating that the dried PVP adsorbed on the surface was very thin. The thin shell of PVP could not be observed clearly in c. However, the small amount of PVP molecules in this thin layer allowed them to easily disperse in the aqueous solution, and the BT–PVP reached high dispersion through the PVP steric effect. At the same time, the results also demonstrate that the size of the particles and cores decreased with increasing thickness of the PVP shell. In other words, the particle growth was constrained by the thin layer of PVP that was adsorbed on the BT surface.
Fig. 9 (a) Effect of PVP concentration on the size of particles and cores and the shell thickness. (b) Effect of PVP molecular weight on the size of particles and cores and the shell thickness.
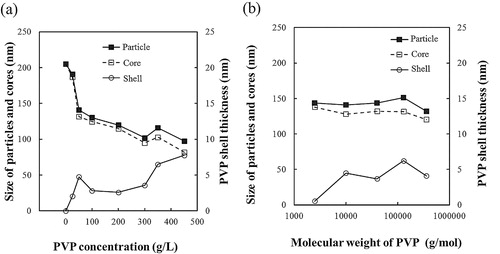
(b) shows the effect of PVP molecular weight on the size of particles and cores and the shell thickness. The results of particles size, shell thickness of the samples, the molecular weight and the length of PVP, are summarized in .
The shell thickness and particle size are less dependent on the molecular weight of PVP. It is considered that the viscosity of the reaction solution in this study is controlled to be constant for the various Mw PVP, the effect of the Mw PVP becomes inconspicuous. In the case of previous study of Izu et al. [Citation23], the PVP concentration was 2.4 times higher, the content of PVP was not reduced for higher molecular weight PVP and, as a result, highly viscous solution was used. In this study, however, the content of PVP is controlled to prepare sparse PVP networking, and the role of PVP inhibiting the BT–PVP particle growth seem reduced. It is considered that the viscosity control in this study reveals the variation of the dispersion clearly, but makes the effect of molecular weight rather insensitive. For the case of PVP of 2500 g/mol, an exception, the length of PVP is too short to form enough network on the BT surface.
The thickness of the PVP shell was around 5 nm as the PVP molecular weight increased from 10,000 to 360,000 g/mol. Therefore, the high dispersion could be maintained for the thin PVP layer. It also can be seen that the PVP length was much higher than the BT–PVP shell thickness. It maybe that PVP was adsorbed on the BT surface, with many loops that PVP fold itself to form the thin PVP shell as Mw, PVP increased. Moreover, the size of the particles and cores did not change with Mw, PVP, indicating that the particle growth was not effected by Mw, PVP in our study.
3.3 Proposed mechanisms of BT–PVP growth and dispersion
The mechanism of BT formation is explained by dissolution–precipitation in our previous study [Citation20]. Based on the above results and discussions, the growth of crystallites and particles and the dispersion mechanism of BT–PVP prepared from reaction solutions with different PVP concentrations and PVP molecular weights are illustrated in .
Fig. 10 Schematic illustration of the growth of crystallites and particles and the dispersion mechanism of BT–PVP prepared from solutions containing PVP with different concentrations and molecular weights.
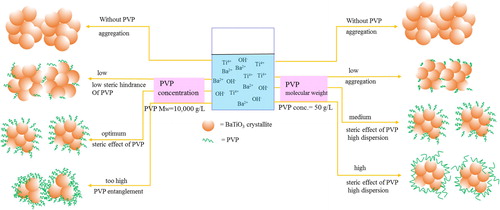
First, the particles and crystallites of BT prepared without PVP were the largest, because there was no obstruction from PVP in the reaction. The crystallites with different orientations aggregated and grew into one polycrystal particle; the size distribution of the particles was wide. The particles aggregated via the attractive force of surface nanoparticles and precipitated immediately in an aqueous solution.
In order to prevent aggregation of the particles, PVP was added as a dispersant. The growth of particles and crystallites was constrained even when the PVP concentration was low. Therefore, the BT–PVP crystallites and particles became smaller than the BT particles prepared without PVP, but the amount of PVP adsorbed on the surface BT was limited by the low PVP concentration, and the particles were able to aggregate via the attractive force between bare surfaces of the nanoparticles. As the PVP concentration was increased, the amount of PVP adsorbed on the BT surface increased until the entire surface was completely covered with a PVP shell. Since the steric effect of PVP is larger than the attractive force of the nanoparticle surface, the BT–PVP particles were monodispersed in an aqueous solution.
As the PVP concentration was further increased, the space between the PVP chains became narrower. The particle growth was strongly inhibited in the confined space, and crystallite growth became dominant because the attractive forces of particle growth were different from those of crystallite growth, as discussed in Section 3.1. Consequently, the crystallite size of BT–PVP was the same as the crystallite size of BT prepared without PVP () because the PVP concentration was too high during synthesis. At the same time, the PVP shell became thicker, and the cross-linking of PVP induced the aggregation of BT–PVP particles.
The effect of the molecular weight of PVP on the particle size and dispersion of BT–PVP is also illustrated in . The molecular weight of PVP did not have much effect on the growth of particles and crystallites. At the low molecular weight of 2500 g/mol, for example, it is thought that the PVP molecules were either lying or standing on the surface of the BT particle because the PVP shell was very thin (0.54 nm). As there were insufficient entanglements among the PVP molecules, the van der Waals attractive force among the particles became dominant, resulting in aggregation of the particles. When the PVP molecular weight had an intermediate value of 10,000 g/mol, for example, the PVP molecules spread out on the BT surface, giving rise to the steric effect, which resulted in high dispersion. As the molecular weight increased, PVP formed many loops adsorbed on the BT surface. At a high Mw, PVP of 360,000 g/mol, for example, the dispersion was maintained by the PVP steric effect, and PVP molecules that were adsorbed on the BT surface folded back onto itself to form loops-tail structures.
4 Conclusions
We studied the role of PVP in the particle growth and dispersion of BT–PVP nanoparticles. It was found that the concentration of PVP is a very important factor. PVP is not only a dispersant, but also an inhibitor of the particle and crystallite growth. Monodispersed nanoparticles of the average size 130 nm could be obtained with an intermediate PVP concentration and molecular weight of 100 g/L and 10,000 g/mol, respectively. The Mw, PVP does not affect the growth of particle and crystalline of BT–PVP in low concentration PVP.
The monodispersion of BT–PVP in an aqueous solution was also directly observed by FE-SEM for the first time using an Trans-SEM holder, which is a powerful tool for direct observations. The monodispersion of BT–PVP nanoparticles in an aqueous solution was realized by the steric effect of PVP, and the zeta potential of BT–PVP varied with pH within narrow range of −15 to −5 mV. Using PVP with different molecular weights and in different concentrations, we compared the length and thickness of PVP adsorbed on the BT surface and it was found that the thickness of the PVP shell should be at least 3–5 nm to achieve mono-dispersion of BT–PVP: when the PVP shell was thinner the BT–PVP nanoparticle aggregated; beyond this thickness, the BT–PVP nanoparticle aggregated with entanglement of the excess PVP.
References
- A.D.HiltonR.FrostKey Eng. Mater.14519926667
- L.E.CrossAm. Ceram. Soc. Bull.631984586590
- D.PandeyA.P.SinghV.S.TiwariBull. Mater. Sci.151992391402
- G.ArltD.HenningsG.de WithJ. Appl. Phys.58198516191625
- X.DengX.WangH.WenL.ChenL.LiAppl. Phys. Lett.882006252905
- Y.HeThermochim. Acta4192004135141
- M.BoulosS.Guillement-FritschF.MathieuB.DurandT.LebeyV.BleySolid State Ion.176200513011309
- H.S.PotdarS.B.DeshpandeS.K.DateMater. Chem. Phys.581999121127
- L.Simon-SeveyratA.HajjajiY.EmzianeB.GuiffardD.GuyomarCeram. Int.3320073540
- W.-S.ChoE.HamadaJ. Alloys Compd.2661998118122
- B.LiX.WangL.LiMater. Chem. Phys.782003292298
- M.H.FreyD.A.PayneChem. Mater.71995123129
- A.V.PrasadaraoM.SureshS.KomarneniMater. Lett.391999359363
- A.N.ChristensenActa Chem. Scand.24197024472452
- S.WadaT.TsurumiH.ChikamoriT.NomaT.SuzukiJ. Cryst. Growth2292001433439
- I.MacLarenC.B.PontonJ. Eur. Ceram. Soc.20200012671275
- R.SiY.-W.ZhangL.-P.YouC.-H.YanJ. Phys. Chem.B110200659946000
- X.WuY.ZhaoC.YangG.HeJ. Mater. Sci.50201542504257
- Y.XiongI.WashioJ.ChenH.CaiZ.-Y.LiY.XiaLangmuir22200685638570
- C.HaiK.InukaiY.TakahashiN.IzuT.AkamasuT.ItohMater. Res. Bull.572014103109
- N.IzuT.OguraT.AkamatsuT.ItohW.ShinCeram. Int.4020141636116364
- Y.D.LiC.W.LiH.R.WangL.Q.LiY.T.QianMater. Chem. Phys.5919998890
- N.IzuT.UchidaI.MatsubaraT.ItohW.ShinM.NishiboriMater. Res. Bull.46201111681176
- B.D.VogtCl.SolesH.J.LeeE.K.LinW.WuPolymer46200516351642
- Y.SunB.MayerT.HerricksY.XiaNano Lett.32003955960
- K.UchinoE.SadanagaT.HiroseJ. Am. Ceram. Soc.72198915551558
- S.WadaA.NozawaM.OhnoH.KakemotoT.TsurumiY.KameshimaY.OhbaJ. Mater. Sci.44200951615166
- T.AshidaK.MiuraT.NomotoS.YagiH.SumidaG.KutlukK.SodaH.NamatameM.TaniguchiSurf. Sci.601200738983901
- NoriyaIzuIchiroMatsubaraToshioItohWoosuckShinMaikoNishiboriBull. Chem. Soc. Jpn.812008761766
- M.C.Blanco-LopezB.RandF.L.RileyJ. Eur. Ceram. Soc.202000107118
- G.ParksChem. Rev.651965177198
- J.S.ReedPrinciples of Ceramic Processing2nd ed.1995John Wiley and Sons Inc.New York152