Abstract
The efficiency of animal bone meal as a low cost adsorbent for removing a cationic dye Basic Red 12 from aqueous solution has been investigated. The effects of various experimental factors; adsorbent dose, contact time, dye concentration, pH and temperature were studied by using the batch technique. A maximum of 83.56% removal of the dye was observed by 50 mg of Animal Bone Meal (ABM). Dye adsorption equilibrium was rapidly attained after 60 min of contact time. The isotherms of adsorption data were analyzed by Langmuir and Freundlich adsorption isotherm models. The adsorption capacity, Qm, obtained from the Langmuir isotherm plots were 64.13, 64.95, 66.73 and 67.87 mg/g respectively at 303, 313, 323 and 333 K. The characteristic results; dimensionless separation factor, RL, and the adsorption intensity, n, showed that animal bone meal can be employed as an alternative to commercial adsorbents in the removal of Basic Red 12 from aqueous solution.
1 Introduction
Pollution from chemicals products is a real threat to the aquatic environment, air, and soil. Several investigations were conducted and tireless efforts were made to fight against pollution in general. In this context, we have contributed to this research field especially the water pollution by textile dyes. In this fact, the discharge of colored wastewater from industry into natural stream causes many significant problems such as increasing the toxicity (Pearce et al., Citation2003; Ravi et al., Citation2005) and chemical oxygen demand of effluent as well as reducing light penetration (Yasemin and Haluk, Citation2006). It is recognized that public perception of water quality is greatly influenced by the color. Color is the first contaminant to be recognized in wastewater (Banat et al., Citation1996). The presence of very small amounts of dyes in water less than one ppm for some dyes is highly visible and undesirable (Banat et al., Citation1996; Robinson et al., Citation2001).
Several treatment processes are in practice for the removal of dyes from wastewater. These processes include; solar photo-Fenton degradation, photo catalytic degradation, photo-Fenton processes, biodegradation, integrated chemical–biological degradation, electrochemical degradation, coagulation and flocculation, oxidation and ozonation, membrane separation, sonochemical degradation and adsorption.
Among treatment technologies, adsorption is rapidly gaining prominence. Activated carbon is the most widely used adsorbent for dye removal, but it is too expensive (Malik, Citation2003), consequently, numerous low-cost alternative adsorbents have been proposed including: chemically modified sugarcane bagasse lignin (Da Silva et al., Citation2011), Pistachio hull waste (Moussavi and Khosravi, Citation2011), Coffee husk-based activated carbon (Ahmad and Rahman, Citation2011), Pine cone (Mahmoodi et al., Citation2011), Rice husk (Safa and Bhatti, Citation2011), Synthetic calcium phosphates (Boujaady et al., Citation2011), Natural untreated clay (Errais et al., Citation2011), Pillared clays (Gil et al., Citation2011), Swelling clays (Li et al., Citation2011).
This work describes the feasibility of removal of a cationic dye – Basic Red 12 – from aqueous solutions by using animal bone meal as a new low cost adsorbent. Batch adsorption experiments were achieved out as a function of adsorbent dosage, contact time, initial concentration of dye, pH and temperature. The thermodynamic parameters were also evaluated from the adsorption measurements. The Langmuir and Freundlich isotherms models, kinetics adsorption are also studied.
2 Materials and methods
2.1 Adsorbate
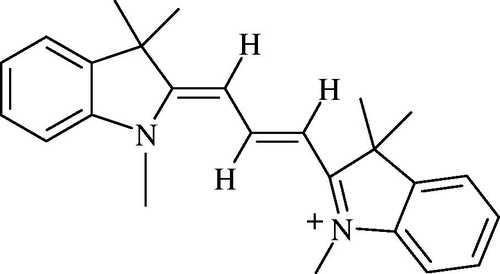
Basic Red 12 (BR12) was the cationic dye used in this study, supplied by SDI textile company (Safi, Morocco) and was used without any purification. The chemical structure of BR12 is given in . Colored solutions were prepared by dissolving required quantity of BR12 in distilled water. The final volume prepared was 500 mL. Adsorption studies for the evaluation of ABM adsorbent for the removal of BR12 dye from aqueous solutions were carried out in triplicate to get concordant results using a batch contact adsorption method.
Figure 1 Chemical structure of Basic Red 12.
2.2 Preparation of adsorbent
Animal bones were collected from nearby butcher shops. All of the attached meat and fat were removed and cleaned from the bones. The bones were then washed several times with tap water and left in open air for several days to get rid of odors. Later, they were transferred to the oven at 80 °C for drying. The dried bones were crushed and milled into different particle sizes in the range 45–200 μm then calcined for 2 h at 800 °C. The residue was washed with water and was used after drying for 24 h at 80 °C. The residue was washed with water and was dried overnight at 100 °C in a conventional drying oven, and then calcined at a heating rate of 2 °C/min to 400 °C and kept at this temperature for 4 h. The calcined material was ground to a fine powder in an electrical grinder. This was then passed through a mesh screen to get particles <500 μm size. This was stored in air tight container for further use.
2.3 Determination of pH zero charge point
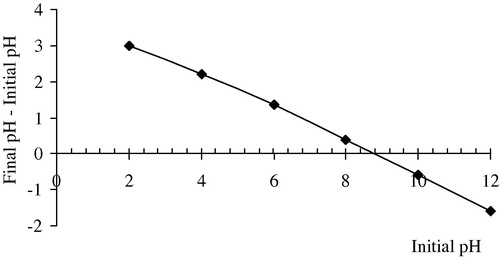
The zero point charge pH (pHZPC) of the ABM adsorbent was measured using the pH drift method (Calvete et al., Citation2009). In this fact, the pHZPC of the adsorbent was determined by adding 20 mL of 5 × 10⁻² mol/L NaCl to several 50 mL cylindrical high-density polystyrene flasks (height 117 mm and diameter 30 mm). A range of initial pH (pHi) values of the NaCl solutions were adjusted from 2 to 12 by adding 10−1 mol/L of HCl and NaOH. The total volume of the solution in each flask was brought to exactly 30 mL by further addition of 5 × 10⁻² mol/L NaCL solution. The pHi values of the solutions were then accurately noted and 50 mg of each adsorbent were added to each flask, which was securely capped immediately. The suspensions were shaken in a shaker at 298 K and allowed to equilibrate for two days. The suspensions were then centrifuged at 3600 rpm for 15 min and the final pH (pHf) values of the supernatant liquid were recorded. The value of pHZPC is the point where the curve of ∇pH (pHf–pHi) versus pHi crosses the line equal to zero. Measured pH was down by pH-Metre Basic 20+ model pH-meter.
2.4 Experimental procedure
The ABM adsorbent was characterized using elemental analysis, FTIR and XRD. FTIR spectra were obtained using ATI Mattson Genesis series FTIR™ UNICAM instrument. XRD of ABM adsorbent was carried out by using X pert Pro X-ray diffractometer using copper anticathode λ(Cu) = 1.5418 Å.
The surface area of ABM was determined by BET method and the calculated surface area was 85 m2/g. The concentration of BR12 before and after adsorption was determined using UV–Visible spectrophotometer (Biomate 6, England) at λmax = 469 nm.
Preliminary experiments demonstrated that the equilibrium was established at 60 min. A 50 mg sample of ABM was mixed with 50 mL dye solution of appropriate concentration (20, 40, 60, 80 and 100 mg/L). Samples of 10 mL of mixture were withdrawn from the batch at predetermined time intervals and the supernatant was centrifuged for 15 min at 3600 rpm. All dye solutions prepared were filtered by Millipore membrane type 0.45 μm HA. An incubator shaker was used for carrying out experiments at 303, 313, 323 and 333 K.
The amount of adsorption at time t, Qt (mg/g) was calculated using the following formula:(1) where Ct (mg/L) is the liquid concentration of dye at any time, C0 (mg/L) is the initial concentration of the dye in solution, V is the volume of the solution (L) and W is the mass of dye adsorbent (g).
The amount of equilibrium adsorption Qe (mg/g) was calculated using the formula:(2) where C0 and Ce (mg/L) are the liquid concentrations of dye initially and at equilibrium.
The dye removal percentage can be calculated as follows:(3) where C0 and Ce (mg/L) are the initial and equilibrium concentrations of dye in solution.
3 Results and discussion
3.1 Characterization of ABM adsorbent
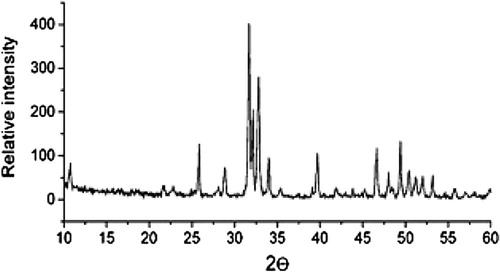
Elemental analysis of ABM shows a high yield of Ca (49.62%) and P (42.36%) with a (Ca/P) ratio equal to 1.17. Small amounts of Si (3.88%), Mg (1.32%), Na (0.77%), Al (0.35%), Fe (0.24%), Cl (0.24%), S (0.11%), K (0.07%), Sr (0.03%), Cu (0,03%) and Zn (0.02%) are found. shows the FTIR spectra of ABM adsorbent. FTIR spectra was carried out by encapsulating 0.5 mg of finely powder with 400 mg of KBr to get translucent disk. Carbonate is the most abundant substitution in bone mineral and according to its crystal position, carbonate apatite is designated as type A (OH−) or type B (), the latter being the most frequent bone (Best et al., Citation2008; Landi et al., Citation2003). It is recognized that hydroxyapatite derived from natural bone (Tadic and Epple, Citation2004; Figueiredo et al., Citation2009). FTIR spectrum of ABM given in shows the characteristic bands of hydroxyapatite (571, 603, 962 (shoulder), 1047 and 1091 (shoulder) cm−1 due to phosphate vibrations and collagen (CO stretching vibration at 1635 cm−1, N–H in plane bending at 1458 cm−1, C–H and N–H stretching modes in 3000–3571 cm−1 region) (Mkukuma et al., Citation2004; Paschalis et al., Citation1997; Rehman and Bonfield, Citation1997). Additionally, the typical bands of carbonate substituting for phosphate site (type B) in the apatite lattice are also observed: band at 874 cm−1 and double bands 1385/1445 cm−1 (Murugan et al., Citation2006; Haberko et al., Citation2006). depicts the XRD spectrum of ABM adsorbent. The diffractogram of calcined ABM shows only the characteristic pattern of hydroxyapatite. These results confirm that the amorphous organic component was removed after calcination as found in the literature (Figueiredo et al., Citation2010). For 2θ between 25° and 45°, the main lattice reflections originate peaks at 25, 28.1, 32.8, 33.7, 34.5 and 39.7° being respectively assigned to the (0 0 2), (1 0 2), (2 1 0), (2 1 1), (1 1 2) and (3 0 0) Miller plans of hydroxyapatite (Figueiredo et al., Citation2010).
Figure 2 IR spectra of ABM.
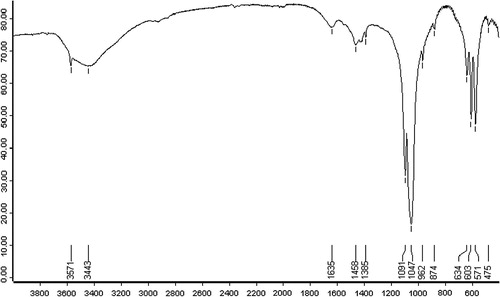
Figure 3 X-ray diffraction of ABM.
3.2 Effect of adsorbent amount
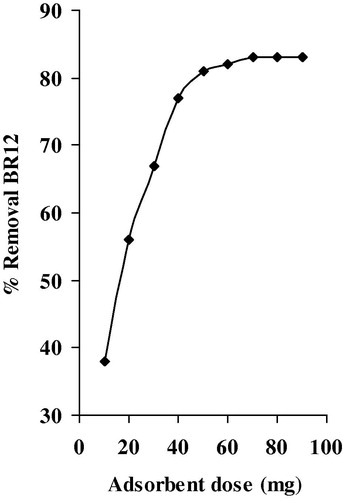
To evaluate the effect of adsorbent dose on the adsorption of BR12, we have carried out equilibrium experiments by contacting different amounts of ABM from the range of (10–90 mg) with 50 mL of a solution dye at 60 mg/L as initial concentration at 30 °C. The agitation was made for 24 h. depicts the variation of percentage of removal BR12 versus adsorbent dose. The percentage of removal BR12 was increased with increasing adsorbent dose. A maximum of 83.56% removal of the dye was observed by 50 mg of ABM.
Figure 4 Effect of adsorbent dose on the adsorption of BR12: [BR12] = 60 mg/L; contact time = 24 h.
3.3 Effect of contact time and DR12 dye concentration
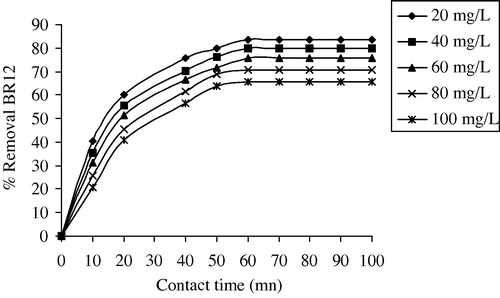
In order to achieve the effect of contact time and initial BR12 concentration (20–100 mg/L) with 50 mg of ABM on the percentage of removal BR12 by ABM, different experiments were realized. depicts these results. It was observed that the removal of BR12 is increased with increasing the contact time at all initial BR12 dye concentrations. Furthermore, the % removal dye is increased with the decrease in initial dye concentration. It is because of the fact at lower concentration, the ratio of the initial number of dye molecules to the available surface area is low subsequently the fractional adsorption becomes independent of initial concentration. However, at high concentration the available sites of adsorption becomes fewer and hence the percentage removal of dye depends upon concentration. For the first 30 min, the adsorption uptake was rapid then it proceeds at a slower adsorption rate and finally it attains saturation at 60 min. The obtained removal curves were single, smooth and continuous, indicating monolayer coverage of dye on the surface of adsorbent (Al-Rashed and Al-Gaid, Citation2012).
Figure 5 Effect of contact time and dye concentration adsorbent dose: W = 50 mg and V = 50 mL.
3.4 Effect of pH
One of the most important factors in adsorption studies is the effect of acidity on the medium (Calvete et al., Citation2010). Different species may present divergent ranges of suitable pH depending on which adsorbent is used. The effect of initial pH on the adsorption capacity of BR12 dye using ABM adsorbent was evaluated within pH range between 2 and 12. The mean of the duplicated experimental results is plotted in , indicating that pH considerably affected BR12 adsorption, particulary under acidic conditions. As can be seen in , percentage removal of BR12 onto ABM increased from 24.67% to 83.23% when the solution pH was increased from 2 to 12. The reason that ABM behaved differently in adsorbing BR12 at different solution pHs can be explained by considering the pHZPC as shown in of the adsorbent as well as molecular nature of BR12 (cationic dye). The pHZPC of ABM particles is 8.4, meaning that the adsorbent’s surface was positively charged at solution pH below 8.4. This causes competition between protons and BR12 formed cations for adsorption locations as well as the repulsion of cationic BR12 molecules, resulting in the reduction of dye adsorption. The lower the pH goes below pHZPC, the greater the density of positive ions on the surface of ABM will be which in turn allows for less adsorption. This is confirmed by low BR12 removal at a strong acidic pH of 2. When solution pH increases above pHZPC, a negative charge is present on the surface of ABM, causing better BR12 cations adsorption through the electrostatic attraction phenomenon. The maximum of BR12 adsorption onto ABM was achieved above pH 9.1.
Figure 6 Effect of pH on removal of BR12 onto ABM. Initial dye concentration 60 mg/L. Adsorbent dose 50 mg, volume solution 50 mL, agitation time 24 h, temperature 25 °C.
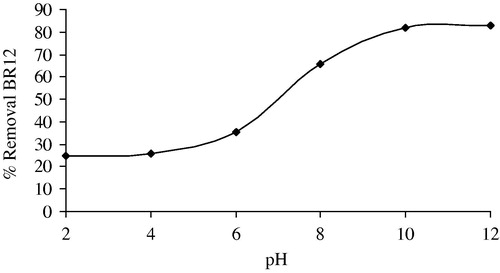
Figure 7 Determination of zero point charge pH.
3.5 Adsorption isotherms and thermodynamic studies
The equilibrium existence of dye between the liquid phase and the solid phase is well described by adsorption isotherms. Experimental isotherm data collected at different temperatures 303, 313, 323 and 333 K fit in Langmuir and Freundlich adsorption isotherm models and thermodynamic parameters calculated accordingly. For the equilibrium concentration of adsorbate Ce and amount of dye adsorbed at equilibrium Qe, the following linear forms of Langmuir (Langmuir, Citation1916) and Freundlich (Butt and Graf, Citation2003) isotherms were studied.(4)
(5) where Ce is the equilibrium concentration of dye in solution (mg/L), Qe is the amount of dye adsorbed per unit weight of adsorbent at equilibrium (mg/g), Qm is the monolayer adsorption capacity (mg/g) and b is related with the energy of the adsorption (L/mg). A plot of log Qe versus log Ce enables to determine the constant Kf and the adsorption intensity n. Kf represents the quantity of dye adsorbed onto adsorbent for an equilibrium concentration. When (1/n > 1), the change in adsorbed concentration is greater than the change in the solute concentration. The Freundlich model is suitable for use with heterogeneous surface but can describe the adsorption data over a restricted range only. It is often found that when the Freundlich equation is fitted to data at higher and intermediate concentrations, since the Freundlich equation does not approach Henry’s Law of ideal dilute solutions. The Langmuir and Freundlich isotherm models gave straight lines, intercepts and slopes were used to determine the values of Langmuir and Freundlich parameters as given in .
Table 1 Statistical parameters/constants of Langmuir and Freundlich isotherms results.
lists the maximum adsorption capacity Qm values for BR12 adsorption onto ABM at different temperatures. From the results, it is clear that the value of adsorption efficiency Qm and adsorption energy b of the ABM increase when increasing the temperature. From the values it is concluded that the maximum adsorption corresponds to a saturated monolayer of adsorbate molecules on adsorbent surface with constant energy and no transmission of adsorbate occurs in the plane of the adsorbent surface. The observed b value shows that the adsorbent prefers to bind acidic ions and that speciation predominates on adsorbent characteristics, when ion exchange as the predominant mechanism takes place in the adsorption of BR12, it confirms the endothermic nature process involved in the system. The Freundlich constant, Kf, increases with increase in temperature. The value of n is greater than 1 indicating the adsorption of BR12 onto ABM is favorable.
Thermodynamic parameters such as change in free energy ∇G0 (kJ/mol), enthalpy ∇H0 (kJ/mol) and entropy ∇S0 (kJ/K mol) were determined using the following equations:(6)
(7)
(8) where K0 is the equilibrium constant, Csolid is the solid phase concentration at equilibrium (mg/L), Cliquid is the liquid phase concentration at equilibrium (mg/L), T is the temperature expressed in Kelvin and R is the gas constant.
The ∇H0 and ∇S0 values obtained from the slope and intercept of Van’t Hoff plots are presented in . The values of ∇H0 are within the range of 1–93 kJ/mol indicating the physisorption. From these results it is clear that physisorption is much more favorable for the adsorption of BR12. The positive values of ∇H0 show the endothermic nature of adsorption and it governs the possibility of physical adsorption (Cestari et al., Citation2008; Mall et al., Citation2006; Altınısık et al., Citation2010). Since in case of physical adsorption, while increasing the temperature of the system, the extent of BR12 adsorption increases, this rules out the possibility of chemiosorption (Khattri and Singh, Citation2009; Mohan et al., Citation2002). The low value of ∇H0 suggests that the BR12 is physisorbed onto ABM adsorbent. The negative values of ∇G0 () shows that the adsorption is highly favorable and spontaneous. The positive values of ∇S0 () shows the increased disorder and randomness at the solid solution interface of BR12 with ABM adsorbent that brings about some structural changes in the BR12 and the ABM. The enhancement of adsorption capacity of the ABM at higher temperatures was attributed to the enlargement of pore size and activation of the adsorbent surface (Arami et al., Citation2008; Garg et al., Citation2003).
Table 2 Equilibrium constant and thermodynamic parameters for the adsorption of BR12 onto ABM adsorbent.
The essential characteristics of the Langmuir isotherm can be expressed in terms of dimensionless constant separation factor RL given by Boujaady et al. (Citation2011), Deniz and Karaman (Citation2011)":(9) where b is the Langmuir constant and C0 is the highest initial dye concentration (mg/L). RL values indicate the type of Langmuir isotherm and to be (Boujaady et al., Citation2011; Deniz and Karaman, Citation2011): Irreversible (RL = 0), Favorable (0 < RL < 1), Linear (RL = 1) and Unfavorable (RL > 1). The RL values depicted in range between 0.120 and 0.484 for the range of temperatures studied indicate that the adsorption of BR12 onto ABM adsorbent is favorable.
Table 3 Dimensionless separation factor RL.
4 Conclusion
The results indicated that ABM is a promising new low cost adsorbent for the removal of BR12 from aqueous solutions. The equilibrium data have been analyzed. The results showed that the BR12 followed Langmuir and Freundlich isotherm models. Thermodynamic studies indicated that the dye adsorption onto ABM was a spontaneous, endothermic and physical reaction in nature.
Related Research Data
References
- M.A.AhmadN.K.RahmanEquilibrium, kinetics and thermodynamic of remazol brillant orange 3R dye adsorption on coffee husk-based activated carbonChemical Engineering Journal1702011154161
- S.M.Al-RashedA.A.Al-GaidKinetic and thermodynamic studies on the adsorption behavior of Rhodamine B dye on Duolite C-20 resinJournal of Saudi Chemical Society162012209215
- A.AltınısıkE.GürY.SekiA natural sorbent, Luffa cylindrica for the removal of a model basic dyeJournal of Hazardous Materials1792010658664
- M.AramiN.Y.LimaeeN.M.MahmoodiEvaluation of the adsorption kinetics and equilibrium for the potential removal of acid dyes using a biosorbentChemical Engineering Journal1392008210
- I.M.BanatP.NigamD.SinghR.MarchantMicrobial decolorization of textile dye containing effluents: a reviewBioresources Technology581996217227
- S.M.BestA.E.PorterE.S.ThianJ.HuangBioceramics: past, present and for the futureJournal European Ceramic Society28200813191327
- H.El BoujaadyA.El RhilassiM.B.ZiatniR.El HamriA.TaitaiJ.L.LacoutRemoval of a textile dye by adsorption on synthetic calcium phosphatesDesalination27520111016
- H.J.ButtK.GrafPhysics and chemistry of interfaces2003Wiley-VCHWeinheim
- T.CalveteE.C.LimaN.F.CardosoS.L.P.DiasF.A.PavanApplications of carbon adsorbents prepared from the Brazilian-pine fruit shell for removal of Procion Red MX 3B from aquoeus solution: kinetic, equilibrium and thermodynamic studiesChemical Engineering Journal1552009627636
- T.CalveteE.C.LimaN.F.CardosoJ.C.P.VaghettiS.L.P.DiasF.A.PavanApplication of carbon adsorbents prepared from the Brazilian-pine fruit shell for removal of reactive orange 16 from aquoeus solution – kinetic, equilibrium, and thermodynamic studiesChemical Engineering Journal91201016951706
- A.R.CestariE.F.S.VieiraA.M.G.TavaresR.E.BrunsThe removal of the indigo carmine dye from aqueous solutions using cross-linked chitosan-evaluation of adsorption thermodynamics using a full factorial designJournal of Hazardous Materials1532008566574
- L.G.Da SilvaR.RuggieroP.M.GontijoR.B.PintoB.RoyerE.C.LimaT.H.M.FernandesT.CalveteAdsorption of brillant red 2BE dye from water solutions by chemically modified sugarcane bagasse ligninChemical Engineering Journal1682011620628
- F.DenizS.KaramanRemoval of Basic Red 46 dye from aqueous solution by pine tree leavesChemical Engineering Journal17020116774
- E.ErraisJ.DuplayF.DarragiI.M’RabetA.AubertF.HuberG.MorvanEfficient anionic dye adsorption on natural untreated clay : Kinetic study and thermodynamic parametersDesalination27520117481
- M.FigueiredoJ.HenriquesG.MartinsF.GuerraF.JudasH.FigueiredoPhysicochemical characterization of biomaterials commonly used in dentistry as bone substitutes-comparison with human boneJournal Biomedical Materials Research92B2009409419
- M.FigueiredoA.FernandoG.MartinsJ.FreitasF.JudasH.FigueiredoEffect of the calcination temperature on the composition and microstructure of hydroxyapatite derived from human and animal boneCeramics International36201023832393
- V.K.GargR.GuptaA.B.YadavR.KumarDye removal from aqueous solution by adsorption on treated sawdustBioresource Technology892003121124
- A.GilF.C.C.AssisS.AlbenizS.A.KoriliRemoval of dyes from wastewaters by adsorption on pillared claysChemical Engineering Journal168201110321040
- K.HaberkoM.M.BuckoJ.Brzezin ´ska-MiecznikM.HaberkoW.MozgawaT.PanzA.PydaJ.ZarebskiNatural hydroxyapatite-its behaviour during heat treatmentJournal European Ceramic Society262006537542
- S.D.KhattriM.K.SinghRemoval of malachite green from dye wastewater using neem sawdust by adsorptionJournal of Hazardous Materials167200910891094
- E.LandiG.CelottiG.LogroscinoA.TampieriCarbonated hydroxy-apatite as bone substituteJournal European Ceramic Society23200329312937
- I.LangmuirThe constitution and fundamental properties of solids and liquidsJournal of the American Chemical Society38191622212295
- Z.LiP.H.ChangeW.T.JiangJ.S.JeanH.HongMechanism of methylene blue removal from water by swelling calysChemical Engineering Journal168201111931200
- N.M.MahmoodiB.HayatiM.AramiC.LanAdsorption of textile dyes on pine cone from colored wastewater: kinetic, equilibrium and thermodynamic studiesDesalination2682011117125
- P.K.MalikUse of activated carbons prepared from sawdust and rice-husk for adsorption of acid dyes: a case study of acid yellow 36Dyes and Pigments562003239249
- I.D.MallV.C.SrivastavaN.K.AgarwalRemoval of Orange-G and Methyl Violet dyes by adsorption onto bagasse fly ash: kinetic study and equilibrium isotherm analysesDyes and Pigments692006210223
- L.D.MkukumaJ.M.S.SkakleI.R.GibsonC.T.ImrieR.M.AspdenD.W.L.HukinsEffect of the proportion of organic material in bone on thermal decomposition of bone mineral: an investigation of a variety of bones from different species using thermogravimetric analysis coupled to mass spectrometry, high-temperature X-ray diffraction, and Fourier transform infrared spectroscopyCalcified Tissue International752004321328
- S.V.MohanN.C.RaoJ.KarthikeyanAdsorptive removal of direct azo dye from aqueous phase onto coal based sorbents: a kinetic and mechanistic studyJournal of Hazardous MaterialsB902002189204
- G.MoussaviR.KhosraviThe removal of cationic dyes from aquoeus solutions by adsorption onto pistachio hull wasteChemical Engineering Research and Design89201121822189
- R.MuruganS.RamakrishnaK.P.RaoNanoporous hydroxy-carbonate apatite scaffold made of natural boneMater. Lett.60200628442847
- E.P.PaschalisF.BettsE.DiCarloR.MendelsohnA.L.BoskeyFTIR microspectroscopic analysis of normal human cortical and trabecular boneCalcified Tissue International611997480486
- C.I.PearceJ.R.LloydJ.T.GuthrieThe removal of colour from textiles wastewater using whole bacterial cells: a reviewDyes Pigments582003179196
- K.RaviB.DeebikaK.BaluDecolourization of aquoeus dye solutions by a novel adsorbent: application of statistical designs and surface plots for the optimization and regression analysisJournal Hazardous MaterialsB12220057583
- I.RehmanW.BonfieldCharacterization of hydroxyapatite and carbonated apatite by photo acoustic FTIR spectroscopyJ. Mater. Sci.: Mater. Med.8199714
- T.RobinsonG.McMullanR.MarchantP.NigamRemediation of dyes in textile effluent : a critical review on current treatment technologies with a proposed alternativeBioressources Technology772001247255
- Y.SafaH.N.BhattiKinetic and thermodynamic modeling for the removal of direct red 31 and direct red 26 dyes from aquoeus solutions by rice huskDesalination2722011313322
- D.TadicM.EppleA thorough physicochemical characterisation of 14 calcium phosphate-based bone substitution materials in comparison to natural boneBiomaterials252004987994
- B.YaseminA.HalukA kinetics and thermodynamics study of methylene blue adsorption on wheat shellsDesalination1942006259267