Abstract
We compare two simulations of ion outflows, one in the polar wind and the other in the auroral region by using Barghouthi model. The model includes the effects of ion heating due to wave–particle interactions (altitude and velocity dependent), gravity, polarization electric field, and diverging geomagnetic field lines. The ion velocity distributions, ion density, ion drift velocity, ion parallel and perpendicular temperatures are computed at different altitudes in the simulation tube that extended from 1.7 RE to 10 RE in the polar wind region and from 1.2 RE to 10 RE in the auroral region. The auroral zone and polar wind outflows differ in the model only through boundary conditions and wave activities, the latter expressed in terms of velocity diffusion coefficients, D⊥(r, v⊥). The comparison between the simulation results for ion outflows in both regions produces the followings: (1) the effect of wave–particle interactions is more significant in the auroral region than it is in the polar wind region; (2) the role of wave–particle interactions in energizing O+ ions is more effective than it is for H+ ions; (3) finite wavelength effects leading to the formation of toroid distributions are more common for O+ ions in both regions; (4) the O+ ion potential energy due to gravity and polarization electric field is always positive and acts as a barrier and blocks the ions from moving upward in both regions. We conclude our comparison of the model results for the two different regions with a brief discussion of their respective applicability for high altitude observations in the cusp/mantle and magnetotail lobes.
1 Introduction
Many theoretical studies have been devoted to investigate the H+ and O+ ion outflows at high-altitudes and high-latitudes, in particular they were interested in explaining the ion acceleration in polar wind and auroral regions. These studies were motivated by the existence of energetic O+ ions at high altitudes that have been confirmed by Gurgiolo and Burch (Citation1985), by the observations of the Suprathermal Mass spectrometer (SMS) aboard the Akebone satellite (Abe et al., Citation1993) which showed a significant mean outflow velocity for O+ ions at low altitudes (5000 km) and a monotonically increasing altitude profile for O+ ions above 5000 km, and by the observations of non-Maxwellian ion velocity distributions such as elevated conics and toroids that have been observed by Winningham and Burch (Citation1984), and Huddleston et al. (Citation2000), respectively.
Several studies explained these observations in terms of the classical polar wind theory; however many other studies explained it in terms of the non-classical mechanisms (e.g. wave–particle interactions, parallel potential drops, centrifugal accelerations, etc.…) in the polar wind theory [for more details related to these studies, see the review by Tam et al. (Citation2007)]. In the present study, we consider the effects of gravity, polarization electric field, and diverging lines of geomagnetic field, in addition emphasis and single out the wave–particle interactions (WPI) and its significant role in heating the ions in the direction that is perpendicular to the geomagnetic field and consequently, while part of the gained perpendicular energy is converted into the parallel direction due to the mirror force. This process produces O+ and H+ acceleration in the polar wind and auroral regions.
We have previously carried out Monte Carlo simulations of the ion outflows that considered the effect of WPI, in addition to the effects of gravity, polarization electric field, and diverging geomagnetic field, and compared them with the corresponding observations in the polar wind region (Barghouthi et al., Citation2011) and auroral region (Barghouthi, Citation2008).
This model (we call Barghouthi model hereafter) has been described and developed in a series of papers (Barghouthi and Barakat, Citation1995; Barakat and Barghouthi, Citation1994a,Citationb; Barghouthi, Citation1997, Citation2008; Barghouthi et al., Citation1998, Citation2007, Citation2008; Barghouthi and Atout, Citation2006). According to Barghouthi model, the effects of WPI on the polar wind plasma (Barghouthi et al., Citation1998) and resultant perpendicular heating are as follows; the temperature anisotropy (T⊥/T‖) was reduced and even reversed at high altitudes; the escape flux of O+ ions could be enhanced by more than an order of magnitudes while the H+ flux remains constant; the O+ ions were heated more efficiently than H+ ions; ion velocity distributions displayed conic behavior at low altitudes; and because of finite gyroradius effect, the ion velocity distribution moved from conic to toroid at high altitudes.
In the auroral region, Barghouthi and Atout (Citation2006), and Barghouthi et al. (Citation2007, Citation2008) investigated the effect of wave–particle interaction on H+ and O+ ion outflows at high altitudes related to the cusp by using the Monte Carlo method. They discussed the ion outflow by taking into consideration the effect of the finite gyroradius; they found that the behavior of ion outflow is completely different below and above the saturation point, (i.e. when the ion gyroradius becomes comparable to the wavelength of the electromagnetic turbulence). Below the saturation point, the ion velocity distribution displayed conic features, while above the saturation points it displayed toroidal features because of self- limiting heating process, in which the ions tend to move out of the heating zone in the velocity space. The presence of toroids is therefore a good signature that wavelength-limiting effects are important. This would allow for an experimental survey of upper bounds of the wavelength of electromagnetic turbulence.
Barghouthi (Citation2008) compared between the simulation results for H+ and O+ ion outflows in the auroral region obtained by using three different forms for the velocity diffusion rate perpendicular to the geomagnetic field lines (Barghouthi and Atout, Citation2006; Barghouthi et al., Citation2007, Citation2008) with the corresponding observations and found that, the velocity diffusion rate perpendicular to the geomagnetic field lines obtained by Barghouthi (Citation2008) was appropriate, indicating the rational of the Barghouthi model for the ion outflow along auroral field lines. The simulation results obtained by using Barghouthi model, i.e. ion velocity distributions, temperatures, velocities, total energies, etc. were in agreement with a number of corresponding observations.
Recently, Barghouthi et al. (Citation2011) used Barghouthi model with the boundary conditions of the polar wind region and obtained simulation results for H+ and O+ ion outflows in the polar wind and compared between simulation results and many different observations obtained from various satellites at different altitudes. They compared quantitatively and qualitatively between the simulation results and the corresponding observations. As a result of many comparisons, they found that the best agreement occurs when the perpendicular wavelength of the electromagnetic turbulence equals to 8 km. The quantitative comparisons showed that many characteristics of the observations are very close to the simulation results, and the qualitative comparisons produced very similar behaviors.
In this paper, we will compare the simulation results for H+ and O+ ion outflows in the polar wind region with the corresponding results in the auroral region. As a result of this comparison, we expect to advance our understanding of both regions, to present altitude profiles for ion moments and distribution functions that represent each region, to emphasize the importance of the initial boundary conditions, to investigate the strength of the wave–particle interactions in both regions to examine whether this is substantial or not at high-altitudes and high-latitudes. Finally, whereas the main purpose of this paper is not to compare with measurements, we will briefly discuss when and where our two (polar wind and auroral) descriptions of polar ion outflow are applicable by discussing some Cluster measurements in the high altitude cusp/mantle and in the lobes, reported in Nilsson et al. (Citation2006, Citation2010)".
This paper is organized as follows: We present the Barghouthi model in Section 2. Simulation results of O+ and H+ ion outflows in both regions are presented in Section 3. Applicability of the polar wind and auroral outflow descriptions is presented in Section 4. The discussions and conclusions are presented in Section 5.
2 Barghouthi model
Barghouthi model for investigating ion outflows at high-altitudes and high-latitudes has been explained in detail by Barghouthi (Citation2008). The simulation results of this model showed an excellent agreement when compared with the corresponding observations in polar wind region (Barghouthi et al., Citation2011) and auroral region (Barghouthi, Citation2008). Only a brief description is given here with emphasis on the velocity diffusion rate perpendicular to geomagnetic field lines D⊥ in both regions. We considered the steady state flow of O+, H+ and electrons. The simulation region is a geomagnetic tube extending from the exobase at 1.7 RE to 10 RE in the polar wind case and from 1.2 RE to 10 RE in the auroral region. The ion is injected at the exobase with a velocity that is consistent with the assumed velocity distribution at the lower boundary. The ion is followed for a small period of time Δt, during this period of time the ion is influenced by gravity, polarization electric field and diverging geomagnetic field lines, at the end of each Δt the velocity of the ion is modified due to these forces. The effect of WPI during this Δt is simulated by perturbing the ion’s perpendicular velocity v⊥ by a random step Δv⊥ such that (Barghouthi et al., Citation2007, Citation2008)(1) where D⊥(r, v⊥) is the quasi-linear velocity diffusion rate perpendicular to the geomagnetic field lines B, and is given by the following expression (Barghouthi, Citation2008):
(2) where in polar wind region, D⊥(r) is given by Barghouthi et al. (Citation1998) as follows:
(3) and in auroral region, D⊥(r) is given by Barghouthi (Citation1997) as follows:
(4)
In Eq. Equation(2)(2) , Ωi is the ion gyrofrequency, and k⊥ is perpendicular wave number and related to the characteristic perpendicular wavelength of the electromagnetic turbulence
. Here we assume
as an input parameter (see below).
These steps are repeated until the injected test ion exits the simulation region at either lower or top ends. The injected ions (one Million), one at a time, are monitored as they cross a chosen set of altitudes. At each altitude, statistics are accumulated about the ions’ motion and consequently, to calculate the ion velocity distribution and its velocity moments (i.e. density, drift velocity, parallel and perpendicular temperatures).
The boundary conditions selected for the polar wind region are similar to those of (Barghouthi et al., Citation1998, Citation2011): at the lower boundary (i.e. 1.7 RE),we set the O+ drift velocity as 0 cm s−1, the oxygen ion density as 100 cm−3, and the O+ temperature as 3000 K. However, for H+ ions, we set the H+ drift velocity as 11 km s−1, the hydrogen ion density as 200 cm−3, and the H+ ion temperature as 3000 K. Also, the electron temperature was kept constant at 1000 K along the entire simulation tube (1.7–10 RE), and the velocity distribution function for both H+ and O+ ions assumed to be Maxwellian at the lower boundary.
The boundary conditions selected for the auroral region are similar to those of Barghouthi (Citation2008), at the lower boundary (1.2 RE) we set the H+ ion drift velocity at 16 × 105 cm s−1, the H+ ion density at 100 cm−3, and the H+ ion temperature at the lower boundary as 0.2 eV (2320 K). We set the O+ ion drift velocity as 0 cm s−1, the oxygen ion density as 5000 cm−3, and the O+ ion temperature as 0.2 eV (2320 K). The electron temperature is kept constant as 1000 K along the entire simulation tube (1.2 RE–10 RE). We also assumed the velocity distribution to be a drifting Maxwellian for H+ ions and the up going half of non-drifting Maxwellian for O+ ions. The geomagnetic field B was taken to be proportional to r−3, where r is the geocentric distance.
The potential energy due to the body forces (i.e. gravitational force and electrostatic polarization field) is given by Barghouthi (Citation2008) as follows:(5) where k is Boltzmann’s constant; Te is the electron temperature which is kept constant in the simulation tube; and ne and ne0 are the electron densities at r and r0 (i.e. the lower boundary), respectively, which can be calculated from the quasi-neutrality condition [ne = n (O+) + n (H+)], G is the gravitational constant, ME is the mass of the earth, and m is the ion’s mass (i.e. H+ or O+). and present the altitude profiles of the potential energy due to the body forces given by Eq. Equation(6)
(6) . These profiles are obtained self-consistently, i.e. running Barghouthi model for the above conditions produces ion densities at different altitudes, these densities will be inserted into Eq. Equation(5)
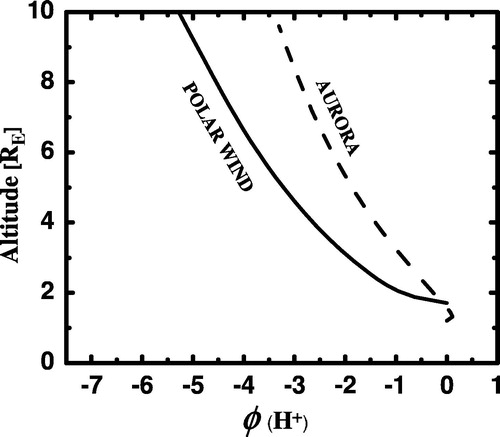
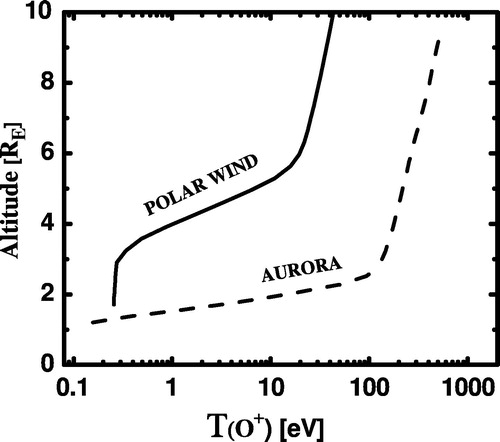
(5) to calculate the potential energy, we keep repeating this till the results converge, in other words, when the densities do not change and consequently, the potential energy do not change if we run the model more times. The altitude profiles () for O+ potential energy are monotonically increasing in both regions, and the O+ potential energy in the auroral region is much higher than that in the polar wind region. However, the altitude profiles () for H+ potential energy are monotonically decreasing in both regions, and similarly the H+ potential energy is higher in the auroral region than in the polar wind region. These differences will be discussed in the next section.
Figure 1 Altitude profiles of the O+ ion potential energy (ϕ), due to the gravitational force and polarization electric field, for polar wind (solid line) and auroral (dashed line) regions.
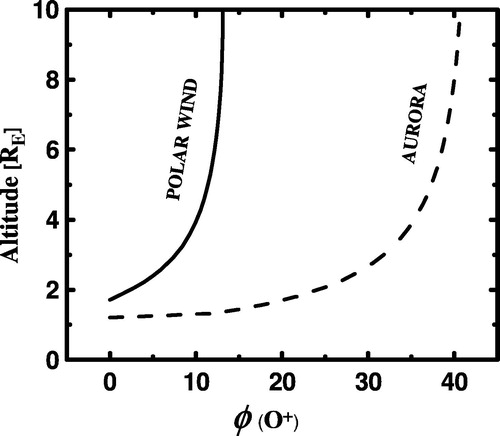
Figure 2 Altitude profiles of the H+ ions potential energy (ϕ), due to the gravitational force and polarization electric field, for polar wind (solid line) and auroral (dashed line) regions.
It is important to note, the characteristic perpendicular wavelength of the electromagnetic turbulence is included in the model as a parameter, because there is no detailed information about the k-spectrum of the electromagnetic turbulence in the simulation regions. However, as a result of many previous comparisons (Barghouthi, Citation2008; Barghouthi et al., Citation2011) between simulation results obtained by the model, for different values of
, and corresponding observations in both regions, we often get an excellent agreement with observations when
. Therefore, in this paper, we present the simulation results for H+ and O+ ion outflows in both regions by using Barghouthi model with; the above boundary conditions; and
.
3 Simulation results
Using the above Barghouthi model, altitude profiles for ion density, ion drift velocity, ion parallel and perpendicular temperatures, and ion velocity distributions have been simulated (Barghouthi, Citation2008; Barghouthi et al., Citation2011). The simulation results agree well with the corresponding observations if (characteristic perpendicular wavelength of the electromagnetic turbulence) is 8 km for both auroral region (Barghouthi, Citation2008) and polar cap (Barghouthi et al., Citation2011). In such case, the model is useful to extract the cause of difference between these two regions such as the effect and strength of the WPI in both regions. This comparison is the purpose of this paper.
Here, we present these simulation results in both regions for the sake of comparison between ion outflows behavior and to shed light on the effect and strength of WPI in both regions. Because, comparing between different simulation results in different regions that have been obtained by the same model is clearly important, both because it gives a more complete description of the model and because it sheds light on the effect of WPI and the effect of initial and boundary conditions. The comparison is made for relatively simple flows and we did not consider different geophysical conditions such as variations of the solar activities, geomagnetic activities, the variations in the spectral densities of the electromagnetic turbulences, three dimensional flow and the crossings between different regions, etc. Nevertheless, the comparison is illuminating, particularly with regard to understanding the range of applicability of the Barghouthi model. It is important that comparative studies continue to be made in the future as the various modeling techniques are extended to ever more complicated flow situations, or when the models are upgraded due to new findings in the observations and data analysis.
presents contour plots for H+ velocity distributions in both regions and at different altitudes. Left panel shows the ion velocity distribution in the polar wind region; at the lower boundary the distribution function is Maxwellian which is the same as initial boundary conditions. At 4.93 RE it is bi-Maxwellian i.e. its parallel temperature is higher than its perpendicular temperature. This is consistent with the anisotropy behavior that is given in . The temperature anisotropy is decreasing at altitudes until 5 RE and starts increasing above this altitude. At high altitudes, i.e. at about 9 RE the distribution function starts to display conic features. The toroidal features did not appear at altitudes below 10 RE, however it appeared at higher altitudes (not shown here). This is because in the polar wind case the ion gyroradius stays below 8 km (our wavelength limit for the electric field turbulence, mentioned in Barghouthi (Citation2008) and Barghouthi et al. (Citation2011), and discussed below) that makes 0 < (k⊥v⊥/Ωi) < 1. The right panel shows the distribution function in the auroral region, the conic features appeared at lower altitudes (2.95 RE) and the toroidal features are well established at 4.93 RE and saturate above that altitude. The saturation of the toroidal features is consistent with the results of the anisotropy shown in , i.e. the anisotropy in the auroral region is almost constant above 4 RE.
Figure 3 H+ ion velocity distribution functions at different geocentric altitudes in the polar wind (left panel) and auroral (right panel) regions. f(H+) Is represented by equal value contours in the normalized velocity plane, where
. The contour levels decrease successively by a factor e1/2 from the maximum.
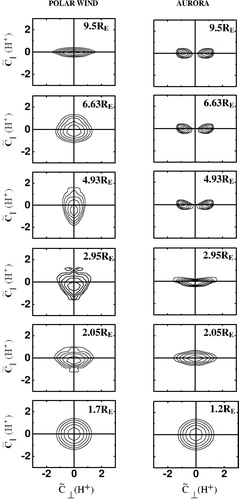
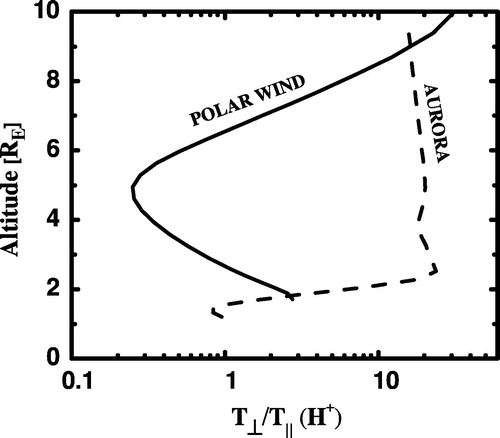
Figure 4 Altitude profiles of H+ ion temperature anisotropy (T⊥/T‖) in the polar wind (solid line) and auroral (dashed line) regions.
In the polar wind region the effect of WPI was negligible at altitudes below 5 RE and is dominated by the effect of perpendicular adiabatic cooling. Therefore perpendicular temperature decreased and consequently, and the anisotropy also decreased. However at altitude of about 5 RE the effect of WPI starts to be dominant and consequently, the H+ ions get heated in the perpendicular direction and part of this energy is converted into the parallel direction as a result of mirror force. This explains the existence of the conic distributions at high altitudes. As mentioned above the conic features appeared at lower altitudes in the auroral region, because the intensities of the electromagnetic turbulences in that region are very high, when compared to the polar wind region, and consequently, the diffusion coefficient is higher than in the polar wind region and then the strength of the WPI is stronger in the auroral region than in the polar wind region. At very low altitudes the effect of WPI is dominant and the ions get heated in the perpendicular direction and formed the conic distribution. At higher altitudes, the existence of the toroids and its saturation at higher altitudes is due to the effect of finite gyroradius (Barghouthi et al., Citation2007); when the ions are heated due to wave–particle interactions (i.e. ion interactions with electromagnetic turbulence) and move to higher altitudes, the ion gyroradius may become comparable to the electromagnetic turbulence wavelength . Consequently (k⊥v⊥/Ωi) becomes larger than unity, making the heating rate negligible according to Eq. Equation(2)
(2) . The motion of the ions is described by using Liouville theorem.
presents the contour plots of the O+ ion velocity distribution functions in both regions. In the polar wind region (left panel), at low altitudes (below 2 RE) it is Maxwellian, and at intermediate altitudes (∼5 RE) it is conic and at higher altitudes (above 6 RE) it is toroid. The existence of O+ conics at intermediate altitudes which appeared at higher altitudes for the H+ ions, and the appearance of O+ toroids at higher altitudes which did not show up for H+ ions below 10 RE, is mainly due to the strength of WPI which is due to the heavy mass of O+ ions when compared to H+ ions and to the diffusion coefficient. It also results from the larger gyroradius of the heavier O+ ions. Similarly, the conic features appeared at lower altitudes (∼2 RE) in the auroral region, and the toroids at 3.94 RE, this is due to the strength of the WPI in the auroral region. Also the saturation of the toroids occurred at all altitudes above 3.94 RE, this means that the ion gyroradius became comparable to the electromagnetic turbulence wavelength at 3.94 RE. These results for O+ ion velocity distributions are consistent with the anisotropy altitude profiles presented in . The anisotropy is increasing with altitude in both regions; i.e., perpendicular temperature is increasing with altitude as a result of perpendicular heating that is due to WPI.
Figure 5 O+ ion velocity distribution functions at different geocentric altitudes in the polar wind (left panel) and auroral (right panel) regions. f(O+) Is represented by equal value contours in the normalized velocity plane, where
. The contour levels decrease successively by a factor e1/2 from the maximum.
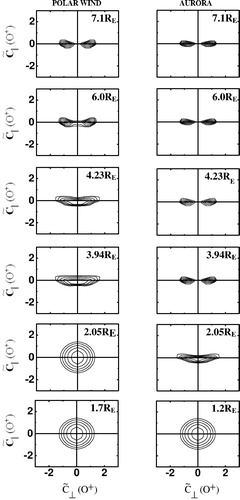
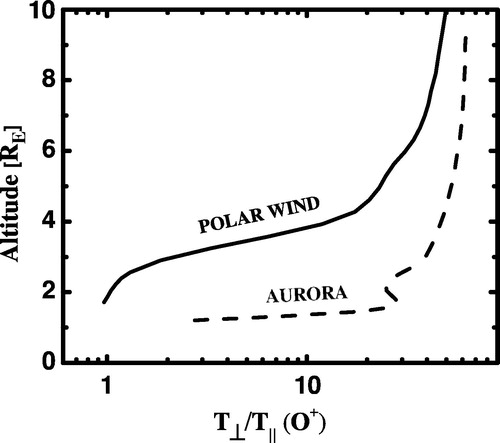
Figure 6 Altitude profiles of O+ ion temperature anisotropy (T⊥/T‖) in the polar wind (solid line) and auroral (dashed line) regions.
and present the velocity moments for H+ and O+ ions in both regions, the moments considered here are defined as follows:(6)
(7)
(8)
(9)
Figure 7 Altitude profiles of the lower order H+ moments for polar wind (solid line) and auroral (dotted line) regions. The moments considered here are: density n[cm−3] (top left), drift velocity u[cm/s] (top right), perpendicular temperature T⊥[k] (bottom left), and parallel temperature T‖[k] (bottom right).
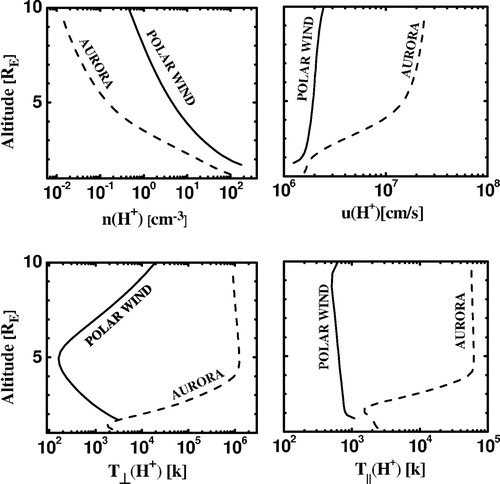
Figure 8 Altitude profiles of the lower order O+ moment for polar wind (solid line) and auroral (dotted line) regions. The moments considered here are: density n[cm−3] (top left), drift velocity u[cm/s] (top right), perpendicular temperature T⊥[k] (bottom left), and parallel temperature T‖[k] (bottom right).
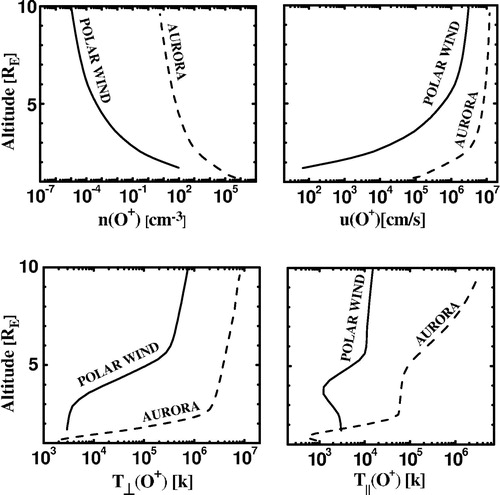
In Eqs. (6)–(9), i denotes the type of the ion (H+ or O+) and, ni, ui, Ti‖, and Ti⊥ are the ion density, drift velocity, parallel temperature, and perpendicular temperature, respectively.
presents altitude profiles for H+ ions in both regions, in the auroral region (top right panel, dashed line), H+ ion drift velocity increases rapidly at altitudes below 4.93 RE due to WPI, and almost saturates above that altitude. The WPI process heats the ions in the perpendicular direction and part of this heat is transferred to the parallel direction by the mirror force resulting in accelerating H+ ions in the parallel direction. However at altitudes above 4.93 RE the role of WPI is negligible, because the ion gyroradius became comparable to the electromagnetic turbulence wavelength at that altitude (i.e. 4.93 RE), causing a quick decrease of D⊥ with altitude, i.e., no more effective heating. In the polar wind region (top right panel, solid line), the drift velocity increases, very slowly, at very low altitudes due to the effect of WPI and boundary conditions (we set the H+ ion drift velocity to be 11 km s−1 at the lower boundary), and remained almost constant at most altitudes. The altitude profile of the H+ density (top left panel) is related to that of the drift velocity to conserve the flux.
The altitude profile of H+ ion temperature (perpendicular or parallel, lower panels) is a result of balance between the heating process in the perpendicular direction due to WPI and perpendicular adiabatic cooling, in which part of the energy converted from perpendicular direction into the parallel direction in order to keep the first adiabatic invariant constant (so called mirror force mentioned above). In the auroral region, perpendicular temperature increases, very rapidly, at altitudes below the saturation point (∼4.93 RE) and decreases, very slowly, above that altitude. It increases due to WPI which heats the ions in the perpendicular directions, and this effect dominates over the perpendicular adiabatic cooling. However, at altitudes above the saturation point the perpendicular heating by WPI becomes self-limiting (i.e. no more effective heating is coming from WPI, because D⊥ decreases very rapidly by a factor of (k⊥v⊥/Ωi)−3 above the saturation point at which the H+ gyroradius becomes comparable to the wavelength of the electromagnetic turbulence) and the perpendicular adiabatic cooling turned to be the most important factor in controlling the behavior of H+ ion perpendicular temperature. In the polar wind region, T⊥(H+) decreases at altitudes below 5 RE and increases above that altitude. This behavior is due to the competition between the effects of WPI and perpendicular adiabatic cooling. At low altitudes the perpendicular adiabatic cooling seems to be the dominant effect; however at higher altitudes the WPI is the dominant effect. The strength of the WPI in the polar wind is much less than that in the auroral region; this is due to the altitude dependence of the diffusion coefficient, as shown in Eqs. Equation(3)
(3) and Equation(4)
(4) .
The behavior of H+ parallel temperature in the polar wind (lower-right panel, ) is highly related to the behavior of H+ perpendicular temperature, and decreases at most altitudes due to parallel adiabatic cooling (Barakat and Lemaire, Citation1990). The parallel adiabatic cooling is a mechanism in which the WPI heats the ions in the perpendicular direction and then part of this energy is transferred to the parallel direction which enhances the mirror force, i.e. the H+ acceleration and H+ drift velocity while parallel temperature decreases as shown in Eq. Equation(8)(8) . At very high altitudes, the effect of WPI is very strong and the amount of energy transferred to the parallel direction dominates the effect of parallel adiabatic cooling. In the auroral region parallel temperature decreases at very low altitudes due to parallel adiabatic cooling, and then increases very rapidly due to the amount of energy transferred from the perpendicular direction to the parallel direction, where the effect of WPI is very strong and dominates other effects. However, at altitudes above the saturation point and when the heating turned to be self-limiting the amount of energy transferred to the parallel direction becomes less and then the effect of parallel adiabatic cooling becomes dominant.
presents O+ ion altitude profiles in both regions. Similarly, WPI heats the O+ ions in the perpendicular direction, and later a part of this energy transferred to the parallel direction. The transferred energy increases the ion velocity in the parallel direction, explaining the behavior of the altitude profiles for O+ ion drift velocity in both regions. It is clear from that O+ ion drift velocity in the auroral region is much higher than that in the polar wind region. This is due to the strong WPI, i.e. (D⊥ is much higher in the auroral region as shown in Eqs. Equation(3)(3) and Equation(4)
(4) ). The altitude profile of the O+ density (top left panel) is related to that of the O+ ion drift velocity due to the flux conservation. The O+ perpendicular temperature T⊥(O+), is increasing in both regions, and is much higher in the auroral region. In the auroral region T⊥(O+) increases very rapidly at very low altitudes. This is due to WPI and O+ potential barrier. presents O+ potential energy due to gravitational force and polarization electric field. This potential is always positive, and therefore, O+ needs very large energy to overcome this potential barrier. If the gained energy is not enough, O+ will be reflected downward in the simulation tube, during which they will be heated and gain energy due to WPI. Then a part of this energy will be converted into the parallel direction to make the ions turned to move upward. These ions are again reflected downward due to the new potential barrier. Thus they bounce between high altitude and low altitude until they gain enough energy to overcome the potential barrier. Note that the reflection barrier increases every reflection. This is similar to the pressure cooker effect (Barakat and Barghouthi, Citation1994a). This explains the behavior of O+ perpendicular temperature at low altitudes, where O+ potential increases very rapidly. At higher altitudes, T⊥(O+) increases very slowly; because the potential barrier is still positive and increasing monotonically very slowly. Therefore, ions need less energy to overcome this barrier. In the polar wind region, T⊥(O+) increases very slowly at low altitudes, due to the effect of the potential barrier which is smoothly increasing (). Therefore ions need less energy to overcome this barrier. At higher altitudes, the effect of WPI becomes significant and increases the O+ ion perpendicular temperature. Finally, the altitude profile of O+ parallel temperature is related to that of T⊥(O+). In the auroral region it increases due to the energy converted from perpendicular direction into the parallel direction. However, in the polar wind region it decreases at low altitudes and then increases. As mentioned before, at low altitudes parallel adiabatic cooling is dominant while at higher altitudes the energy transferred from the perpendicular direction overcomes the effect of parallel adiabatic cooling.
H+ and O+ ion temperatures, Ti = (Ti‖ + 2Ti⊥)/3, have been calculated and their altitude profiles are presented in and , respectively. The behavior of the ion temperatures in both regions and for both ions is similar to the corresponding ions perpendicular temperatures. This means that the main contribution to the total ion temperature is coming from the perpendicular direction, and that behavior of the ions in the perpendicular direction is generally due to the effect of WPI. Also, we produced these figures because most of the observations are given in terms of total ion temperature, i.e. to make any future comparison between these simulation results and new observations more convenient.
Figure 9 Altitude profiles of H+ ion temperature, for polar wind (solid line) and auroral (dashed line) regions.
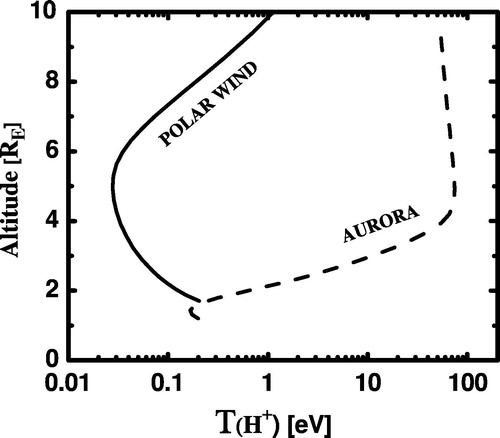
Figure 10 Altitude profiles of O+ ion temperature, for polar wind (solid line) and auroral (dashed line) regions.
It is important to note that ion potential energy depends on the density of both ions, i.e. O+ potential energy in the auroral region depends on the density of O+ ions and on the density of H+ ions in that region. The density of these ions in the auroral region is much higher than that in the polar wind region. This explains the difference in the ion’s potential energy in both regions.
4 Applicability of the polar wind and auroral outflow descriptions
Our polar cap ion outflow description is based on empirically-determined lower boundary conditions and on the observed lower wave activity in the polar cap as compared to the auroral zone. The O+ ions at our lower boundary have zero parallel bulk velocity based on the statistical results from observations, e.g. Su et al. (Citation1998) and Chandler et al. (Citation1991). The observations by Su et al. (Citation1998) actually indicated a slight downward drift but with a significant perpendicular temperature (0.61 eV) which would lead to mirroring not very far below the altitude of observation. Therefore an initial velocity of zero (which does not immediately lead to the ions leaving the simulation box) is consistent with the low downward velocity reported by Su et al. (Citation1998). Because of the low parallel velocity the O+ ions may have drifted horizontally for a significant distance, and it has been suggested that the source is the cusp (i.e. cleft ion fountain). These ions are most likely described as auroral zone ion outflow at some time before they entered our simulation region, but the origin (i.e. either polar cap or auroral zone) is only important for the lower boundary conditions. The situation becomes a bit more uncertain closer to the cusp. In the cusp intense heating is known to take place, and we expect our auroral zone simulation to accurately describe the outflow within the cusp. However the cusp has rather limited spatial extent, especially at lower altitudes, so that ions will drift through the heating region and then come out into the polar cap region with a lower wave activity, i.e. as illustrated in Bouhram et al. (Citation2003), their Fig. 1. At higher altitudes, 5 to 10 RE, the region geometrically above the polar cap is the cusp/mantle, where proton fluxes are dominated by magnetosheath origin fluxes, which in the mantle have been reflected by the earth’s magnetic field and are flowing out (Nilsson et al., Citation2006). High ion temperatures are reported, and it seems feasible that this region can be described by our auroral zone model. The O+ fluxes in the high altitude cusp/mantle shows transients nature with the time scale comparable to the flux transfer event, similar to what is observed in the ionospheric cusp, inconsistent with the cusp origin (Nilsson et al., Citation2008). The instantaneous downward mapping of many of these field lines will however end up in the polar cap, so we expect the polar wind description to be valid at lower altitudes along these field lines. The slower moving ions of the polar wind compared to the auroral ions will have time to convect further toward the night side during their upward transport, so that when they reach high altitudes they are in the magnetotail lobes rather than above geometrically above the polar cap. The situation is very well described in a paper on centrifugal acceleration in the lobes by Nilsson et al. (Citation2010), their Fig. 3. This figure compares cusp/mantle ion outflow as reported by Nilsson et al. (Citation2004, Citation2006)" with lobe outflow of cold plasma as reported by Engwall et al. (Citation2009). For the cusp/mantle outflow centrifugal acceleration could only explain a part of the ion acceleration, and the major part could be attributed to transverse ion heating due to wave–particle interactions. In the lobes the wave–particle interactions effect was small on the cold outflowing plasma, which is consistent with our results for polar cap H+. Furthermore, the magnetotail lobe observations using the new spacecraft wake technique indicate that the ions have a lower thermal velocity than drift velocity, and that drift energy is less than the equivalent energy of the spacecraft potential of a few 10 V for a sunlit spacecraft in the tenuous lobes. Our polar wind model results are consistent with both results. Therefore as a first approximation we suggest to use our auroral zone description for the cusp and high altitude cusp/mantle, and for above some latitude and below some altitude we expect the polar wind description to be more applicable. We suggest describing the ions ending up in the magnetotail by the polar wind outflow model throughout their transport path. The more detailed transitions between these descriptions will be the subject of a future study based on Cluster data and the Barghouthi model.
5 Discussions and conclusions
In this study, we have investigated the effect of wave-particle interactions on the ion outflows in the polar wind and auroral regions by using Barghouthi model. To understand the ion’s behavior in these regions we have to take into consideration the followings:
| (1) | The effect of wave–particle interactions. The role of this effect is to heat the ions in the perpendicular direction, i.e. the direction that is perpendicular to the direction of the geomagnetic field lines. The values of the velocity diffusion coefficients D⊥ in the auroral region are much higher than the corresponding values in the polar wind region; therefore we expect the influence of the WPI effect in the auroral region to be more significant in heating the ions than in the polar wind region. From the previous simulation results, we found that the role of WPI is very important to be taken into consideration in the both regions, and for both ions. Also, the influence of WPI on O+ ion outflows is much higher than the influence of WPI on H+ ion outflows in both regions. | ||||
| (2) | The effect of perpendicular adiabatic cooling. The role of this effect is against the role of WPI, i.e. it decreases the perpendicular temperature while WPI increases the perpendicular temperature. However, when the effect of WPI becomes very strong it will dominate this effect and consequently, the perpendicular temperature will be increased. The perpendicular adiabatic cooling still provides a significant transfer of energy into the parallel direction, so it is an important mechanism also when perpendicular heating dominates the effect on the perpendicular temperature. | ||||
| (3) | The effect of parallel adiabatic cooling. The increasing of the ions drift velocity due to energy transfer from perpendicular direction to the parallel direction will decrease the parallel temperature (Barakat and Lemaire, Citation1990). However, when the effect of WPI becomes very large, the energy transfer from perpendicular direction to the parallel turned to be much more than the energy needed to keep the first adiabatic invariant constant and thus parallel temperature increases. | ||||
| (4) | The effect of body forces, i.e. the effect of gravity and polarization electric field. The O+ potential energies due to these forces are positive and monotonically increasing in both regions; however, H+ potential energies due to these forces are negative and monotonically decreasing in both regions. This O+ potential energy acts as a barrier in the polar wind and auroral regions and the ions need to gain enough energy in order to be able to overcome this barrier. This leads to longer residence time for the ions in the region where body forces are comparative to the wave–particle interactions, and consequently long transport times for the particles. This is important when the ion heating and acceleration are placed into the context of the magnetospheric convection pattern. Ions may be transported between the two main regions, polar cap and auroral oval during their transport along the field-line. | ||||
| (5) | The effect of a finite wavelength of the waves interacting with the ions leads to a clear observational feature i.e. the appearance of toroid distributions. These occur when the velocity diffusion coefficient turns to be small and rapidly decreases at a high velocity and this happened where the ion gyroradius becomes comparable to the wavelength of the waves. Particles tend to accumulate in the region with a lower velocity diffusion coefficient and the low velocity region which retains its comparably a higher velocity diffusion coefficient is depleted in particles. The presence of toroids is thus a sign that finite wavelength effects are important and that heating is efficient enough to energize particles so that the gyroradius becomes similar to the wavelength of the waves. We predict toroid distributions to be more common for O+ than for H+, more common at higher altitudes as well as in the auroral zone as compared to the polar cap. | ||||
| (6) | We discussed the applicability of our two different model regions to a high altitude outflow as observed by Cluster. We suggest that the auroral zone description is suitable for the cusp/mantle, but above some latitude and below some altitude we expect a transition to polar wind like conditions. The precise limits will be the subject of a future study. However, in the magnetotail lobes and along the transport path leading to the lobes we suggest that the polar wind description is valid. | ||||
In summary, and up to our knowledge, the effect of wave–particle interactions is very important in modeling ion outflows in the auroral region and polar wind, and it is the mechanism that is responsible for the existence of O+ ions at high-altitudes and high-latitudes. Also, we would like to mention that the simulation results presented here, that have been obtained by using Barghouthi model with equals to 8 km, produced an excellent agreement when compared to the corresponding observations in both regions (Barghouthi, Citation2008; Barghouthi et al., Citation2011).
Acknowledgement
This research was supported by the Swedish Research Links program, Swedish research council, Stockholm, Sweden.
Notes
Peer review under responsibility of University of Bahrain
References
- T.AbeB.A.WhalenA.W.YauR.E.HoritaS.WatanbeE.Sagawa 1993 EXOS D (Akebono) suprathermal mass spectrometer observations of the polar windJ. Geophys. Res.98 (11), 191
- A.R.BarakatI.A.Barghouthi 1994a The effects of wave–particle interactions on the polar wind O+Geophys. Res. Lett. 21, 2279–2282
- A.R.BarakatI.A.Barghouthi 1994 The effects of wave–particle interactions on the polar wind: preliminary resultsPlanet. Space Sci. 42, 987–992
- A.R.BarakatJ.Lemaire1990 Monte Carlo study of the escape of a minor speciesPhys. Rev. A 42, 3291–3302
- I.A.Barghouthi 1997 Effects of wave–particle interactions on H+ and O+ outflow at high latitude: a comparative studyJ. Geophys. Res.102, 22.062–22.075
- I.A.Barghouthi 2008 A Monte Carlo study for ion outflows at high altitude and high latitude: Barghouthi modelJ. Geophys. Res.113, A08209 1–11
- I.A.BarghouthiM.A.Atout 2006 Monte Carlo modeling of toroidal ion distributions and ion temperatures at high altitudes equatorward of the cusp: effect of finite gyroradius. J. Geophys. Res.111, A03202
- I.A.BarghouthiA.R.Barakat 1995 Comparison between the wave–particle interaction in the polar wind and in the auroral regionPhys. Space Plasmas 13, 445–450
- I.A.BarghouthiA.R.BarakatA.M.Persoon 1998 The effects of altitude-dependent wave–particle interactions on the polar wind plasma Astrophys. Space Sci. 259, 117
- I.A.BarghouthiN.M.DoudinA.A.SalehV.Pierrard 2008 The effect of altitude and velocity dependent wave–particle interactions on the H+ and O+ outflows in the auroral region J. Atmos. Solar-terrestrial Phys.70, 1159–1169
- I.A.BarghouthiN.M.DoudinA.A.SalehV.Pierrard 2007 High-altitude and high-latitude O+ and H+ outflows: the effect of finite electromagnetic turbulence wavelength Ann. Geophys. 25, 2195–2202
- I.A.BarghouthiS.GhithanH.Nilsson 2011 A comparison study between observations and simulation results of Barghouthi model for O+ and H+ outflows in the polar windAnn. Geophys.29, 2061–2079
- M.BouhramM.MalingreJ.R.JasperseN.Dubouloz 2003 Modeling transverse heating and outflow of ionospheric ions from the dayside cusp/clef: 1 A parametric study Ann. Geophys.21, 1753–1771
- M.O.ChandlerJ.H.WaiteJr.T.E.Moore 1991 Observations of polar ion outflows J. Geophys. Res. 96, 1421–1428
- E.EngwallA.I.ErikssonC.M.CullyM.AndréP.-A.Puhl-QuinnH.VaithR.Torbert 2009 Statistics of the cold hidden component of ionospheric outflow determined from 5 to 19 RE in the Earth’s magnetotail Ann. Geophys. 27, 3185–3201
- C.GurgioloJ.L.Burch 1985 DE-1 observations of the polar wind – A heated and unheated componentGeophys. Res. Lett.9, 945–948
- M.M.HuddlestonC.J.PollockM.P.WuestJ.S.PichettT.E.MooreW.K.Peterson 2000 Toroidal ion distributions observed at high altitudes equatorward of the cusp Geophys. Res. Lett.27, 4 469–472
- H.NilssonS.JokoR.LundinH.RèmeJ.-A.SauvaudI.DandourasA.BaloghC.CarrL.M.KistlerB.KleckerC.W.CarlsonM.B.Bavassano-CattaneoA.Korth 2004 The structure of high altitude O+ energization and outflow; A case study Ann. Geophys. 2497–2506
- H.NilssonM.WaaraS.ArveliusO.MarghituM.BouhramY.HobaraM.YamauchiR.LundinH.RèmeJ.-A.SauvaudI.DandourasA.BaloghL.M.KistlerB.KleckerC.W.CarlsonM.B.Bavassano-CattaneoA.Korth 2006 Characteristics of high altitude oxygen ion energization and outflow as observed by Cluster; a statistical studyAnn. Geophys.24, 1099–1112
- H.NilssonM.WaaraO.MarghituM.YamauchiR.LundinH.RèmeJ.-A.SauvaudI.DandourasE.LucekL.M.KistlerB.KleckerC.W.CarlssonM.B.Bavassano-CattaneoA.Korth 2008 Transients in oxygen outflow above the polar cap as observed by the Cluster spacecraftAnn. Geophys.26, 3365–3373
- H.NilssonE.EngwallA.ErikssonP.A.Puhl-QuinnS.Arvelius 2010 Centrifugal acceleration in the magnetotail lobesAnn. Geophys.28, 569–576
- Y.J.SuJ.L.HorwitzT.L.Moore 1998 Polar wind survey with the thermal ion dynamics experiment/plasmasource instrument suite aboard POLARJ. Geophys. Res.103, 29305–29337
- S.W.Y.TamT.ChangV.Pierrard 2007 Kinetic modeling of the polar windJ. Atmos. Solar-terrestrial Phys.69, 1984–2027
- J.D.WinninghamJ.Burch 1984 Observations of large-scale ion conic generation with DE-1Phys. Space Plasmas5, 137–158