
Abstract
The aim of the present work is to develop sensitive, simple, accurate, precise and cost effective UV-spectrophotometric methods for the determination of sumatriptan succinate (STS), an anti-migraine drug, in bulk and pharmaceutical dosage form; and also to monitor the degradation behavior of the drug under different ICH prescribed stress conditions. Two methods were developed using different solvents, 0.1 M HCl (method A) and acetonitrile (method B). The calibration graphs are linear over the range of 0.2–6.0 μg ml−1 in both the methods with a correlation coefficient (r) of 0.9999. The apparent molar absorptivity values are 7.59 × 10⁴ and 7.81 × 10⁴ l mol−1 cm−1, for method A and method B, respectively. The other optical characteristics such as Sandell’s sensitivity, limit of detection (LOD) and limit of quantification (LOQ) values are also reported. The accuracy and precision of the methods were evaluated based on intra-day and inter-day variations. The accuracy of the methods was further confirmed by standard addition procedure. The degradation behavior of the drug was studied by subjecting STS to an acid and alkaline hydrolysis, oxidative, thermal and UV degradation. This study indicated that STS was degraded in alkaline medium and in oxidative condition. The proposed methods were successfully applied to the determination of STS in tablets and the results obtained are comparable with the official method.
1 Introduction
Triptans are a group of tryptamine-based drugs used in the acute treatment of migraine headaches. Sumatriptan succinate () is one among them and is structurally related to the neurotransmitter serotonin. Sumatriptan succinate (STS) is a 5-hydroxytryptamine (5-HT) receptor subtype (a member of the 5-HT 1D family) having only a weak affinity for 5-HT1A, 5-HT5A, and 5-HT7 receptors and chemically designated as [3-[2-(Dimethylamino)ethyl]-1H-indol-5-yl]-N-methylmethanesulfonamide hydrogen butanedioate (British Pharmacopoeia, Citation2009). STS acts by selectively binding to serotonin type-1D receptors (serotonin agonist) and rapidly terminates a migraine attack while eliminating associated symptoms such as nausea, vomiting, and light and sound sensitivity (Conquering headache, Citation2003).
Figure 1 Structure of sumatriptan succinate.
STS has official monographs in BP (British Pharmacopoeia, Citation2009) and EP (European Pharmacopoeia, Citation2005), which describe liquid chromatographic methods for the assay of STS, and also in USP (The United States Pharmacopoeia, Citation2004) which describes high-performance liquid chromatographic (HPLC) method for its determination. Literature survey reveals that few analytical methods have been published for the analysis of STS in biological fluids such as high-performance liquid chromatography (HPLC) (Andrew et al., Citation1993; Ge et al., Citation2004; Moira and Peter, Citation1996; Franklin et al., Citation1996") and liquid chromatographic–mass spectrometry (Cheng et al., Citation1998). A few methods are found in the literature for the determination of STS in the bulk drug and in pharmaceutical preparations and include high-performance liquid chromatography (HPLC) (Avadhanulu et al., Citation1996; Shirsat et al., Citation1998; Sukhdev and Ravi, Citation1997; Nagesh et al., Citation1997"), ultra-performance liquid chromatography (UPLC) (Reddy et al., Citation2011), liquid chromatography–mass spectrometry (LC–MS) (Xiaohui et al., Citation2001), voltammetry (Sagar et al., Citation1992), capillary electrophoresis (Altria and Filbey, Citation1993; Al Azzam et al., Citation2011"), electrochemical methods (Saeed et al., Citation2011; Mandana et al., Citation2011"), visible spectrophotometry (Kalyanaramu and Raghubabu, Citation2010, Citation2011a,Citationb,Citationc; Fathima et al., Citation2012; Tipre and Vavia, Citation1999; Satyanarayana and Nageswara Rao, Citation2011 ) and UV-spectrophotometry (Prabahar et al., Citation2009; Pourmand et al., Citation2011; Gondalia and Dharamsi, Citation2011; Trinath et al., Citation2010 Sagar et al., Citation2011").
Only two UV-spectrophotometric methods have been reported for STS when it is present alone in tablets. A method based on the measurement absorbance of the drug in water at 220 nm has been reported (Prabahar et al., Citation2009) and the method obeys Beer’s law in the 1–12 μg ml−1 concentration range. Measurement of the absorbance of aqueous solution of drug at 282 nm in the range of 21–39 μg ml−1 has served as the basis of a method reported (Pourmand et al., Citation2011).
Simultaneous determination of STS and naproxen sodium (NAP) by three different approaches is found in the literature. The method involving determination of naproxen sodium and STS using the first derivative spectrophotometry at 241.0 and 236.0 nm over the concentration ranges of 0.5–3.5 μg ml−1 for both drugs has been described (Gondalia and Dharamsi, Citation2011). Two UV-spectrophotometric methods (Trinath et al., Citation2010) have been reported for the simultaneous determination of STS and NAP in their combined dosage forms. First method is Q absorption ratio method using two wavelengths, 272 nm (λmax of NAP) and 284 nm (λmax of STS). The second method is the first order derivative technique. In this method the zero crossing point of naproxen sodium was selected at 298 nm and for sumatriptan it was 335 nm. The solvent used was methanol in both the methods and linearity range for Q absorption ratio was 10–90 μg ml−1 and for derivative method it was 20–190 μg ml−1. In another approach (Sagar et al., Citation2011), STS and NAP were assayed by first order derivative method in which the zero crossing point of STS was at 329.8 nm and for NAP at 297.6 nm. The linearity was found to be in the range of 3–18 μg ml−1 for both the drugs when methanol was used as solvent.
Most of the reported methods are often time consuming, expensive, use multi or expensive reagents, cumbersome and required expertise operational personnel as indicated in . UV spectrophotometry, because of simplicity, reproducibility and speed and also it requires minimum solvent/reagent system and less analysis time, is widely used for the assay of the therapeutic compounds used as medications.
Table 1 Comparison of the proposed and the existing visible spectrophotometric methods.
The UV-spectrophotometric technique is widely employed in pharmaceutical analysis (Basavaiah et al., Citation2010, Citation2011; Raghu et al., Citation2012; Walash et al., Citation2009; Hurtado et al., Citation2007"). To study the degradation behavior of the drug, susceptibility to oxidation is one of the required tests. Also the acid or base hydrolysis, thermal and photolytic stability studies are required (ICH-Q1A (R2), Citation2003). Even though a few UV-spectrophotometric methods (Prabahar et al., Citation2009; Pourmand et al., Citation2011; Gondalia and Dharamsi, Citation2011; Trinath et al., Citation2010; Sagar et al., Citation2011") for the determination of STS were reported, none of them is stability-indicating. The reported two stability indicating methods using HPLC (Sukhdev and Ravi, Citation1997) and micellar electrokinetic chromatography (Al Azzam et al., Citation2011) require expensive experimental set up and expertise personnel. Thus, two simple, inexpensive, accurate, reproducible stability indicating UV spectrophotometric methods for the determination of STS in bulk drug and in tablets are developed. The methods are based on the measurement of absorbance of STS solution in either 0.1 M HCl (method A) or acetonitrile (method B). The proposed methods were validated as per ICH guidelines (ICH-Q1A (R1), Citation2005). The developed methods were successfully applied to the quantification of STS in its tablets without any interference by the inactive ingredients.
2 Experimental
2.1 Apparatus
The Spectrophotometric measurements were carried out using Shimadzu Pharmaspec 1700 UV/Visible spectrophotometer.
2.2 Materials
All chemicals used were of analytical reagent grade. Doubly-distilled water was used to prepare solutions wherever required. Acetonitrile, hydrogen peroxide (H2O2), hydrochloric acid and sodium hydroxide were purchased from Merck (Mumbai, India). Sumatriptan succinate sample (purity 99.5%) was kindly supplied by MSN laboratories, Hyderabad, India. Two brands of tablets namely Suminat-25 and Suminat-50 (Sun Pharmaceuticals Ltd., Sikkim, India) were purchased from local commercial sources.
2.3 Reagents
Hydrochloric acid (1 M) was prepared by appropriate dilution of concentrated acid (Sp. gr. 1.18) with water and further diluted to get 0.1 M HCl. A 5% solution of H2O2 was prepared by diluting suitable volume of the commercially available reagent to 100 ml with water in a volumetric flask. Sodium hydroxide solution (1 M) was prepared by dissolving required amount of the pellets in water.
2.4 Standard drug solution
Standard drug solutions of 10 μg ml−1 STS in HCl (0.1 M) and acetonitrile were prepared separately and used for assay in method A and method B, respectively.
2.5 Procedures
2.5.1 Preparation of calibration curve
Into a series of 10 ml calibration flasks, aliquots of standard drug solution (0.2–6 ml of 10 μg ml−1) equivalent to 0.2–6.0 μg ml−1 STS were accurately transferred and the volume was made up to the mark with the solvent (0.1 M HCl in method A; acetonitrile in method B). The absorbance of each solution was then measured at 226 nm in method A and 228 nm in method B, against the respective solvent.
In either case, calibration curve was prepared by plotting the absorbance versus concentration of drug. The concentration of the unknown was read from the respective calibration curve or computed from the regression equation derived using the Beer’s law data.
2.5.2 Analysis of tablets
Twenty tablets from each brand (Suminat-25 and Suminat-50) were weighed and crushed into a fine powder using a Pestle and Mortar. An amount of tablet powder equivalent to 10 mg of STS was transferred into a 100 ml volumetric flask. The content was shaken well with about 50 ml of the respective solvent (0.1 M HCl in method A; acetonitrile in method B) for 20 min. The mixture was diluted to the mark with the same solvent. It was filtered using Whatman No 42 filter paper. First 10 ml portion of the filtrate was discarded and a subsequent portion was diluted to get a working concentration of 10 μg ml−1 and subjected to analysis following the procedures described earlier.
2.5.3 Procedure for the analysis of placebo blank and synthetic mixture
A placebo blank containing starch (10 mg), acacia (15 mg), hydroxyl cellulose (10 mg), sodium citrate (10 mg), talc (20 mg), magnesium stearate (15 mg) and sodium alginate (10 mg) was prepared by combining all components to form a homogeneous mixture. A 10 mg of the placebo blank was accurately weighed and its solution was prepared as described under ‘tablets’, and then subjected to analysis by following the general procedure.
A synthetic mixture was prepared by adding an accurately weighed 10 mg of STS to 10 mg of placebo mentioned above. The extraction procedure for tablets was applied by taking required quantity of synthetic mixture to prepare 10 μg ml−1 STS solutions. Three different volumes of the resulting synthetic mixture solution (equivalent 1, 3 and 5 μg ml−1 STS in both the methods) were subjected to analysis by following the respective general procedure.
2.5.4 Forced degradation study
A 4 ml aliquot of the standard 10 μg ml−1 STS was taken (in triplicate) in a 10 ml volumetric flask and mixed with 5 ml of 1 M HCl (acid hydrolysis) or 1 M NaOH (alkaline hydrolysis) or 5% H2O2 (oxidative degradation) and boiled for 2 h at 80 °C on a hot water bath. The solution was cooled to room temperature and diluted to the mark with either 0.1 M HCl (method A) or acetonitrile (method B). In thermal degradation, solid drug was kept in Petri dish in an oven at 100 °C for 24 h. After cooling to room temperature, 10 mg of STS was weighed and transferred to a 100 ml volumetric flask, dissolved in and diluted up to the mark with the respective solvent. For UV degradation study, suitable aliquot of the stock solution (4 μg ml−1) was exposed to UV radiation of 1.4 flux intensity for 48 h in a UV chamber at a wavelength of 226 nm in method A and 228 nm in method B. Finally, the absorbance of all the resulting solutions (4 μg ml−1 in STS) obtained from acid and alkaline hydrolysis, oxidative degradation, thermal and UV degradation of STS, was measured at 226 and 228 nm in methods A and B, respectively, against the respective solvent as blank in each case.
3 Results and discussion
3.1 Spectral characteristics
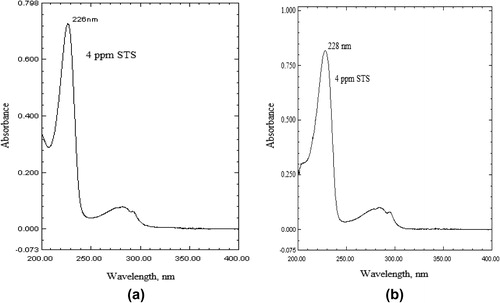
The STS solution in 0.1 M HCl (method A) and acetonitrile (method B) showed absorption maximum at 226 and 228 nm, respectively. At these wavelengths 0.1 M HCl or acetonitrile had insignificant absorbance. Therefore, further investigation for the analysis of STS was carried out at 226 nm (method A) and 228 nm (method B). represents the absorption spectra of STS in 01 M HCl (method A) and acetonitrile (method B) along with their respective blanks.
Figure 2 Absorption spectra of STS in 0.1 M HCl (method A) and in acetonitrile (method B).
3.2 Method validation
3.2.1 Linearity, sensitivity, limits of detection and quantification
A linear correlation was found between absorbance at λmax and concentration of STS. The graphs are described by the regression equation: Y = a + bX (where Y = absorbance of drug solution; a = intercept; b = slope and X = concentration of drug in μg ml−1). The slope (b), intercept (a) and correlation coefficient (r) for each system were evaluated by using the method of least squares Optical characteristics such as Beer’s law limits, molar absorptivity and Sandell sensitivity values (ICH-Q1A (R2), Citation2003) of both the methods are calculated. The limit of detection (LOD) and limit of quantitation (LOQ) are also calculated and all these data are presented in . High values of molar absorptivity (ε), low values of Sandell sensitivity and LOD revealed that, the proposed methods are highly sensitive.
Table 2 Regression and analytical parameters.
3.2.2 Precision and accuracy
To check the repeatability and system suitability of the proposed methods, the assays described under “general procedures” were repeated seven times within the day (intra-day precision) and five times on five different days (inter-day precision). These assays were performed for three levels of analyte. The percentage relative standard deviation (%RSD) values were ⩽1.35% (intra-day) and ⩽1.58% (inter-day) indicating high precision of the methods. The accuracy of the methods was evaluated as percentage relative error (RE) between the measured mean concentrations and taken concentrations for STS. Percent relative error (% RE) values of ⩽2.62% demonstrate the high accuracy of the proposed methods. The results of this study are summarized in .
Table 3 Evaluation of intra-day and inter-day precision and accuracy.
3.2.3 Selectivity
In the analysis of placebo blank, the absorbance value was nearly the same as that for solvent in both the methods, suggesting the non-interference by the inactive ingredients added to prepare the placebo.
The effect of matrix in the assay of STS was checked using a synthetic mixture. A 0.5 ml aliquot of the resulting STS extract prepared by using synthetic mixture was assayed by following the general procedure (n = 3), and yielded percentage recovery values of 98.45–103.5 of STS (). These results pronounced the non-interference from the matrix added to prepare synthetic mixture.
Table 4 Results of analysis of synthetic mixture by the proposed methods.
3.2.4 Ruggedness and robustness
The robustness of the methods was evaluated by measuring the absorbance at different wavelengths whereas the method ruggedness was performed by four different analysts and also using three different cuvettes by a single analyst. Intermediate precision values (% RSD) were in the range of 0.85–1.83% indicating acceptable ruggedness. These results are presented in .
Table 5 Robustness and ruggedness.
3.2.5 Application to tablet analysis
Commercial STS tablets were analyzed using developed methods and also by an official method (The United States Pharmacopoeia, Citation2004). The official method describes chromatographic detection of STS using UV-detector at 282 nm. The results obtained were compared statistically by Student’s t-test and the variance-ratio F-test (ICH-Q1A (R1), Citation2005). The calculated t- and F- values did not exceed the tabulated values of 2.77 (t) and 6.39 (F) at the 95% confidence level and for four degrees of freedom (), indicating close similarity between the proposed methods and the reference method with respect to accuracy and precision.
Table 6 Results of analysis of tablets by the proposed methods.
3.2.6 Recovery study
To further ascertain the accuracy and reliability of the proposed methods, recovery experiments were performed via standard-addition procedure. Pre-analyzed tablet powder was spiked with pure STS at three different levels and the total was found by the proposed methods. Each determination was repeated three times. The percent recovery of pure STS added was within the permissible limits indicating the absence of inactive ingredients in the assay. These results are as illustrated in .
Table 7 Results of recovery study by standard addition method.
3.2.7 Stability indicating property
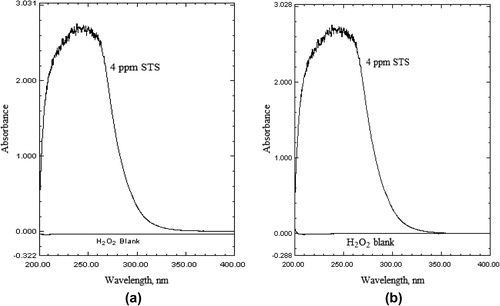
The stress studies of the drug were carried out by subjecting STS to acid and alkali hydrolysis, dry heat treatment, UV-degradation and hydrogen peroxide oxidation and later absorption spectra were recorded. The comparison of the UV spectra of “stressed STS samples” with that of the “standard STS solution” () showed that STS does not undergo degradation under acidic condition (). Similarly, STS does not show any degradation under dry heat treatment and when exposed to the UV radiation (). But, both the absorption spectra of STS solutions in 0.1 M HCl and acetonitrile treated with 1 M NaOH () or hydrogen peroxide showed that STS undergoes a significant degradation ().
Figure 3 Acidic degradation. (a) (method A), (b) (method B).
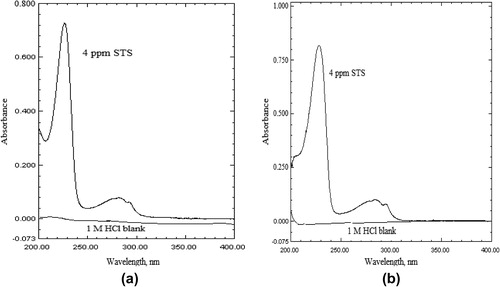
Figure 4 Basic degradation. (a) (method A), (b) (method B).
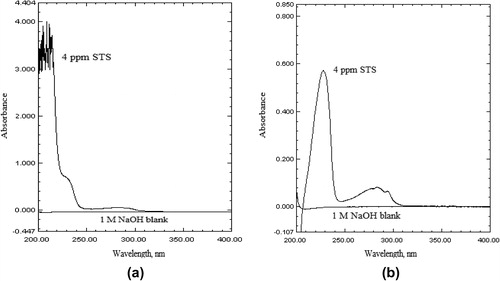
Figure 5 Thermal degradation (a) (method A), (b) (method B) Photo degradation (c) (method A), (d) (method B).
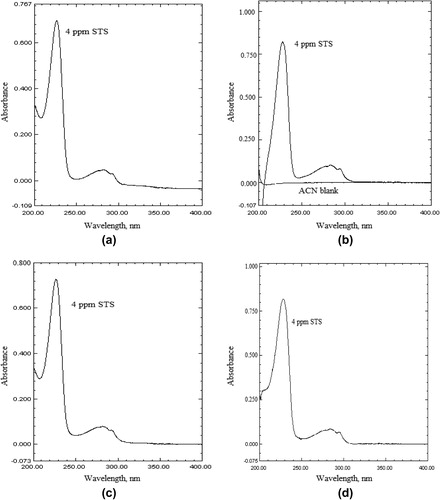
Figure 6 Peroxide degradation (a) (method A), (b) (method B).
4 Conclusions
In this study, the degradation behavior of STS was studied by subjecting the drug to various stress conditions recommended by ICH. The additional findings in this study show that the drug undergoes an extensive degradation under alkaline and oxidative conditions and stable to acidic, photolytic and thermal stress conditions. The methods were validated for parameters like linearity, precision, accuracy, selectivity and ruggedness. Application of these methods for the analysis of STS in tablet dosage forms showed that there was no interference of excipients in the determination. The methods are advantageous over most of the reported methods in-terms of sensitivity, simplicity, cost-effectiveness and experimental conditions. The methods do not involve any tedious procedural steps; do not require any extra reagents or longer analysis time and a very simple instrument is required. This study is a typical example of the development of a stability indicating assay, established following the recommendations of ICH guidelines. The methods can be used to determine the purity of the drug available from various sources and in stability studies.
Notes
Peer review under responsibility of University of Bahrain.
Related Research Data
References
- K.M.Al AzzamB.SaadC.Y.TatI.MatH.Y.Aboul-EneinStability-indicating micellar electrokinetic chromatography method for the analysis of sumatriptan succinate in pharmaceutical formulationsJ. Pharm. Biomed. Anal.562011937943
- K.D.AltriaS.D.FilbeyQuantitative determination of sumatriptan by capillary electrophoresisAnal. Proc.301993363365
- P.D.AndrewH.L.BirchD.A.PhillpotDetermination of sumatriptan succinate in plasma and urine by high-performance liquid chromatography with electrochemical detectionJ. Pharm. Sci.8219937376
- A.B.AvadhanuluJ.S.SrinivasY.AnjaneyuluReverse phase HPLC and colorimetric determination of sumatriptan succinate in its drug formIndian Drugs331996334337
- K.BasavaiahN.RajendraprasadP.J.RameshK.B.VinaySensitive ultraviolet spectrophotometric determination of quetiapine fumarate in pharmaceuticalsThai. J. Pharm. Sci.342010146154
- K.BasavaiahN.RajendraprasadM.X.CijoK.B.VinayP.J.RameshDevelopment and validation of stability indicating spectrophotometric methods for determination of oxcarbazepine in pharmaceuticalsJ. Sci. Ind. Res.702011346351
- British Pharmacopoeia1964Her Majesty’s Stationary OfficeLondon
- K.N.ChengM.J.RedrupA.BarrowP.N.WilliamsValidation of a liquid chromatographic tandem mass spectrometric method for the determination of sumatriptan in human biological fluidsJ. Pharm. Biomed. Anal.171998399408
- European Pharmacopoeia, 2005. European Department for the Quality of Medicines, fifth ed., vol. II. Council of Europe, Stranbourg, France. pp. 2522.
- A.FathimaS.RaoG.VenkateshwarluQuantitative determination of drugs & pharmaceuticals using p-chloranilic acid as reagentInt. J. Chem. Technol. Res.420127991
- M.FranklinJ.OdontiadisE.M.ClementDetermination of sumatriptan succinate in human plasma by high-performance liquid chromatography with coulometric detection and utilization of solid-phase extractionJ. Chromatogr. B6811996416420
- Z.GeE.TessierL.NeirinckZ.ZhuHigh performance liquid chromatographic method for the determination of sumatriptan with fluorescence detection in human plasmaChromat. B, Analyt. Technol. Biomed. Life Sci.8062004299303
- R.P.GondaliaA.P.DharamsiSpectrophotometric simultaneous estimation of sumatriptan succinate and naproxen sodium in tablet dosage formsAsian J. Pharm. Clin. Res.420113132
- F.K.HurtadoD.R.NogueiraF.BortoliniL.M.da SilvaE.ZimmermannM.J.SouzaJ.de MeloC.M.B.RolimDetermination of levofloxacin in a pharmaceutical injectable formulation by using HPLC and UV-spectrophotometric methodsJ. Liq. Chromatogr. Relate. Technol.30200719811989
- ICH-Q1A (R1), November 2005. Validation of analytical procedures: text and methodology, In: International Conference on Harmonisation, Geneva.
- ICH-Q1A (R2), February 2003. Stability testing of new drug substances and products, In: International Conference on Harmonisation, Geneva.
- B.KalyanaramuK.RaghubabuVisible spectrophotometric determination of sumatriptan succinate in tablet dosage forms using folin reagentInt. J. Pharm. Biomed. Sci.120104952
- B.KalyanaramuK.RaghubabuA simple colorimetric determination of sumatriptan succinate from tablet dosage forms using cobalt thiocyanateIJPT3201114111418
- B.KalyanaramuK.RaghubabuA simple visible spectrophotometric determination of sumatriptan succinate from pharmaceutical formulationsDer Pharma Chemica32011223228
- B.KalyanaramuK.RaghubabuIon association method for the determination of sumatriptan succinate from tablet dosage forms using Tropaeolin OOOInt. J. Pharm. Pharm. Sci.32011175178
- B.KalyanaramuK.RaghubabuVisible spectrophotometric methods for the estimation of sumatriptan succinate in bulk and dosage forms, Acta CiencIndica, Chem.372011143147
- A.MandanaP.ZohrehB.AbolfazlS.SaeedElectrocatalytic determination of sumatriptan on the surface of carbon-paste electrode modified with a composite of cobalt/Schiff-base complex and carbon nanotubeBioelectrochemistry8120118185
- D.MoiraA.PeterFully automated assay for the determination of sumatriptan in human serum using solid-phase extraction and high-performance liquid chromatography with electrochemical detectionJ. Pharm. Biomed. Anal.141996721726
- B.NageshS.NareshA.NitinHPLC determination of sumatriptan succinate in pharmaceutical dosage formsEast Pharm.401997121122
- M.R.PourmandM.S.AzarM.AghavalijamaatDevelopment of validated UV spectrophotometric method for in vitro analysis of sumatriptan in pharmaceutical preparations in comparison with HPLCPharm. Chem. J.442011585589
- A.E.PrabaharR.KalaichelviB.ThangabalanR.KarthikeyanCh.PrabhakarP.V.KumarValidated spectroscopic method for estimation of sumatriptan succinate in pure and from tablet formulationRes. J. Pharm. Technol.22009495497
- M.S.RaghuK.BasavaiahP.J.RameshS.A.M.AbdulrahmanK.B.VinayDevelopment and validation of a UV-spectrophotometric method for the determination of pheniramine maleate and its stability studiesJ. Appl. Spectrosc.79201218
- Alan M.RapoportConquering Headachefourth ed.2003Decker DTC HamiltonLondon 57
- Y.R.ReddyK.K.KumarM.R.P.ReddyK.MukkantiRapid simultaneous determination of sumatriptan succinate and naproxen sodium in combined tablets by validated ultra performance liquid chromatographic methodJ. Anal. Bioanal. Tech.2201116
- S.SaeedK.ZahraS.R.SadatGlassy carbon electrode modified with a bilayer of multi-walled carbon nanotube and polypyrrole doped with new coccine: application to the sensitive electrochemical determination of SumatriptanElectrochim Acta5620111003210038
- K.SagarJ.M.F.AlvarezC.HuaM.R.SmythR.MundenDifferential pulse voltammetric determination of sumatriptan succinate (1:1) in a tablet dosage formJ. Pharm. Biomed. Anal.1019921721
- D.S.SagarU.P.PareshN.S.BhanubhaiDevelopment and validation of spectrophotometric method for simultaneous estimation of sumatriptan succinate and naproxen sodium in pharmaceutical dosage formJ. Pharm. Sci. Biosci. Biosci. Res.120115053
- K.V.V.SatyanarayanaP.Nageswara RaoSensitive bromatometric methods for the determination of sumatriptan succinate in pharmaceutical formulationsE-J. Chem.82011269275
- V.A.ShirsatS.Y.GabheS.G.DeshpandeHigh-performance liquid chromatographic determination of sumatriptan succinate from pharmaceutical preparationIndian Drugs351998404407
- S.SukhdevJ.RaviStability indicating HPLC method for the determination of sumatriptan succinate in pharmaceutical preparations and its application in dissolution rate studiesIndian Drugs341997527531
- The United States Pharmacopoeia, 2004. 12th ed., USP convention. INC, Twinbrook, 2709.
- D.N.TipreP.R.VaviaDetermination of sumatriptan succinate in pharmaceutical dosage form by spectrophotometric and HPTLC methodIndian Drugs361999501505
- M.TrinathS.K.BanerjeeH.H.D.TejaC.G.BondeDevelopment and validation of spectrophotometric method for simultaneous estimation of sumatriptan and naproxen sodium in tablet dosage formDer Pharmacia Sinica120103641
- M.I.WalashA.El-BrashyN.El-EnanyM.E.KamelSpectrofluorimetric and spectrophotometric determination of rosiglitazone maleate in pharmaceutical preparations and biological fluidsPharm. Chem. J.432009697709
- X.XiaohuiM.G.BartlettJ.T.StewartDetermination of degradation products of sumatriptan succinate using LC–MS and LC–MS–MSJ. Pharm. Biomed. Anal.262001367377