
Abstract
This study describes the digestive enzyme profiles from foregut contents of the blue swimming crab, Portunus pelagicus (L.), from Straits of Johor, Malaysia. Adult male (mature and immature) and female (ovarian maturation stages 1–4) blue swimming crabs were assayed for the presence of digestive enzymes (protease, trypsin, amylase and lipase) in the foregut. The results show that in some instances, significant differences in enzyme activities were observed between the sexes of P. pelagicus. Protease, trypsin, and amylase were detected in all gonad maturation stages, suggesting that crabs including immature males can readily digest dietary protein and carbohydrates, but not lipids. Trypsin (except for ovarian maturation Stage 4) and lipase (ovarian maturation Stage 4 and mature male only) activities were considerably higher than amylase, indicating that dietary proteins and lipids are more important than carbohydrates and, thus, suggests a carnivorous diet. In conclusion, the changes in enzyme activities between the different maturation stages and sexes reflect natural changes in diet and feeding abilities of P. pelagicus.
1 Introduction
The broodstock of blue swimming crab, Portunus pelagicus, are hunted extensively in their natural habitat; thus, it is important to develop and maintain a hatchery broodstock to obtain berried females for larval supply. Crab fishery and culture operations are expected to continue to grow in the future (CitationIkhwanuddin et al., 2012). The limited scientific knowledge of P. pelagicus digestive processes, however, is recognized as a major constraint to the future growth of this species. Live crabs are exported to Southeast Asian countries (CitationSugumar et al., 2013), and have been considered as one of the more valuable and commercially important commodities across many countries (Abol-Munafi et al., Citation2016; Azra and Ikhwanuddin, Citation2015). Future development of the P. pelagicus industry will require an understanding of the key nutrient requirements of this species and the digestive strategies employed to access the appropriate nutrients for broodstock maintenance. The digestive potential of an organism not only relies on its diet but also on its innate capacity to absorb such a diet with certain enzymes. A literature review revealed only a few of research on the digestive physiology of the brachyuran crab (Cui et al., Citation2016; Shentu et al., Citation2015), but that their dietary composition is well documented. For example, the dietary nutrition of portunid crabs has been studied in P. pelagicus (Ikhwanuddin et al., Citation2014; deLestang et al., Citation2000), sentinel crab, Podopthalmus vigil (CitationSudhakar et al., 2011), ornate blue crab, Callinectus ornatus (CitationMantelatto and Christofoletti, 2001), sand crab, P. segnis (CitationPazooki et al., 2012) and mud crab, genus Scylla (Azra and Ikhwanuddin, Citation2016; Viswanathan and Raffi, Citation2015). This study was designed to determine the digestive enzyme profiles of the P. pelagicus foregut as well as differences between sexes. The results from this study will provide information on the suitable diet for improving broodstock health and growth of this crab in aquaculture systems.
2 Materials and methods
2.1 Sampling site, crab morphometrics and sexes
Sixteen samples of P. pelagicus were collected from fishing at the Jetty Pendas at Gelang Patah, Straits of Johor coastal waters of Malaysia. Collections were standardized by only taking the adults of females, but taking immature and mature P. pelagicus for males. Before dissection, crabs were identified for sex (differentiation between males and females was determined based on CitationLai et al., 2010) and gonad maturation stage based on CitationRavi et al. (2013) and CitationSafaie et al. (2013). The ovary of the crab in stage 1 was very thin and transparent, and ovaries changed color to creamy upon reaching stage 2. Ovarian maturation stage 3 was characterized by enlarged ovaries with a color change to yellow, and turned to orange or reddish orange upon reaching stage 4. Samples of foregut were used for enzyme analysis to determine their natural diet. The carapace width and weight of crab samples were measured and recorded along with gonad maturation stages.
2.2 Enzyme bioassay
In this study, four main types of enzymes were studied, including protease, trypsin, amylase and lipase. All enzyme analyses and protein determination were conducted using BioVision Kits.
2.3 Enzyme preparation
2.3.1 Amylase
A total of 100 mg foregut tissue of P. pelagicus was extracted with 0.5 ml Assay Buffer and homogenized. Extracts then were centrifuged at 16,000g for 10 min using a microcentrifuge. Samples and enzyme materials were stocked at −20 °C until use. An Amylase Positive Control was dissolved into 50 μl Assay Buffer and stored at −20 °C, and 5 μl Amylase Positive Control was added to three wells and the volume adjusted to 50 μl with distilled water.
2.3.2 Lipase
A total of 40 mg foregut tissue of P. pelagicus was homogenized with 4 volumes of Assay Buffer. Extracts were then centrifuged at 13,000g for 10 min to remove insoluble materials. Following centrifugation, the supernatant was directly diluted in Assay Buffer. Samples and enzyme materials were stored at −20 °C until use.
2.3.3 Trypsin
A total of 100 mg foregut tissue of P. pelagicus was extracted with 4 volumes of Trypsin Assay Buffer and homogenized. Samples were then centrifuged in a microcentrifuge at 14,000g for 10 min to obtain a clear extract. Samples and enzyme materials were stored at −20 °C until use. Aliquots of 5 μl of supernatant were transferred into wells and Assay Buffer was added to adjust the volume 50 μl/well.
2.3.4 Protease
A total of 40 mg foregut tissue of P. pelagicus was homogenized with 4 volumes of Assay Buffer and centrifuged for 10 min at 16,000g to remove insoluble material and obtain a clear extract. Samples and enzyme materials were stored at −20 °C until use. Aliquots of 5 μl of serum were transferred into wells, and the volume was adjusted to 50 μl/well by the addition of Assay Buffer.
2.4 Enzyme assay
2.4.1 Amylase
The Amylase Activity Colorimetric Assay Kit (Catalog No.: K711-100) was used with ethylidene-pNP-G7 as the substrate. This substrate has been specifically cleaved by α-amylase, and the smaller fragments produced can be acted upon by α-glucosidase, which causes the release of chromospheres that can then be measured at 405 nm. A nitrophenol standard curve was prepared using several volumes of nitrophenol standard mix added to wells. 0, 2, 4, 6, 8, and 10 μl of 2 mM nitrophenol standard mix were added into a 96-well plate in duplicate to generate 0, 4, 8, 12, 16 and 20 nmol/well nitrophenol standards. For each well, distilled water was added to make a total volume of 50 μl. For reaction mixtures, 50 μl Assay Buffer and 50 μl Substrate Mix were added together to make 100 μl of reaction mix. 100 μl of the reaction mix was added to each well that contains samples and mixed, along with standards and positive control. The reaction was measured immediately to obtain ODT0 (T0 signifies time zero). The reaction system was incubated at 25 °C for 10 min, and absorbance was read at 405 nm. The enzyme activity calculation was based on the nitrophenol standard curve and the Eq. (1);(1) where B is the amount of nitrophenol from the Standard Curve obtained from obtained from ΔOD (ΔOD = ODT1–ODT0) (in nmol) with T is the time between T0 and T1 (in min) and V is the pretreated sample volume added to the reaction well (in ml). The final unit should be in:
.
2.4.2 Lipase
The Lipase Activity Colorimetric Assay Kit (Catalog No.: K722-100) was used, in which lipase hydrolyzes the triglyceride substrate. This substrate formed glycerol, which is quantified enzymatically by monitoring a linked change in the OxiRed probe absorbance that can then be measured at 570 nm. The Enzyme Mix was dissolved in 220 μl Assay Buffer and then vortexed. The lipase substrate was re-dissolved before use in a hot water bath (80–100 °C) for 1 min until the substrate appeared cloudy and was then vortexed for 30 s. The same step was repeated until the substrate appeared clear and not cloudy. Next, the lipase positive control was dissolved in 100 μl Assay Buffer. 1, 3 and 5 μl positive control was added to series of wells and the volume was adjusted to 50 μl/well with Assay Buffer. For standard curve preparation, 10 μl of the glycerol standard was added to 990 μl of Assay Buffer and mixed, which generated 1 mM glycerol. Then, 0, 2, 4, 6, 8 and 10 μl were added to a series of wells, and the volumes were adjusted to 50 μl/well with Assay Buffer. The generated 0, 2, 4, 6, 8 and 10 nmol/well aliquots of glycerol standard. Additionally, 5 μl of each sample was added into a series of wells, and the volumes were adjusted with Assay Buffer to 50 μl/well in a 96-well plate. Each sample was duplicated with its own control. Next, the reaction mix preparation where for each well, a total 100 μl reaction mix was needed. Reaction mixtures were prepared for two replicates (sample and control). The reaction mixture for the sample consisted of 93 μl Assay Buffer, 2 μl OxiRed Probe, 2 μl Enzyme Mix and 3 μl Lipase Substrate. All solutions were mixed well. Meanwhile, for the control, 96 μl Assay Buffer, 2 μl OxiRed Probe and 2 μl Enzyme Mix were mixed. Both reaction mixes were prepared in sufficient quantities for the number of assays performed. 100 μl of the sample reaction mix was added to each well containing glycerol standards, lipase positive controls and test samples. 100 μl Control Reaction Mix was added to each well containing sample controls. The 96-well plate was measured using a micro-plate reader OD at G1 and read as A1. For every 10 min after that, G2, a reading was taken, A2, for two hours. During this time, the reaction was incubated at 37 °C and protected from light. The OD generated by oxidation of glycerol is ΔA = A2–A1. Sample values were subtracted with control values to avoid glycerol in the sample. The glycerol standard curve was plotted and ΔA 570 nm was applied to the glycerol standard curve to obtain E nmol of glycerol (glycerol amount generated between G1 and G2 in the reaction wells). The lipase activity was calculated with the below Eq. (2);(2) where E is the glycerol amount from the standard curve (in nmol), G1 is the time of the first reading (A1) (in min), G2 is the time of the second reading (A2) (in min) and V is the pretreated sample volume added into the reaction well (in ml). The final unit should be in:
.
2.4.3 Trypsin
The Trypsin Activity Colorimetric Assay Kit (Catalog No.:K771-100) was used wherein trypsin cleaves the substrate. The substrate was used to generate p-nitroaniline (p-NA), which can be measured at 405 nm. The positive control was dissolved with 100 μl Assay Buffer. It was pipetted up and down until it completely dissolved and then aliquoted. For standard curve preparations, 0, 2, 4, 6, 8 and 10 μl ρ-NA standard were added to a series of standard wells. The volume was adjusted to 50 μl/well with Trypsin Assay Buffer to generate 0, 4, 8, 12, 16, and 20 nmol/well standards. Test sample were divided into two one for trypsin and another for chymotrypsin. For the sample, 1 μl of chymotrypsin inhibitor (TPCK) solutions were added to each sample and incubated for 10 min at room temperature. The other test sample was set as a trypsin inhibitor sample group and as a control where 1 μl of trypsin inhibitor (TLCK) solution was added to the trypsin inhibitor sample control and was incubated for 5 min. For the positive control, 5 μl positive control solution was added to wells and the volume adjusted to 50 μl/well with Assay Buffer. A 50 μl reaction mixture was prepared containing 48 μl Assay Buffer and 2 μl Trypsin Substrate, which was mixed well before adding to each well containing the ρ-NA standards, positive controls, test samples and test samples trypsin inhibitor controls. The plate was then incubated at 25 °C and protected from light. The test plate was measured initially with absorbance at time J1 (A1 and A1C for trypsin inhibitor control). The reaction was incubated for 2 h, and a reading was taken every 10 min at J2 (H2 and H2C). The color generated by cleavage of the substrate was ΔA = (H2 − H2C)–(H1 − H1C). For this calculation, the 0 (blank) standards were subtracted from all readings. The ρ-NH standard curve was then plotted. The calculation ΔH = (H2 − H2C)–(H1 − H1C) was applied to the standard curve to obtain nmol of ρ-NH (amount generated between J1 and J2 in the reaction wells). Trypsin activity was calculated using the below Eq. (3).(3) where F is the ρ-NA calculated from the Standard Curve (in nmol), J1 and J2 are the times of the first and second readings (in min) and V is the pretreated sample volume added into the reaction well (in ml). The final unit should be in:
.
2.4.4 Protease
The Protease Activity Fluorometric Assay Kit (Catalog No.:K781-100) was used for protease analysis, which used fluorescein isothiocyanate (FITC) and casein as a protease substrate. Casein is cleaved into smaller peptides which abolishes its quenching of the fluorescence label. The fluorescence label can be measured at 485/530 nm. The substrate was first reconstituted with 220 μl distilled water. It was pipetted up and down to completely dissolve. Meanwhile, the positive control was reconstituted with 100 μl Assay Buffer and pipetted up and down. Next, standard curve preparations of 0, 2, 4, 6, 8, and 10 μl FITC Standard were added to a series of standard wells and the volume adjusted to 100 μl/well with Assay Buffer to obtain 0, 0.05, 0.1, 0.15, 0.2 and 0.25 nmol/well of the FITC Standard. 1, 3 and 5 μl of positive control solution was added to wells and volumes were adjusted to 50 μl/well with assay buffer. A reaction mix was prepared by mixing 48 μl assay buffer with a 2 μl substrate for each well. The reaction mix was added to each well containing positive control, reagent background control and test samples. Absorbance was read as R1 at K1 and then at K2 as R2 after the reaction was incubated at 25 °C for 2 h in the dark, with a reading taken every 10 min. The fluorescence of the unquenched FITC generated by proteolytic digestion of the substrate was ΔRFU = R2–R1. The 0 Standard was subtracted from all Standard readings. ΔRFU was applied to the FITC Standard Curve to obtain Z nmol of FITC (amount of unquenched FITC generated between K1 and K2 in the reaction wells). Protease activity was calculated using the following Eq. (4):(4) where Z is the FITC amount from the FITC Standard Curve (in nmol), K1 and K2 are the times of the first (R1) and second readings (R2) (in min) and V is the pretreated sample volume added into the reaction well (in ml). The final unit should be in:
.
2.5 Protein quantization
The method for Protein Quantization was based on the Coomassie blue G reagent, which forms a blue complex in the presence of protein, and can be measured at 595 nm.
2.6 Statistical analysis
Statistical analysis was performed after the enzyme analysis was complete. In this study, two types of statistical analysis were performed, including a normality test and t-test using ANOVA (SPSS Version 20.0). A normality test was conducted to determine whether enzyme activities were normal to allow for the other statistical test. A t-test was performed to identify the significant differences in activities of enzymes between sexes.
3 Results
3.1 Enzyme activity
3.1.1 Amylase activity
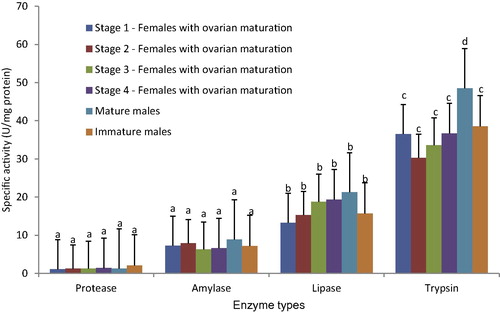
From , amylase activity is highest in mature male (MM) with an amount of 8.89 U/mg protein. The second highest is in females at ovarian maturation Stage 2 (S2) with an amylase activity of 7.86 U/mg protein, followed by females at ovarian maturation Stage 1 (S1) with an amylase activity 7.25 U/mg protein. Next greatest was immature male (IM) at 7.20 U/mg protein and then females at ovarian maturation Stage 4 (S4) with 6.57 U/mg protein. The lowest amylase activity was in females at ovarian maturation Stage 3 (S3), with a value of 6.25 U/mg protein.
Figure 1 Enzymes activity of four different enzymes types (protease, amylase, lipase and trypsin) for each gonad maturation stage of Portunus pelagicus females and males. ∗ Different superscript letters show a significant difference between enzymes types (p < 0.05).
3.1.2 Lipase activity
From , all gonad stages exhibited positive results. Mature male (MM) stages showed the highest values for lipase activity (21.25 U/mg protein). S1 had the lowest lipase activity at 13.26 U/mg protein, while S2 had a lipase value of 15.25 U/mg protein. Others lipase activity levels were S3 at 18.76 U/mg protein, S4 at 19.33 U/mg protein, and IM at 15.65 U/mg protein.
3.1.3 Trypsin activity
MM showed the highest trypsin activity at 48.52 U/mg protein, followed by S4 at 36.68 U/mg protein. As shown in , S2 and S3 had similar trypsin activities of 30.25 to 33.58 U/mg protein, respectively. S1 had the lowest trypsin activity with 36.54 U/mg protein and IM was measured at 38.52 U/mg protein. Significant differences were found for trypsin activity between mature males and females at ovarian stages 1 to 4.
3.1.4 Protease activity
From , the highest value for protease activity was obtained in IM at 2.06 U/mg protein. Ovarian maturation stages 1 to 3 showed similar protease activity, ranging from 1.12 to 1.25 U/mg protein. However, protease values increased with the increase of the ovarian stage at S4 to 1.38 U/mg protein. Mature males showed lower values of protease activity than S4 females at 1.28 U/mg protein.
3.2 Enzymes activity comparison
The normality test indicated that the results followed a normal distribution. Thus, a t-test was conducted to test for significant differences between the stages and the four enzymes (amylase, lipase, trypsin and protease). The results show that amylase activity, protease activity and lipase activity had no significant differences (P > 0.05), while trypsin activity showed significant differences (P < 0.05). Amylase and protease activity was not significantly different between each ovarian maturation stage, while lipase and trypsin showed significant differences between each of the ovarian maturation stages.
4 Discussion
High proteolytic activity reflects a diet high in protein, while high carbohydrase activity reflects a diet high in starch or cellulose and a high lipase activity reflects a diet high in fat (Johnston and Yellowlees, Citation1998; Johnston, Citation2003). Protease, trypsin, and amylase were detected in all maturation stages, suggesting that crabs including immature males can readily digest dietary protein, carbohydrate, but not lipids. Trypsin (except S4) and lipase (S4 and MM only) activities were considerably higher than amylase, indicating that dietary proteins and lipids are more important than carbohydrates and thus suggests a carnivorous diet. Amylase activity shows no significant differences (P < 0.05) between stages of P. pelagicus. MM had the highest amylase activity, but the range of amylase activity for S2 and IM is not significantly different than MM. Amylase and free carbohydrates in the form of glucose play a major role in energy metabolism (CitationJohnston et al., 2004). It has a rapid turnover, so its content is low compared to proteins and lipids, and typically constitutes less than 5% of body mass (CitationAnger, 2001). This is supported by the amylase activities for all stages studied being low. Amylase activity in P. pelagicus likely reflects digestion of glycogen in animal prey that they consumed. High lipase activity in S4 and MM suggests that lipids are also one of the most important nutritional components in their diet. CitationLe Vay et al. (2001) stated that pelagic zooplankton generally have high protein and lipid and low carbohydrate content, so they may constitute one of the dietary items consumed by P. pelagicus and may be included as an unidentified item category. Another explanation is that crabs were starved before sampling. The high trypsin activities of P. pelagicus, especially in males, indicates that they are carnivorous in nature (CitationJohnston and Freeman, 2005). However, they are likely omnivores as they also consume plants (CitationZainal, 2013). CitationJones et al. (1997) found that high protease and trypsin activity has been observed in some crustacean species that consume a low protein diet and is thought to occur to maximize assimilation efficiency of the rare metabolic substrate. However, a study conducted by CitationJohnston and Freeman (2005) comparing the digestive enzyme activities of a number of species of crabs occupying different dietary niches showed that although one herbivorous species did display high protease activity, in general protease activity increased in proportion to the importance of protein in the diet (CitationJohnston and Freeman, 2005). Therefore, protein itself is important, and P. pelagicus likely consumed it for their diet.
Females at ovary stage S4 have high protease activity, likely due to a physiological adaptation to maximize digestion of small amounts of protein from large volumes of ingested plankton (CitationJohnston and Freeman, 2005). From previous studies on the digestive enzymes of crustacean larvae, it has been suggested that the reason for higher protease activities is due to the consumption of phytoplankton as opposed to carnivorous larvae. High protease activity may enable these species to rapidly extract the relatively small protein component from large volumes of food, so there is a net energy gain despite relatively low overall assimilation efficiency (Kumlu and Jones, Citation1997; Le Vay et al., Citation2001). The plankton that P. pelagicus consumed may include zooplankton. Even though it is not identified in the foregut it may be included as unidentified items because zooplankton are quite small and easy to digest. From these results, all maturation stages of male and female P. pelagicus showed digestive enzyme activity for amylase, lipase, trypsin and protease. High proteolytic activity reflects a diet high in protein as shown by mature males (MM). Meanwhile, carbohydrase activity reflects a diet with starch or cellulose that is consumed by all maturation stages but at a lower rate. And high lipase activity reflects a diet high in fat as shown by females at ovarian maturation Stage 4. Overall, amylase and protease activity show no significant differences between all maturation stages, but there is a significant difference between maturation stages for lipase and trypsin activity. The changes in enzyme activities between maturation stages and sexes reflect changes in the natural diet and feeding abilities of P. pelagicus.
Acknowledgements
This study was supported by a research grant from the Malaysian Ministry of Education under the Niche Research Grant Scheme (NRGS, 2013–2018) – Improving the Health of Setiu Wetlands Ecosystem and Productivity of Crustacean Resources for Livelihood Enhancement (Vote No. 53131) to MI. We would like to thank two anonymous reviewers for their constructive criticism. The authors wish to thank all of the staff at the Institute of Tropical Aquaculture and School of Marine Science and Environment, University Malaysia Terengganu, for technical assistance throughout this research.
Notes
Peer review under responsibility of University of Bahrain.
Related Research Data
References
- A.B.Abol-MunafiM.S.MukrimR.M.AminM.N.AzraG.AzmieM.IkhwanuddinHistological profile and fatty acid composition in hepatopancreas of blue swimming crab, Portunus pelagicus (Linnaeus, 1758) at different ovarian maturation stagesTurk. J. Fish. Aquat. Sci.16201625125810.4194/1303-2712-v16_2_04
- K.AngerThe Biology of Decapod Crustacean Larvae2001CRC PressFlorida, United State Crustacean Issues, ISBN: 9026518285
- M.N.AzraM.IkhwanuddinLarval culture and rearing techniques of commercially important crab, Portunus pelagicus (Linnaeus, 1758): present status and future prospectsSongklanakarin J. Sci. Technol.372015135145http://rdo.psu.ac.th/sjstweb/journal/37-2/37-2-4.pdf
- M.N.AzraM.IkhwanuddinA review of maturation diets for mud crab genus Scylla broodstock: present research, problems and future perspectiveSaudi J. Biol. Sci.23201625726710.1016/j.sjbs.2015.03.011
- Cui, Y., Ma, Q., Limbu, S.M., Du, Z., Zhang, N., Li, E., Chen, L., 2016. Effects of dietary protein to energy ratios on growth, body composition and digestive enzyme activities in Chinese mitten-handed crab, Eriocheir sinensis. Aquacult Res. http://dx.doi.org/10.1111/are.13061.
- S.deLestangM.E.PlatellI.C.PotterDietary composition of the blue swimmer crab Portunus pelagicus L.: does it vary with body size and shell state and between estuaries?J. Exp. Mar. Biol. Ecol.246200024125710.1016/S0022-0981(99)00181-1
- M.IkhwanuddinM.N.AzraY.Y.SungA.B.Abol-MunafiM.L.ShabdinLive foods for juveniles’ production of blue swimming crab, Portunus pelagicus (Linnaeus, 1766)J. Fish. Aquat. Sci.7201226627810.3923/jfas.2012.266.278
- M.IkhwanuddinA.N.LiyanaM.N.AzraZ.BachokA.B.Abol-MunafiNatural diet of blue swimming crab, Portunus pelagicus at Strait of Tebrau, Johor, MalaysiaSains Malaysiana4320143744http://www.ukm.my/jsm/pdf_files/SM-PDF-43-1-2014/05%20M.%20Ikhwanuddin.pdf
- D.J.JohnstonOntogenetic changes in digestive enzymology of the spiny lobster, Jasus edwardsii Hutton (Decapoda, Palinuridae)Mar. Biol.143200310711082http://www.int-res.com/articles/meps2004/275/m275p219.pdf
- D.J.JohnstonD.YellowleesRelationship between dietary preferences and digestive enzyme complement of the slipper lobster Thenus oriental (Decapoda: Scyllaridae)J. Crustacean Biol.181998126135http://www.jstor.org/stable/1549140
- D.JohnstonJ.FreemanDietary preference and digestive enzyme activities as indicators of trophic resource utilization by six species of crabBiol. Bull.20820053646http://www.biolbull.org/content/208/1/36.full.pdf+html
- D.JohnstonA.RitarC.ThomasA.JeffsDigestive enzyme profiles of spiny lobster Jasus edwardsii phyllosoma larvaeMar. Ecol. Prog. Ser.275200421923010.3354/meps275219
- D.A.JonesM.KumluL.Le VayD.J.FletcherThe digestive physiology of herbivorous, omnivorous and carnivorous crustacean larvae: a reviewAquaculture155199728529510.1016/S0044-8486(97)00129-4
- M.KumluD.A.JonesDigestive protease activity in planktonic crustaceans feeding at different trophic levelsJ. Mar. Biol. Assoc. UK77199715916510.1017/S0025315400033841
- J.C.Y.LaiP.K.L.NgP.J.F.DavieA revision of the Portunus pelagicus (Linnaeus, 1758) species complex (Crustacea: Brachurya: Portunidae), with the recognition of four speciesRaffles Bull. Zool.582010199237http://lkcnhm.nus.edu.sg/nus/pdf/PUBLICATION/Raffles%20Bulletin%20of%20Zoology/Past%20Volumes/RBZ%2058(2)/58rbz199-237.pdf
- L.Le VayD.A.JonesA.C.Puello-CruzR.S.SanghaC.NgamphongsaiDigestion in relation to feeding strategies exhibited by crustacean larvaeComp. Biochem. Physiol. A: Physiol.128200162363010.1016/S1095-6433(00)00339-1
- F.L.M.MantelattoR.A.ChristofolettiNatural feeding activity of the crab Callinectes ornatus (Portunidae) in Ubatuba Bay (São Paulo, Brazil): influence of season, sex, size and molt stageMar. Biol.138200158559410.1007/s002270000474
- J.PazookiM.HosseiniA.V.ZadehThe dietary compositions of the blue swimming crab, Portunus segnis (Forskal, 1775) from Persian Gulf, South IranWorld Appl. Sci. J.20201241642210.5829/idosi.wasj.2012.20.03.1969
- R.RaviM.K.ManisseriN.K.SanilOvarian maturation and oogenesis in the blue swimmer crab, Portunus pelagicus (Decapoda: Portunidae)Acta Zool.94201329129910.1111/j.1463-6395.2011.00555.x
- M.SafaieJ.PazookiB.KiabiM.R.ShokriReproductive biology of blue swimming crab, Portunus segnis (Forskal, 1775) in coastal waters of Persian Gulf and Oman Sea, IranIran. J. Fish. Sci.122013430444http://www.jifro.ir/article-1-1000-en.html
- J.ShentuY.XuZ.DingEffects of salinity on survival, feeding behavior and growth of the juvenile swimming crab, Portunus trituberculatus (Miers, 1876)Chin. J. Oceanol. Limnol.33201567968410.1007/s00343-015-4218-3
- M.SudhakarK.RajaG.AnathanP.SampathkaumarCompositional characteristics and nutritional quality of Podopthalmus vigil (Fabricius)Asian J. Biol. Sci.4201116617410.3923/ajbs.2011.166.174
- V.SugumarG.VijayalakshmiK.SaranyaMolt cycle related changes and effect of short term starvation on the biochemical constituents of the blue swimmer crab Portunus pelagicusSaudi J. Biol. Sci.2020139310310.1016/j.sjbs.2012.10.003
- C.ViswanathanS.M.RaffiThe natural diet of the mud crab Scylla olivacea (Herbst, 1896) in Pichavaram mangroves, IndiaSaudi J. Biol. Sci.22201569870510.1016/j.sjbs.2015.08.005
- K.A.Y.ZainalNatural food and feeding of the commercial blue swimmer crab, Portunus pelagicus (Linnaeus, 1758) along the coastal waters in the Kingdom of BahrainJ. Assoc. Arab Univ. Basic Appl. Sci.1320131710.1016/j.jaubas.2012.09.002