
 ?Mathematical formulae have been encoded as MathML and are displayed in this HTML version using MathJax in order to improve their display. Uncheck the box to turn MathJax off. This feature requires Javascript. Click on a formula to zoom.
Abstract
An electrical resistivity survey, down-hole logging and pumping test were conducted in Delta Central District of Nigeria to determine the groundwater potential and aquifer characteristics of the study area. Twenty vertical electrical soundings of the Schlumberger configuration were performed with an ABEM SAS 1000 Terrameter. The geoelectric data obtained were interpreted with partial curve matching and computer iteration using RESIST software. The results showed the presence of four geoelectric layers comprising loamy–sandy topsoil, clay, fine sand and coarse sand. The investigation also revealed the presence of a confined aquifer in the area, with resistivity values of 869.1–8704.1 Ωm, while the depth of the aquifer ranged between 20.2 and 25.4 m. The average values of the groundwater characteristics obtained were 0.026 mS/m for electrical conductivity, 25.75 mg/m3 for total dissolved solids, 0.022 m2/min for transmissivity and 0.000133 for storativity. Comparison of these values with international standards indicated that the water in the aquifer is of good quality and that the yield could withstand heavy pumping. It is therefore recommended that a good water scheme be established to serve the people of the area, including its surrounding towns.
1 Introduction
The need for adequate, good-quality water has increased extensively due to awareness and technology. Thus, many people rely on the exploration and exploitation of groundwater. Exploration for groundwater, which is one of the most valuable natural resources and is vital for the sustenance of life on earth, requires a number of techniques [Citation1–Citation3]. The electrical resistivity method is useful in this regard, as it is an efficient and economical method for determining the presence of groundwater [Citation4]. Geophysicists have also used it to determine the thickness of bedrock, clay aquitards, salt water intrusion, the vertical extent of certain types of soil and the spread of groundwater contamination [Citation5,Citation6].
The electrical resistivity method can be used in a wide range of geophysical investigations, such as exploration for minerals, engineering investigation, geothermal studies, archaeological surveys and geological mapping [Citation5]. The method has been used extensively in Nigeria and other parts of the world to investigate the subsurface. Majumdar and Das [Citation7] used it to estimate the aquifer properties of Sagar Island Region in India, where they observed that the results correlated significantly with borehole data from the area. Sirhan et al. [Citation8] used the method to map electrical resistivity distribution in the Al-Avovb Basin in Palestine, showing the existence of a continuous moderate formation accompanied by an upper clayey layer and a strong correlation with existing wells located in the study area. In Nigeria, the geoelectrical resistivity method has been used to search for potable water and to evaluate formation strata [Citation2,Citation3,Citation9–Citation14].
Vertical electrical sounding (VES) is commonly used in electrical resistivity surveys to determine the vertical variation between the electrical resistivity below the earth's surface and the potential field generated by the current [Citation15,Citation16]. The technique involves inducing an electric current into the ground by means of two implanted electrodes and measuring the difference in potential between two other electrodes, referred to as the potential electrodes. The electric current used is the direct current provided by a dry cell. Therefore, analysis and interpretation of the geoelectric data are on the basis of direct current.
The resistivity computed from the measurement of induced current and the potential difference is referred to as the “apparent resistivity”. This measurement is based on the assumption that the ground is uniform. However, in reality, the resistivity of the earth is determined by inhomogeneous lithology and geological structures. Therefore, a graph of apparent resistivity against current electrode spacing is used to determine vertical variation in formation resistivity. Interpretation of this graph gives the true resistivity and depth of the geoelectric layers and is also used to ascertain the presence or otherwise of groundwater aquifers in the area. The parameters that are known to affect the estimation of groundwater resources include aquifer thickness and the size and degree of interconnection of pore spaces within the aquifer material [Citation4]. These properties affect the ability of an aquifer to store and transmit groundwater [Citation4,Citation17].
In order to guarantee good-quality, and sustainable groundwater, it is important to integrate aquifer parameters determined from downhole loggings and pumping tests. Downhole logging is used to evaluate the character and thickness of the different geological materials penetrated by wells and test holes. Pumping test involves pumping water from a test well at a constant rate and measuring the water depth over a given time [Citation18,Citation19]. The difference between the measured depth and the static water level gives the drawdown values used in estimating transmissivity.
Various pumping methods have been used to estimate aquifer parameters. Rajasekhar et al. [Citation18] applied the Sushil K. Singh method to calculate the parameters of confined aquifers and found that the transmissivity of the Kabul basin in Afghanistan was 94.16 m2/day and the storativity was 0.00258. They reported that the method shows high reliability. Halford et al. [Citation19] determined the reliability of the Jacob method of estimating the transmissivity of various aquifer types by interpreting 628 simulated draw-down records. The results were unambiguous, and the transmissivity estimates varied little among analysts. They reported that the estimates were affected minimally by partial penetration, vertical anisotropy and interpretive technique. Gogoi [Citation20] used the Jacob and Theis methods to evaluate the hydraulic parameters in the district of Cachar, Karimganj and Hailakandi in India. He reported that the aquifer of Barak Valley could yield up to 15 m3/h of groundwater for 6–7 h/day, which could effectively supplement the domestic, agricultural and industrial needs in the area. He commented that the Jacob method has become the most popular for estimating transmissivity because of its simplicity.
The district under consideration in this study is a major economic hot spot in the Niger Delta area of Nigeria, with a population of 1 239 650 in the 2006 national census [Citation21]. The district has no functional scheme for supplying water, and the people of the district have long relied on hand-dug wells, which in most cases are vulnerable to contamination because they are shallow. Those who could afford to drill boreholes have done so without a geophysical survey. The surface water sources available are either far away from habitations or are polluted by various sources. The aim of this study, therefore, was to determine the groundwater potential and aquifer characteristics of the district to serve as a roadmap to providing good-quality, sustainable water to the people. Hydrogeophysical and hydrogeological methods were used to determine the groundwater potential of the area and to evaluate the characteristics of the groundwater aquifer.
2 Materials and methods
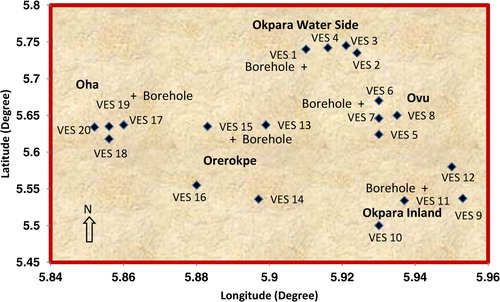
The study was carried out in Delta Central District, Nigeria, at latitude 5.50° and 5.80° N and longitude 5.84° and 5.98° E (). The area is central to most major towns and communities in the district and experiences less oil pollution than most parts of the Niger Delta.
Fig. 1 Map of the study area.

We conducted 20 VESs of the Schlumberger configuration with a maximum current electrode separation of 150 m (). This technique was used because it is considered most appropriate in a sedimentary basin [Citation22] and is simpler and more economical than other geophysical methods [Citation23]. An ABEM SAS 1000 Terrameter was used to obtain the apparent resistivity at each VES point. The data were first interpreted by the conventional partial curve matching technique with two-layer master curves in conjunction with an auxiliary point diagram. This gave an estimate of the layer resistivity and thickness, which were used as input data for computer-assisted interpretation with RESIST software to obtain the true resistivity and thickness of the various layers.
Fig. 2 Locations of vertical electrical sounding (VES) positions.
Ten boreholes (two boreholes per location) were drilled to determine the hydrogeological characteristics of the groundwater aquifer. Two geological loggings, the resistivity log and the spontaneous potential logs, were conducted on the test wells at each location with an SAS 1000 Terrameter and SAS 200 logging probe, which was lowered into the well through a calibrated tape. The data obtained from the two loggings were used to determine the electrical conductivity, from which the total dissolved solids in the groundwater was calculated.
Pumping was carried out with a 0.75 kW pump at a constant rate of 0.218 m3/min at each location. As water was pumped from the test well, the water level in the observation well located 50 m from the test well was monitored for a specific interval. The transmissivity and storativity of the aquifer were determined by the Jacob straight-line method [Citation19,Citation24]. A graph of drawdown (h0 − h) was plotted on an arithmetic scale against time plotted in logarithmic scale [Citation19]. The value of the drawdown per log cycle (Δ(h0 − h)) was determined from the graph and was used to compute the transmissivity and storativity of the subsurface aquifer from Eqs. Equation(1)(1)
(1) and Equation(2)
(2)
(2) [Citation5,Citation19,Citation24].
(1)
(1) and
(2)
(2) where T is transmissivity, S is storativity, Δ(h0 − h) is the drawdown per log cycle of time, Q is the constant pumping rate and t0 is the time since pumping began.
3 Results and discussion
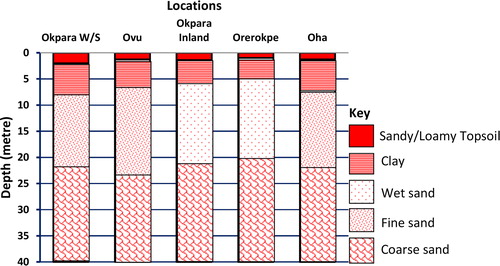
The lithological sections from the five drilled wells are shown in . This shows the presence of four formations, comprising sandy/loamy topsoil, clay, fine sand and coarse sand, with groundwater being sourced from the third and fourth layers. shows the fourth layer to be coarse sand while the third is fine sand, thus the fourth layer is considered more prolific than the third. The geological information therefore serves as a guide in geophysical interpretation.
Fig. 3 Lithologic logs of study area from boreholes.
The field curves of the geoelectric data show the relation between the apparent resistivity and half the current electrode spacing (). The result of the qualitative analysis is presented in , which shows the resistivity and the depth of the various formations.
Table 1 Interpretation of geophysical measurements.
Fig. 4 Vertical electric sounding (VES) curves obtained from the study area.

Four geoelectric layers were found in the study area. The first is made up of loamy/sandy topsoil with a resistivity ranging between 60.5 Ωm in VES 10 and 968 Ωm in VES 4. The thickness of the layer was 0.5–2.0 m. The second geoelectric layer is made up of a clayey (clay, sandy clay and clayey sand) formation, except in VES 4, which is deduced to be compacted sand. This layer constitutes the aquitard for the study area. The resistivity of this layer was 15.7–162 Ωm, and the thickness was 2.4–6.5 m. The third geoelectric layer is a wet sand formation in VES 1, 9, 10, 11, 12, 14, 15, 16 and 20; a fine sand formation in VES 3, 4, 5, 7, 8, 13, 17, 18 and 19; and medium-grain sand in VES 2 and 6. Comparison with the lithological information from the drilled wells implies that this layer is water-bearing in VES 2, 3, 4, 5, 6, 7, 8, 13, 17, 18 and 19. The resistivity of the water-bearing locations was 826.9–2491.9 Ωm. The fourth geoelectric layer is made up of fine sand in VES 1, 7, 8, 9, 11, 13, 16, 17, 18 and 20; medium-grain sand in VES 3, 4, 5, 10, 12 and 19; and coarse sand in VES 2, 6, 14 and 15. The resistivity of this layer was 869.1–8704.0 Ωm, while the depth was 20.2–25.4 m. The fourth geoelectric layer was a confined aquifer at all the VES locations and is the preferred source of potable water for the people in the survey area.
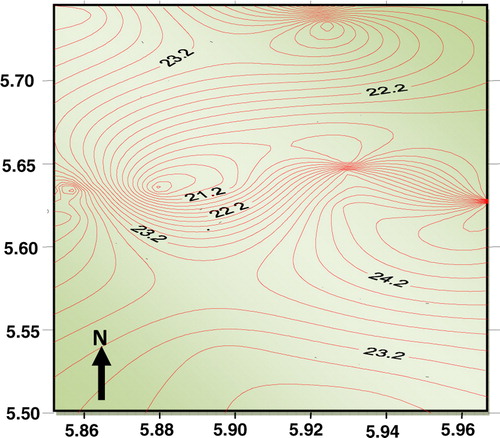
shows the resistivity distribution of the fourth-layer aquifer. The resistivity range is synonymous with those of fine sand, medium-grain sand and coarse sand, which are good sources of groundwater in a sedimentary basin [Citation22]. The depth map for the confined aquifer layer is presented in , which shows the depths to be drilled in order to strike the top of the fourth-layer aquifer. The plot shows that the depths of the aquifer in the various VES locations are closely related and are closely correlated with well records.
Fig. 5 Map of resistivity of the aquifer layer (Ωm).
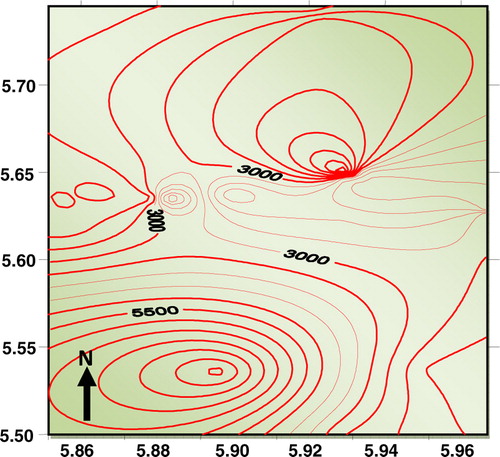
Fig. 6 Map of depth of the aquifer layer (m)
The results of down-hole logging in the drilled wells were used to determine the electrical conductivity from which the total dissolved solids of the groundwater was calculated (). The average electrical conductivity for Okpara Water Side, Ovu, Okpara Inland, Orerokpe and Oha was 0.030, 0.024, 0.025, 0.024 and 0.028 mS/m, respectively, and the average total dissolved solids were 20.09, 15.84, 16.65, 16.41 and 59.75 mg/m3, respectively. These values are below the limits of 250 μS/cm for electrical conductivity and 500 mg/m3 for total dissolved solids recommended by the United State Environmental Protection Agency [Citation5,Citation7,Citation25] and indicate that the quality of the groundwater is high.
Table 2 Results of down-hole logging.
The results of the pumping test and the drawdown are shown in . The data obtained from the pumping test in all locations were plotted as drawdown versus time on a semi logarithmic graph. The drawdown value, Δ(h0 − h), between the log cycles of time for each location was evaluated and the transmissivity calculated with Jacob's equation (Eq. Equation(1)(1)
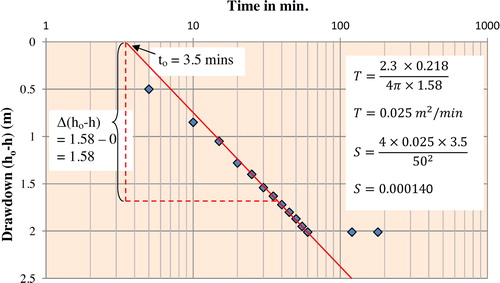
(1) ) (–). The transmissivity values obtained for Okpara Water Side, Ovu, Okpara Inland, Orerokpe and Oha were 0.024, 0.025, 0.020, 0.016 and 0.025 m2/min, respectively, giving an average transmissivity of 0.022 m2/min for the study area. The storativity for these sites from Eq. Equation(2)
(2)
(2) was 0.000115, 0.000136, 0.000144, 0.000128 and 0.000140, respectively, giving an average storativity of 0.000133 for the area. Todd [Citation16] and Rajasekhar et al. [Citation18] reported that the storativity of most confined aquifers falls in the range 0.005–0.00005. Hence, the average value obtained for the storativity is within the limit for a confined aquifer [Citation16,Citation18,Citation23]. The values for transmissivity and storativity show that the aquifer is high yielding. It could therefore provide enough water for the people of the area and could withstand heavy pumping.
Table 3 Results of pumping tests.
Fig. 7 Plot of drawdown versus time for Okpara Water Side.
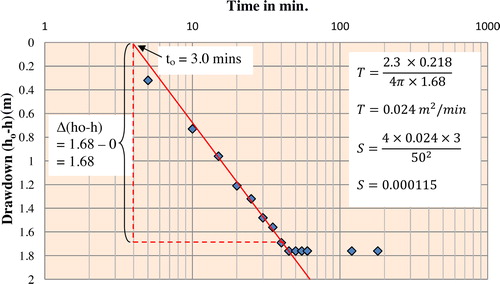
Fig. 8 Plot of drawdown versus time for Ovu.

Fig. 9 Plot of drawdown versus time for Okpara Inland.

Fig. 10 Plot of drawdown versus time for Orerokpe.
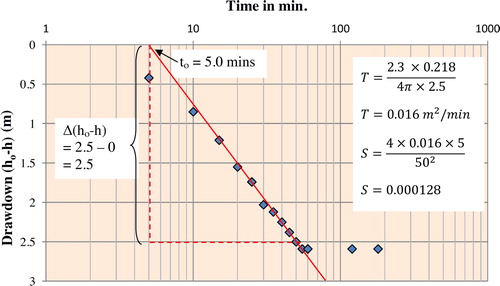
Fig. 11 Plot of drawdown versus time for Oha.
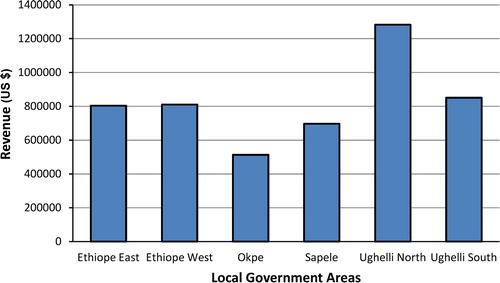
A water scheme to provide potable water for the people of the district is therefore proposed. The scheme when established will provide water to six local government areas in the region, namely Ethiope East, Ethiope West, Okpe, Sapele, Ughelli North and Ughelli South, with populations of 200 942, 202 712, 128 398, 174 273, 320 687 and 212 638, respectively [Citation21]. On the assumption that each individual in the area will consume 4000 L of water a month and that a rate of US$ 1 per 1000 L is charged, a monthly revenue of US$ 4.96 million (800 million naira) could be generated annually from the scheme (). The proposed scheme will also provide employment for a good number of people living in the area. This fact was corroborate the suggestion of Zhu and Ierland [Citation26] that water is part of the environmental resource that contributes to economic activities and therefore can be treated as a direct input to the economic system.
Fig. 12 Monthly revenue that could be derived from establishing a water scheme in the study area.
4 Conclusion
A geoelectrical survey, down-hole logging and pumping tests were performed to investigate the groundwater potential and aquifer characteristics of the study area. The geoelectrical survey showed that the depth of the aquifer is 18.4–25.4 m and the resistivity is 869.1–8704.1 Ωm. This result is in agreement with that of Egbai [Citation27] in a nearby location, who found that the resistivity of the aquifer in Osubi is 366–7550 Ωm. We found that the average aquifer electrical conductivity was 0.026 mS/m, the total dissolved solids was 25.75 mg/m3, transmissivity was 0.022 m2/min and storability was 0.000133. The transmissivity and storativity values indicate that the drawdown is low, indicating that long pumping can be sustained in this district. Halford et al. [Citation19] reported that low drawdown indicates that long pumping can be sustained, as the aquifer can recuperate in a short time.
The results indicate that the aquifer is of good quality and could provide enough water for the area. It is therefore recommended that a water scheme be established in the area, which will also be a backup for the water scheme in Warri and also cater for the coaster communities in Delta State, which suffers from saline water intrusion. The water scheme will serve not only the people of the area but the populations of large towns and cities in the district. The scheme, when established, will bring succuor to the people of the district and produce revenue for the State Government. It will also provide employment for a good number of people.
Notes
Peer review under responsibility of Taibah University
Related Research Data
References
- A.O.LawrenceT.A.OjoThe use of combined geophysical survey methods for groundwater prospecting in a typical basement complex terrain: case study of Ado-Ekiti southwest NigeriaRes. J. Eng. Appl. Sci.12012362376
- A.U.UtomB.I.OdohA.U.OkoroEstimation of aquifer transmissivity using Dar Zarrouk parameters derived from surface resistivity measurements: a case history from parts of Enugu town (Nigeria)J. Water Res. Protect.420129931000
- V.ArulprakasamR.SivakumarB.GowthamDetermination of hydraulic characteristics using electrical resistivity methods—a case study from Vanur watershed, Villupuram District, Tamil NaduIOSR J. Appl. Geol. Geophys.120131014
- O.AnomohanranGeophysical investigation of groundwater potential in Ukelegbe, NigeriaJ. Appl. Sci.132013119125
- O.AnomohanranEvaluation of aquifer characteristics in Echi, Delta State, Nigeria using well logging and pumping test methodAm. J. Appl. Sci.10201312631269
- A.GabrA.MuradH.BakerK.BloushiH.ArmanS.MahmoudThe use of seismic refraction and electrical techniques to investigate groundwater aquifer, Wadi Al-ain, United Arab Emirates (UAE)Conference Proceedings of the Water Resources and Wetlands, 14–16 September2012
- R.K.MajumdarD.DasHydrological characterization and estimation of aquifer properties from electrical sounding data in Sagar Island region, South 24 Parganas, West Bengal, IndiaAsian J. Earth Sci.420116074
- A.SirhanM.HamidiP.AndrieuxElectrical resistivity tomography, an assessment tool for water resource: case study of Al-Aroub basin, West Bank, PalestineAsian J. Earth Sci.420113845
- L.AdeotiO.M.AlileO.UchegbulamR.B.AdegbolaGeoelectrical investigation of the groundwater potential in Mowe, Ogun State, NigeriaBr. J. Appl. Sci. Technol.220125871
- G.K.AnuduL.N.OnubaL.S.UfonduGeoelectric sounding for groundwater exploration in the crystalline basement terrain around Onipe and adjoining areas, southwestern NigeriaJ. Appl. Technol. Environ. Sanit.12011343354
- E.A.AyolabiL.AdeotiN.A.OshinlajaI.O.AdeosunO.I.IdowuSeismic refraction and resistivity studies of part of Igbogbo township, south-west NigeriaJ. Sci. Res. Dev.1120094261
- K.O.IbrahimP.I.OlasehindeA.O.AkinrinmadeA.IsaGeoelectrical soundings to investigate groundwater potential of Orisunmibare village in Ilorin South area of Kwara State, NigeriaJ. Environ.120122125
- K.A.MogajiK.A.N.AdiatM.I.OladapoGeoelectric investigation of the Dape phase III housing estate FCT Abuja, north central NigeriaJ. Earth Sci.120077684
- K.S.OkiongboE.AkofureE.OduboDetermination of aquifer protective capacity and corrosivity of near surface materials in Yenagoa City, NigeriaRes. J. Appl. Sci. Eng. Technol.32011785791
- O.AnomohanranGeoelectrical investigation of groundwater condition in Oleh, NigeriaInt. J. Res. Rev. Appl. Sci.152013102106
- D.K.ToddGroundwater Hydrology2nd ed.2004John WileyNew York
- T.A.TizroK.S.VoudourisM.KamaliComparative study of step drawdown and constant discharge tests to determine the aquifer transmissivity: the Kangavar aquifer case study, IranJ. Water Res. Hydraul. Eng.320141221
- P.RajasekharK.P.VimalM.MansoorDetermination of confined aquifer parameters by Sushil K. Singh methodAm. Int. J. Res. Sci. Technol. Eng. Math.52014158163
- K.J.HalfordW.D.WrightR.P.SchreiberInterpretation of transmissivity estimates from single-well pumping aquifer testsGround Water442006467471
- U.GogoiDetermination of aquifer parameters of the shallow aquifers of Barak Valley, Assam, IndiaInt. Bull. Water Resour. Dev.12013113
- Legal Notice on Publication of 2006 Census Final ResultsFederal Republic of Nigeria Official Gazette9622009B26
- A.A.AlabiR.BelloA.S.OgungbeH.O.H.O.OyerindeDetermination of groundwater potential in Lagos State University, Ojo; using geoelectric methods (vertical electrical sounding and horizontal profiling)Rep. Opin.220106875
- H.T.NejadGeoelectric investigation of the aquifer characteristics and groundwater potential in Behbahan Azad University farm, Khuzestan Province, IranJ. Appl. Sci.9200936913698
- C.W.FetterApplied Hydrogeology2nd ed.2007CBS PublishersNew Delhi
- United States Environmental Protection AgencyDrinking water standards and health advisories2012USEPAWashington, DC (EPA 822-S-12-001)
- X.ZhuE.C.V.IerlandEconomic modelling for water quantity and quality management: a welfare program approachWater Res. Manag.26201224912511
- J.C.EgbaiAquifer comparability and formation strata in Orogun and Osubi (Ugolo) area of Delta State using electrical resistivity methodInt. J. Res. Rev. Appl. Sci.142013682691