
 ?Mathematical formulae have been encoded as MathML and are displayed in this HTML version using MathJax in order to improve their display. Uncheck the box to turn MathJax off. This feature requires Javascript. Click on a formula to zoom.
Abstract
We studied the applicability of data from the recently launched Landsat-8 for mapping hydrothermal alteration areas and lithological units associated with porphyry copper exploration in arid and semi-arid regions. Sar Cheshmeh copper mining district in the Urumieh-Dokhtar volcanic belt in south-eastern Iran was selected for a case study. Several red–green–blue colour combination images and specialized band ratios were prepared from Landsat-8 bands. Band ratios derived from image spectra (4/2, 6/7, 5 and 10 in red–green–blue) allow identification of altered rocks, lithological units and vegetation at regional scale. Analytical imaging and geophysical hyperspectral analysis processing methods and mixture tuned matched filtering were applied to Landsat-8 bands to identify alteration zones associated with known porphyry copper deposits. Fieldwork, previous remote sensing studies and laboratory analysis were used to verify the image processing results. We conclude that Landsat-8 bands, especially bands 2 and 4 in the visible and near-infrared, 6 and 7 in the shortwave infrared and 10 in the thermal infrared spectra, contain useful information for porphyry copper exploration. The thermal infrared bands of Landsat-8 significantly improved the quality and availability of remote-sensing data for lithological mapping. The results of this investigation should encourage geologists to use Landsat-8 operational land imager and thermal infrared sensor data for porphyry copper exploration and geological purposes.
1 Introduction
Remote sensing has been used in diverse aspects of the Earth sciences, geography, archaeology and environmental sciences. New-generation, advanced remote sensing has been used in the past few decades in environmental geology, mineral and hydrocarbon exploration. In the initial stages of remote-sensing technology development in the 1970s, geological mapping and mineral exploration were the commonest applications [Citation1–Citation4]. Multispectral and hyperspectral remote sensors were used in geological applications, ranging from a few spectral bands to more than 100 contiguous bands covering the visible to the shortwave infrared regions of the electromagnetic spectrum [Citation5–Citation21].
The first Landsat satellite, launched in 1972 within the Landsat Data Continuity Mission, will have a nearly 42-year global record. Two generations of Landsat satellites have now been launched by the National Aeronautics and Space Administration and the United States Geological Survey. The first generation (Landsat-1, -2 and -3) operated from 1972 to 1985 and has essentially been replaced by the second generation (Landsat-4, -5 and -7). Landsat-6, launched in 1993, failed to enter orbit [Citation22].
The Advanced Land Imager (ALI) sensor was launched on 21 November 2000 as the archetype of the next generation of Landsat satellites, with multispectral characteristics to maintain the Enhanced Thematic Mapper Plus (ETM+) sensor on Landsat 7, a spatial resolution of 30 m and a swathe width of 37 km [Citation23–Citation26].
Landsat-8 was launched on 4 February 2013 from Vandenberg Air Force Base in California. It is an American Earth observation satellite and joins Landsat-7 on-orbit, providing increased coverage of the Earth's surface. It is a free-flyer spacecraft carrying two sensors, the Operational Land Imager (OLI) and the Thermal Infrared Sensor (TIRS). These two instruments collect images for nine visible, near-infrared and shortwave infrared bands and two long-wave thermal bands. They have high signal-to-noise radiometer performance, allowing 12-bit quantification of data, thus providing more bits for better land-cover characterization. Landsat-8 provides moderate-resolution imagery, from 15 to 100 m of the Earth's surface and polar regions [Citation27,Citation28]. Landsat-8 data are available to the general public at no cost and can be downloaded at http://earthexplorer.usgs.gov and http://glovis.usgs.gov/.
This revolution has allowed scientists to detect changes to our planet over time, and many applications based on Landsat measurements have been developed by researchers, the private sector and state, local and tribal governments. The performance characteristics of ALI, ETM+ and Landsat-8 are listed in . Landsat-8, OLI and TIRS data can be used to monitor a variety of Earth-based and atmospheric phenomena, including in agriculture; geological mapping; evapo-transpiration; cloud detection and analysis; mapping of heat fluxes from cities; monitoring air quality, volcanic activity, rainforests and biomass burning; industrial thermal pollution in the atmosphere, rivers and lakes; monitoring and tracking material transport in lakes and coastal regions; identifying insect breeding areas and applications that will arise in the future as a result of global warming and climate change.
Table 1 Performance characteristics of the ALI and ETM+ and Landsat-8 OLI/TIRS sensors.
We evaluated the use of Landsat-8 bands for mapping hydrothermal alteration areas and lithological units associated with porphyry copper deposits. The Sar Cheshmeh copper mining district in the south-eastern Urumieh-Dokhtar volcanic belt in Iran ( and ), where Cu and Mo are actively mined, was selected for a case study. We have conducted several remote-sensing studies in the Sar Chashmeh copper mining district using ASTER, ALI and Hyperion data. In a previous study, we applied image processing techniques such as principal component analysis, band ratioing and spectral mapping methods to ASTER, ALI and Hyperion data to detect alteration zones associated with porphyry copper deposits in the study area. Landsat-8 imagery has not, however, been evaluated for porphyry copper exploration in this area and other arid and semi-arid regions. The objectives of this study were to evaluate use of Landsat-8 spectral bands for detecting hydrothermal alteration minerals and rock units associated with porphyry copper deposits in arid and semi-arid regions; to develop band ratios specialized for porphyry copper exploration and to test use of mixture-tuned matched-filtering spectral mapping of Landsat-8 OLI bands for detecting alteration zones.
Fig. 1 Simplified geological map of the south-eastern segment of the Urumieh–Dokhtar volcanic belt (modified from Pour and Hashim [Citation14]). Study areas are shown in rectangles.
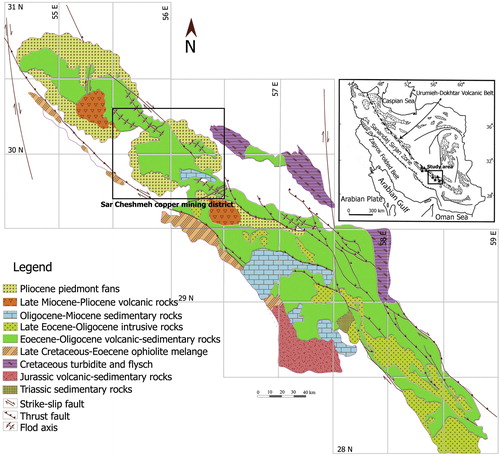
Fig. 2 Geological map of Sar Cheshmeh region (modified from Mars and Rowan [Citation30]).

2 Materials and methods
2.1 Geology of the study area
The Sar Cheshmeh porphyry copper deposit (55° 52′ 20″ E, 29° 58′ 40″ N) is located 60 km southwest of Kerman City in Kerman Province, south-eastern Iran. is a geological map of the Sar Cheshmeh area [Citation29,Citation30]. The deposit is in a belt of Eocene volcanic rock and Oligo-Miocene subvolcanic granitoid rock. The oldest host rocks of the Sar Cheshmeh porphyry copper deposit belong to an Eocene volcanogenic complex [Citation31], which consists of pyroxene trachybasalt, pyroxene trachyandesite of potassic and shoshonitic affinity [Citation32], less abundant andesite and rare occurrences of agglomerate, tuff and tuffaceous sandstone. These rocks were intruded by a complex series of Oligo-Miocene granitoid phases, including quartz diorite, quartz monzonite and granodiorite. The granitoid rocks are cut by a series of intramineral hornblende porphyry, feldspar porphyry and biotite porphyry dykes.
Hydrothermal alteration and mineralization at Sar Cheshmeh occur as stockworks, which were broadly synchronous with the granitoid intrusives in their emplacement. Early hydrothermal alteration was predominantly potassic and propylitic but was followed later by phyllic, silicic and argillic alterations [Citation33]. The Sar Cheshmeh deposit is estimated to contain approximately 1200 million tonnes of 1.2% copper, with significant amounts of molybdenum (0.03%) and gold (0.01%) [Citation34]. Several remote-sensing studies have been conducted in this region recently [Citation35–Citation38].
2.2 Landsat-8 OLI/TIRS data
A cloud-free level 1T (terrain-corrected) Landsat-8 image LC81600392013135LGN01 (path/row 160/39) of the Sar Cheshmeh area was obtained from the US Geological Survey Earth Resources Observation and Science Center (http://earthexplorer.usgs.gov) on 15 May 2013. The image map projection is Universal Transverse Mercator zone 40N (polar stereographic for Antarctica) from the WGS 84 datum. The OLI features two additional spectral channels with advanced measurement capabilities: a deep-blue band for coastal water and aerosol studies (band 1, 0.433–0.453 μm, 30 m pixel size), and a band for cirrus cloud detection (band 9, 1.36–1.39 μm, 30 m pixel size). The TIRS collects data in two long-wavelength thermal bands (band 10, 10.30–11.30 μm, 100 m pixel size; band 11, 11.50–12.50 μm, 100 m pixel size), which have been co-registered with OLI data ().
2.3 Pre-processing of Landsat-8 OLI/TIRS data
The Landsat-8 image of the target site was processed with Environment for Visualizing Images version 4.8 software. Landsat-8 data were converted to surface reflectance by the internal average relative reflection method [Citation39], which is recommended for calibration in mineralogical mapping, as it does not require prior knowledge of samples collected in the field. During atmospheric correction, raw radiance data from an imaging spectrometer is re-scaled to reflectance data, and therefore all spectra are shifted to nearly the same albedo. The resulting spectra can be compared directly with laboratory or filed reflectance spectra. Panchromatic and cirrus cloud (band 9) bands were not used in this study. Thermal atmospheric correction was performed on TIR bands with a normalized pixel regression method [Citation40]. The 90-m resolution TIR bands were re-sampled to correspond to 30-m spatial dimensions for some image processing applications. Nearest neighbour re-sampling was used to preserve the original pixel values in the re-sampled images.
2.4 Image processing methods
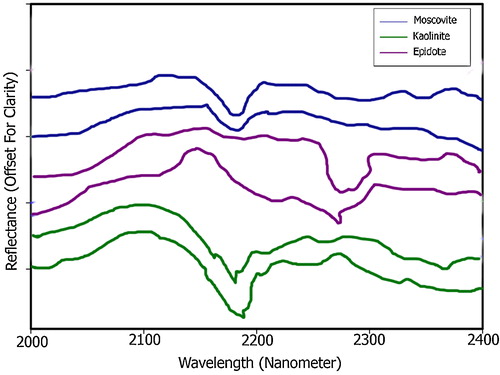
The ability to discriminate between hydrothermally altered and unaltered rocks is essential in mineral exploration. In the region of solar reflected light (0.3–2.5 μm), many minerals have diagnostic absorption features due to vibrational overtones, electronic transition, charge transfer and conduction. Sericitically altered rocks typically contain sericite, a fine-grained form of muscovite with a distinct AlOH absorption feature at 2.2 μm and a less intense absorption feature at 2.35 μm (A). Kaolinite and alunite are typical constituents of advanced argillic alteration with AlOH 2.165 μm and 2.2 μm absorption features (A). Propylitically altered rocks typically contain varying amounts of chlorite, epidote and calcite, with Fe, MgOH and CO3 2.31–2.33 μm absorption features (A). Iron oxide and hydroxide minerals such as limonite, jarosite and hematite tend to have spectral absorption features in the visible to middle infrared from 0.4 to 1.1 μm of the electromagnetic spectrum (B) [Citation41,Citation42]. Hydrothermal silica minerals usually consist of quartz, opal and chalcedony. TIR emissivity spectra show that quartz and opal contain a prominent restrahlen feature in the 9.1-μm region [Citation43,Citation44].
Fig. 3 (A) Laboratory spectra of epidote, calcite, muscovite, kaolinite, chlorite and alunite. (B) Laboratory spectra of limonite, jarosite, hematite and goethite (Clark et al., 1993).

The reflectance of samples from porphyry copper deposits showed strong absorption features at 2200 and 2170 nm. The reflectance curves were similar to the spectra of muscovite (strong absorption feature) and kaolinite and minor signatures of alunite. Samples from surrounding areas showed strong absorption features at 2350 nm, which is attributed to the presence of epidote and chlorite in the altered rocks. Absorption spectra at 2200, 2170 and 2350 nm were found to be the best diagnostic features of the sericitically, argillically and propylitically altered rocks associated with porphyry copper mineralization, respectively.
Several red–green–blue (RGB) colour combination images and band ratios were created with Landsat-8 bands based on laboratory spectra of the minerals related to hydrothermal alteration and lithological units. Different colour combination images were used to enhance hydrothermally altered rocks and lithological units at regional scale. Band ratioing is a technique in which the digital number value of one band is divided by that of another band. Band ratios are useful for highlighting certain features or materials that cannot be seen in raw bands [Citation45].
The aim of spectral mapping is to distinguish individual mineral species from a mixed pixel spectrum, in theory allowing geologists to map mineral surface composition. Although image-processing methods have usually been applied to hyperspectral data, they could also logically be applied to multispectral data. With these image-processing methods, pixels with mixed spectral signatures can be extracted and separated from the undesirable background. Thus, mineral abundance maps can be produced that are free of the diluting effects of the surrounding environment. Analytical imaging and geophysics hyperspectral analysis processing methods were applied to Landsat-8 bands to map hydroxide and carbonate mineral assemblages in hydrothermal alteration zones and documented with Environment for Visualizing Images software. The data were analyzed by this approach to determine unique spectral end-members and their spatial distribution and abundance and to produce detailed mineral maps.
The analysis consisted of the following steps: spectral compression, noise suppression and dimensionality reduction by minimum noise fraction transformation [Citation46,Citation47]; spatial data reduction with the pixel purity index [Citation46]; extraction of end-member spectra with the n-dimensional visualizer [Citation46]; identification of end-member spectra by visual inspection, automated identification and spectral library comparisons [Citation48] and production of material maps with a variety of spectral mapping methods, including spectral angle mapper, linear spectral unmixing, matched filtering, mixture-tuned matched filtering (MTMF), spectral feature fitting and binary encoding.
MTMF was applied to nine visible, near-infrared and shortwave infrared Landsat-8 bands to identify alteration zones associated with known porphyry copper deposits in the study area. MTMF is a combination of the best parts of the linear spectral mixing model and the statistical matched filter model, avoiding the drawbacks of each parent method. From matched filtering, it inherits the advantage of its ability to map a single known target without knowing the other background end-member signatures, unlike traditional spectra mixture modelling. From spectral mixture modelling, it inherits the leverage arising from the mixed pixel model, the constraints on feasibility including the unit-sum and positivity requirements, unlike the matched filter method, which does not take account of these fundamental facts. As a result, MTMF can outperform either method, especially in cases of subtle, sub-pixel occurrences [Citation48].
The previous remote-sensing studies, filed observations, global positioning system survey, X-ray diffraction analysis, field spectral reflectance measurements and regional geology map of the study area were used to verify the results derived by image processing. Additionally, root mean square error (RMSE) analysis was performed for 50 alteration-mapped pixel points derived from the image processing results and compared with real points on the ground obtained in the global positioning system surveywhere Preal is real points on the ground and Pestimated is alteration-mapped pixel points at point i. The estimated RMSE for selected points in this study was 0.7865.
3 Results and discussion
The first spectral band of Landsat-8 (0.433–0.453 μm) is a deep-blue band designed for studies of coastal water and aerosols and cannot be used to detect geological features; it was therefore excluded from the RGB colour combination image in this section. A single RGB image was produced for visible bands 2, 3 and 4 of the Landsat-8 data. Band 2 is positioned in the blue (0.450–0.515 μm), band 3 in the green (0.525–0.600 μm) and band 4 in the red (0.630–0.680 μm) region of the electromagnetic spectrum. The natural RGB colour combination image was assigned to bands 4, 3 and 2 for a full view of the image. Geological features and the geomorphological framework can be distinguished at regional scale. The textural characteristics of igneous rocks can be discriminated from those of sedimentary rock, and the structural features and sedimentary texture of rocks at the site are readily recognizable with this natural RGB colour combination of the visible bands.
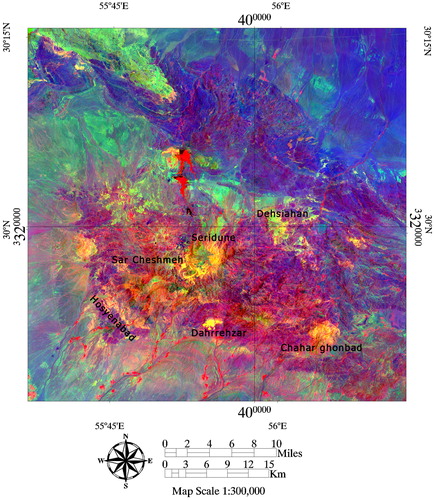
The RGB colour combination image was allocated to near-infrared (band 5: 0.845–0.885 μm) and short-wavelength infrared bands (band 6: 1.560–1.660 μm, band 7: 2.100–2.300 μm) of the Landsat-8 data. Geological features, including the textural characteristics of igneous and sedimentary rocks, structural features and vegetation, are detected at regional scale. Vegetated areas appear in light-red; they show absorption features at 0.45–0.68 μm and high reflectance in the near-infrared from 0.7 to 1.2 μm [Citation49] and are therefore more visible in the resulting RGB image of the near-infrared band (band 5). The colour and textural features of igneous and sedimentary rocks are more robust in this RGB colour composite. Hydrothermally altered rocks are recognizable as a yellow area in the belt of crystalline igneous rocks in the Sar Cheshmeh copper mining district. Clay and carbonate minerals have absorption features of 2.1–2.4 μm (band 7 of Landsat-8) and reflectance of 1.55–1.75 μm (band 6 of Landsat-8) [Citation50].
Two thermal infrared bands (bands 10 and 11) of Landsat-8 have spectral coverage of 10.30–11.30 and 11.50–12.50 μm, respectively. The energy measured by TIR bands from the Earth's surface is a function of temperature as well as the emissivity of the target, which depends on its chemistry and texture [Citation50]. The TIR bands of Landsat-8 have improved the quality and applicability of the data in a variety of Earth-based and atmospheric phenomena [Citation23]. Silicate minerals have spectral features in the TIR: the emissivity curve shows significant variation in 8.5–9.30 and 10.30–11.70 μm. There are clear minima in 8.5–9.30 μm, while higher emissivity values are seen at 10.30–11.70 μm [Citation50]. RGB combination images can be produced for Landsat-8 bands 10 (10.30–11.30 μm), 11 (11.50–12.50 μm) and 7 (2.10–2.30 μm) at regional scale. Rocks with high emissivity due to a high content of silicate minerals appear red in the image, while rocks with moderate and low emissivity appear as pink and blue, respectively. Band 7 was selected for the RGB combination image as representative of rock absorption features in the short-wavelength infra-red region because of the presence of AlOH, Fe, MgOH, SiOH and CO3. Hence, blue areas contain low-silicate rocks.
For the identification of hydrothermal alteration minerals associated with porphyry copper mineralization from Landsat-8 bands, two band ratios were designated on the basis of the laboratory spectra of alteration minerals. Iron oxides were mapped with bands 2 and 4 because iron oxides or hydroxides, such as hematite, jarosite and limonite, have high reflectance between 0.63 and 0.69 μm (the equivalent of ETM+ band 3) and high absorption between 0.45 and 0.52 μm (the equivalent of ETM+ band 1). Mapping of clay and carbonate minerals must incorporate bands 6 and 7 attributed to high reflectance in the range 1.55–1.75 μm and high absorption at 2.08–2.35 μm, corresponding to ETM+ bands 5 and 7, respectively.
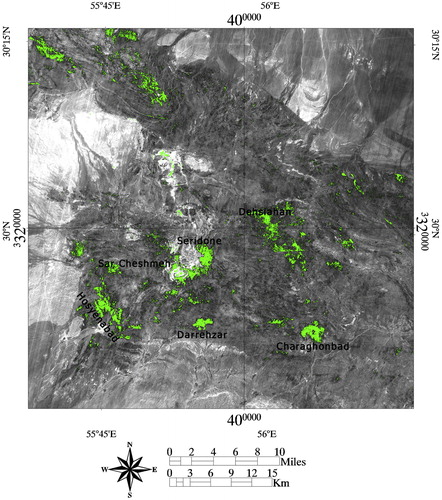
Band ratios derived from image spectra (4/2, 6/7, 5 and 10 in RGB) allow the identification of altered rocks, lithological units and vegetation ( and ). The hydrothermally altered rocks are yellow in the images of known (named in the figures) and mined porphyry copper deposits (). The boundary between sedimentary (Neogene redbed agglomerate and conglomerate) and igneous rocks (Eocene-Oligocene volcanic rocks, Lower Eocene tuff and volcanic rocks) units are also delimited in the images. Vegetation is shown as red and purple in the drainage system and background at the two sites ( and ). Previous remote-sensing results obtained with ASTER, ALI, ETM+ and Hyperion data in the study area indicate that the two band ratios derived from Landsat-8 bands efficiently identified hydrothermally altered rocks and lithological units. Geological features are more visible in the 4/2, 6/7 and 10 band ratio images because of the presence of the TIR band (band 10) in the RGB combination. As mentioned above, the emissivity of the geological target in the TIR region depends on its chemistry and texture. Therefore, the TIR bands of Landsat-8 could significantly improve the quality and availability of TIR remote-sensing data for geological mapping.
Fig. 4 Band ratios of 4/2, 6/7, 5 in RGB.
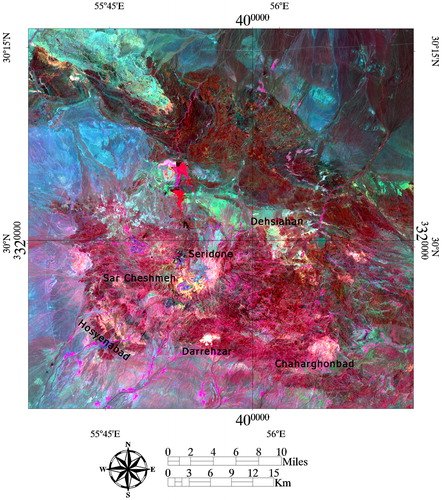
Fig. 5 Band ratios of 4/2, 6/7, 10 in RGB.
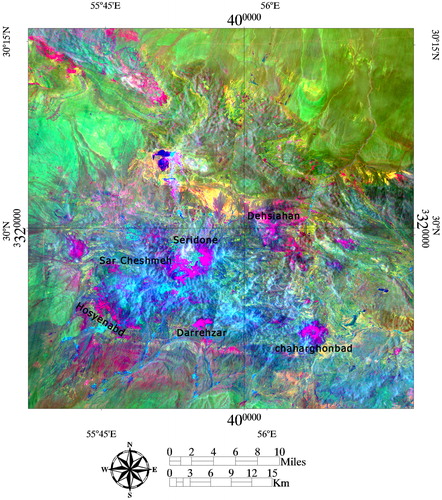
The analytical imaging and geophysics approach was applied to OLI/TIRS Landsat-8 bands linearly transformed by minimum noise fraction methods. Minimum noise fraction component images show steadily decreasing image quality with increasing band number, and images with higher eigenvalues contain more spectral information [Citation51]. RGB combination images were assigned to three high eigenvalue minimum noise fraction-transformed bands. shows the resulting image, in which lithological units and hydrothermally altered rocks are discriminated. Elliptical and circular patterns of hydrothermally altered rocks appear in purple around known copper deposits in the study area (). Disturbances of sedimentary rocks appearing as light purple to red can be seen in the northern and southern parts of the image. Sedimentary rocks, such as mudstone, shale, claystone and litharenite sandstone, contain large amounts of detrital clays such as montmorillonite, illite and kaolinite; these can be erroneously mapped as hydrothermally altered clay minerals. Hydrothermally altered rocks associated with porphyry copper mineralization are located in background crystalline igneous rocks, and use of thermal infrared spectral information in the minimum noise fraction-transformed images aids identification of these background rocks, shown in light blue ().
Fig. 6 RGB colour combination of minimum noise fraction 1, 2, 3 components.
The output of the MTMF method is a set of images that give matched filtering and infeasibility scores for each pixel for end-members. Fig. 9 shows the matched filtering score image of clay and carbonate minerals in short-wave infrared bands of Landsat-8 in the study area. Green areas are high digital value pixels above the background level, with low infeasibility (). Most of the identified areas are associated with the known porphyry copper deposits, and a few can be seen in the sedimentary rock background (north-western part of the site).
Fig. 7 Matched filtering score image of clay and carbonate minerals.
The spatial distribution of the identified hydrothermally altered rocks was verified by in situ inspection. Geological locations were recorded with a Garmin® eTrex Legend®H global positioning system. Samples for X-ray diffraction analysis and spectral reflectance measurements were collected from Sar Cheshmeh mines and surrounding areas, and field photographs of the geomorphology, rock units, hydrothermally altered rocks, sampling sites and open-pit quarry of copper mines were collected. X-ray diffraction analysis of the collected rock samples showed that the minerals detected predominantly in altered rocks included muscovite, illite, kaolinite, epidote, chlorite, calcite and quartz. The average spectral measurements of samples of hydrothermally altered rocks are shown in . The reflectance of samples from the open-pit quarry at the Sar Cheshmeh mine showed strong absorption features at 2200 and 2170 nm, while samples from surrounding areas showed strong absorption features at 2350 nm. Fifty points of alteration mapped pixel points derived from the image with results and real points on the ground obtained in the global positioning system survey showed an RMSE of 0.7865 for this study. Landsat-8 data can therefore yield significant geological information for the identification of hydrothermally altered rocks and lithological units associated with porphyry copper deposits in arid and semi-arid regions.
Fig. 8 Laboratory reflectance spectra of altered rock samples from alteration zones in the study area.
4 Conclusions
We evaluated the applicability of Landsat-8 data for obtaining geological information on hydrothermal alteration and lithological mapping associated with porphyry copper deposits, with selected image-processing methods. In the Sar Cheshmeh copper mining districts in the south-eastern Urumieh-Dokhtar volcanic belt, Landsat-8 bands yielded spectral information that allowed identification of vegetation, iron oxide and hydroxide and clay and carbonate minerals, silicate mineral and lithological units for the exploration of porphyry copper. The TIR bands of Landsat-8 significantly improved the quality and availability of TIR remote-sensing data for lithological mapping. This investigation demonstrates the implications for geologists of Landsat-8 OLI/TIRS data for porphyry copper deposit exploration.
Acknowledgements
This study was conducted within the Fundamental Research Grant scheme (Vote no: R.J130000.7809.4F455) Ministry of Higher Education Malaysia. We are thankful to the Universiti Teknologi Malaysia for providing the facilities for this investigation. We also express our appreciation to the anonymous reviewer for useful, constructive comments and suggestions for improving this manuscript.
Notes
Peer review under responsibility of Taibah University.
References
- L.C.RowanP.H.WetlauferA.F.H.GoetzF.C.BillingsleyJ.H.StewartDiscrimination of rock types and detection of hydrothermally altered areas in south-central NevadaU. S. Geol. Surv. Prof. Paper883197435
- A.F.H.GoetzB.N.RockL.C.RowanRemote sensing for exploration: an overviewEcon. Geol.781983573590
- M.J.AbramsD.BrownL.LepleyR.SadowskiRemote sensing of porphyry copper deposits in southern ArizonaEcon. Geol.781983591604
- L.C.RowanA.F.H.GoetzR.P.AshleyDiscrimination of hydrothermally altered and unaltered rocks in visible and near infrared multispectral imagesGeophysics421977522535
- J.K.CrowleyD.W.BrickeyL.C.RowanAirborne imaging spectrometer data of the Ruby Mountains. Montana: mineral discrimination using relative absorption band-depth imagesRemote Sens. Environ.291989121134
- T.CocksR.JenssenA.StewartI.WilsonT.ShieldsThe HyMap airborne hyperspectral sensor: the system, calibration and performanceM.SchaepmanD.SchläpferK.I.IttenProceedings of the 1st EARSeL Workshop on Imaging Spectroscopy, 6–8 October 19981998European Association of Remote Sensing LaboratoriesMünster3743
- F.A.KruseJ.W.BoardmanA.B.Lefkoffet alThe spectral image processing system (SIPS)—interactive visualization and analysis of imaging spectrometer dataRemote Sens. Environ.441993145163
- A.F.H.GoetzThree decades of hyperspectral remote sensing of the Earth: a personal viewRemote Sens. Environ.1132009S6S16
- B.A.PourM.HashimM.MarghanyUsing spectral mapping techniques on short wave infrared bands of ASTER remote sensing data for alteration mineral mapping in SE IranInt. J. Phys. Sci.62011917929
- B.A.PourM.HashimIdentification of hydrothermal alteration minerals for exploring of porphyry copper deposit using ASTER data, SE IranJ. Asian Earth Sci.42201113091323
- B.A.PourM.HashimSpectral transformation of ASTER and the discrimination of hydrothermal alteration minerals in a semi-arid region, SE IranInt. J. Phys. Sci.6201120372059
- B.A.PourM.HashimThe Earth observing-1 (EO-1) satellite data for geological mapping, southeastern segment of the central Iranian volcanic belt, IranInt. J. Phys. Sci.6201176387650
- B.A.PourM.HashimThe application of ASTER remote sensing data to porphyry copper and epithermal gold depositsOre Geol. Rev.44201219
- B.A.PourM.HashimIdentifying areas of high economic-potential copper mineralization using ASTER data in Urumieh-Dokhtar volcanic belt, IranAdv. Space Res.492012753769
- B.A.PourM.M.HashimFusing ASTER, ALI and Hyperion data for enhanced mineral mappingInt. J. Image Data Fusion42013126145
- B.A.PourM.HashimJ.van GenderenDetection of hydrothermal alteration zones in a tropical region using satellite remote sensing data: Bau gold field, Sarawak, MalaysiaOre Geol. Rev.542013181196
- B.A.PourM.HashimM.MarghanyExploration of gold mineralization in a tropical region using Earth Observing-1 (EO1) and JERS-1 SAR data: a case study from Bau gold field, Sarawak, MalaysiaArab. J. Geosci.7201423932406
- B.A.PourM.HashimAlteration mineral mapping using ETM+ and Hyperion remote sensing data at Bau Gold Field, Sarawak, MalaysiaEarth Environ. Sci.182014012149
- B.A.PourM.HashimStructural geology mapping using PALSAR data in the Bau gold mining district, Sarawak, MalaysiaAdv. Space Res.542014644654
- B.A.PourM.HashimASTER, ALI and Hyperion sensors data for lithological mapping and ore mineral explorationSpringerplus32014119
- B.A.PourM.HashimStructural mapping using PALSAR data in the Central Gold Belt, Peninsular MalaysiaOre Geol. Rev.6420151322
- F.F.SabinsRemote sensing for mineral explorationOre Geol. Rev.141999157183
- B.E.HubbardJ.K.CrowleyMineral mapping on the Chilean–Bolivian Altiplano using co-orbital ALI. ASTER and Hyperion imagery: data dimensionality issues and solutionsRemote Sens. Environ.992005173186
- National Aeronautics and Space AdministrationEarth Observing-1 Advanced Land Imager2002http://eo1.gsfc.nasa.gov/Technology/ALIhome1.htm
- National Aeronautics and Space AdministrationEarth Observing-1 EO1General Mission2004http://eo1.gsfc.nasa.gov/new/general/
- M.A.WulderJ.C.WhiteS.N.GowardG.M.JeffreyJ.R.IronsM.HeroldW.B.CohenT.R.LovelandC.E.WoodcockLandsat continuity: issues and opportunities for land cover monitoringRemote Sens. Environ.1122008955969
- D.R.HearnC.J.DigenisD.E.LencioniJ.A.MendenhallJ.B.EvansR.D.WaleshEO-1 advanced land imager overview and spatial performanceIEEE Trans. Geosci. Remote Sens.22001897899
- US Geological SurveyLandsat Data Continuity Mission2012US Geological SurveyWashington, DC
- H.HubnerGeological map of Iran sheet no. 5, south-central Iran1969National Iranian Oil CompanyTehran
- J.C.MarsL.C.RowanRegional mapping of phyllic- and argillic-altered rocks in the Zagros magmatic arc, Iran, using Advanced Spaceborne Thermal Emission and Reflection Radiometer (ASTER) data and logical operator algorithmsGeosphere22006161186
- G.C.WatermanR.L.HamiltonThe Sarcheshmeh porphyry copper depositEcon. Geol.701975568576
- H.AtapourA.AftabiThe geochemistry of gossans associated with Sarcheshmeh porphyry copper deposit, Rafsanjan, Kerman, Iran: implications for exploration and the environmentJ. Geochem. Explor.9320074765
- A.HezarkhaniHydrothermal evolution of the Sar-Cheshmeh porphyry Cu–Mo deposit, Iran: evidence from fluid inclusionsJ. Asian Earth Sci.282006409422
- D.A.SingerV.I.BergerB.C.MoringPorphyry copper deposits of the world: database and grade and tonnage models: US Geological Survey Open-File Report 2008-11552014http://pubs.usgs.gov/of/2008/1155
- H.RanjbarM.HonarmandbZ.MoezifarApplication of the Crosta technique for porphyry copper alteration mapping, using ETM+ data in the southern part of the Iranian volcanic sedimentary beltJ. Asian Earth Sci.242004237243
- H.RanjbarF.MasoumiE.J.M.CarranzaEvaluation of geophysics and spaceborne multispectral data for alteration mapping in the Sar Cheshmeh mining area, IranInt. J. Remote Sens.32201133093327
- M.Hosienjani ZadehM.H.TangestaniF.V.RoldanI.YustaSub-pixel mineral mapping of a porphyry copper belt using EO-1 Hyperion dataAdv. Space Res.532013440451
- M.HonarmandH.RanjbarJ.ShahabpourCombined use of ASTER and ALI data for hydrothermal alteration mapping in the northwestern part of the Kerman magmatic arc, IranInt. J. Remote Sens.34201320232046
- E.Ben-DorF.A.KruseA.B.LefkoffA.BaninComparison of three calibration techniques for utilization of GER 63-channel aircraft scanner data of Makhtesh Ramon, Nega, IsraelPhotogramm. Eng. Remote Sens.60199413391354
- S.ScheidtM.RamseyN.LancasterRadiometric normalization and image mosaic generation of ASTER thermal infrared data: an application to extensive sand and dune fieldsRemote Sens. Environ.1122008920933
- G.R.HuntSpectral signatures of particulate minerals in the visible and near infraredGeophysics421977501513
- G.R.HuntP.AshleySpectra of altered rocks in the visible and near infraraedEcon. Geol.74197916131629
- G.R.HuntJ.W.SalisburyMid-infrared spectral behavior of metamorphic rocks, Technical Report AFRCL-TR-76-00031976Cambridge, MAUS Air Force Cambridge Research Laboratory
- I.Di TommasoN.RubinsteinHydrothermal alteration mapping using ASTER data in the Infiernillo porphyry deposit, ArgentinaOre Geol. Rev.322007275290
- J.InzanaT.KuskyG.HiggsR.TuckerSupervised classifications of Landsat TM band ratio images and Landsat TM band ratio image with radar for geological interpretations of central MadagascarJ. Afr. Earth Sci.3720035972
- J.W.BoardmanF.A.KruseR.O.GreenMapping target signatures via partial unmixing of AVIRIS dataSummaries, Proceedings of the Fifth JPL Airborne Earth Science Workshop, 23–26 JanuaryPasadena, California, JPL Publication 95-1, volume 119952326
- J.W.BoardmanLeveraging the high dimensionality of AVIRIS data for improved sub-pixel target unmixing and rejection of false positives: mixture tuned matched filteringSummaries, Proceedings of the Seventh Annual JPL Airborne Geoscience WorkshopPasadena, CA199855
- A.A.GreenM.BermanP.SwitzerM.D.CraigA transformation for ordering multispectral data in terms of image quality with implications for noise removalIEEE Trans. Geosci. Remote Sens.2619886574
- J.R.Ruiz-ArmentaR.M.Prol-LedesmaTechniques for enhancing the spectral response of hydrothermal alteration minerals in Thematic Mapper images of Central MexicoInt. J. Remote Sens.19199819812000
- H.WatanabeK.MatsuoRock type classification by multi-band TIR of ASTERGeosci. J.72003347358
- C.M.ChenComparison of principal component analysis and minimum noise fraction transformation for reducing the dimensionality of hyperspectral imageryGeogr. Res.332000163178