
 ?Mathematical formulae have been encoded as MathML and are displayed in this HTML version using MathJax in order to improve their display. Uncheck the box to turn MathJax off. This feature requires Javascript. Click on a formula to zoom.
Abstract
Thickness dependencies of the optical properties of as-deposited amorphous 30Li2O–10WO3–60B2O3 thin films prepared by electron beam evaporation on glass substrates at a base pressure of 9 × 10⁻⁷ Torr were studied. Glancing angle X-ray diffraction studies were performed to confirm the amorphous nature of the prepared films. The absorption coefficient α (and therefore the extinction coefficient k) was determined from the reflectance and transmission spectra in the strong absorption region. The dispersion of the refractive index is discussed in terms of the single-oscillator Wemple–DiDomenico model. The optical constants, such as optical band gap, Urbach energy, the average excitation energy Eo and the dispersion energy Ed, of the thin films were determined. The optical data revealed the existence of allowed indirect transitions.
1 Introduction
Transition metal ions (such as tungsten) containing borate glasses are suitable for optoelectronic devices because they exhibit nonlinear optical absorption, photochromism, electrochromism and thermochromism properties that can be used for technological applications [Citation1,Citation2]. The B2O3 glasses are well-known due to their large photo-induced second-order non-linear optical effects, which have strong bearing on the luminescent efficiencies of these glasses [Citation3]. Alkali borate glasses are well-known, due to their high transparency, low melting point, high thermal stability, and good rare earth ion solubility [Citation4,Citation5]. However, interest in these glasses as laser hosts is limited due to their high phonon energy. Nevertheless, the addition of certain transition metal oxides, such as WO3, to Li2O–B2O3 glass makes them more moisture-resistant; also, the phonon losses can also be minimised to a large extent. Tungsten-containing glasses have been studied due to the favourable properties of tungsten ions, such as high electro-negativity, polarisability, large ion radius, and changeable valence [Citation6,Citation7].
Glassy thin-film electrolytes are materials of considerable technological interest. Such thin films are used in the design of modern solid state batteries, electrochemical sensors, super capacitors, and electrochromic devices. The optical characterisation of thin films often requires the use of highly refined computer numerical techniques applied to both optical and reflection spectra [Citation8,Citation9]. In contrast, a relatively simple and straightforward method for determining the optical constants using only their transmission spectra has been used for obtaining the optical constants [Citation10].
The optical properties of oxide glasses, for example, excellent transmittance in the infra-red region, continuous shift of the optical absorption edge, and values of refractive index ranging between 2.0 and 3.5, as well as the strong correlation between the former properties and the chemical composition, explain the growing interest in these glassy materials for the manufacture of filters, anti-reflection coatings, and a wide range of optical devices [Citation11–Citation14]. This interest underlines the importance of the characterisation of these glassy materials through the determination of their optical constants, refractive index and extinction coefficient, as well as the corresponding optical band gaps.
The optical, microhardness and structural properties of thin films of borate based glasses were investigated by many authors [Citation15–Citation18]. Thin amorphous films of lithium borate [Citation19] and sodium borate glass systems were prepared by RF magnetron sputtering [Citation20]. Tungsten–tellurite [(100-x)TeO2–xWO3 (5 ≥ x ≤ 30 mol.%)] thin films doped with Er3+ prepared by radio-frequency magnetron sputtering have been studied using Raman scattering and photoluminescence techniques [Citation21,Citation22]. Recently, Ismail et al. [Citation23] reported the optical properties of tungsten-tellurite amorphous thin films prepared by electron-beam deposition. Thin films of binary and ternary tungstate glasses were prepared by electron beam evaporation [Citation24,Citation25]. The influences of the thickness and heat treatment on the photochromic effect of the doped and undoped WO3 films were studied by Avellaneda and Bulhoes [Citation26].
Recently, the authors reported the optical and structural properties of bulk xLi2O–(30-x)Na2O–10WO3–60B2O3 glasses [Citation27]. The optical energy band gaps for various indirect and direct (allowed and forbidden) transitions were determined. In the present work, we report the optical properties of lithium boro-tungstate amorphous thin films prepared by electron-beam deposition. The refractive index, absorption coefficient (therefore the extinction coefficient) and optical band gaps were determined from the reflectance and transmission spectra. To determine the refractive index, the film thickness of the samples must be sufficiently high.
2 Experimental
Bulk glass samples of composition Li2O–WO3–B2O3 were mixed at a molar ratio of Li2O:WO3:B2O3 of 30:10:60 using reagent-grade Li2CO3, H3BO3 and WO3 powders as the starting materials. These materials were weighed according to the atomic weight percentages to obtain the intended composition. These materials were subsequently milled together in an agate mortar for approximately 30 min. The milled mixtures were later placed into a porcelain crucible and subsequently melted in air in a preheated furnace with the temperature maintained in the range of 1100–1150 °C for approximately 60 min. These conditions were found to produce good homogeneity of the glass. Once complete fusion was achieved, the melt was quenched between two stainless steel plates pre-heated to approximately 200 °C. Later, the samples were annealed below their respective glass transition temperatures for approximately 24 h followed by slowly cooling them to laboratory temperature. The amorphous nature of the prepared glass samples was confirmed by X-ray diffraction analysis.
Thin films of the bulk glass composition 30Li2O–10WO3–60B2O3 of different thicknesses (500, 1000 and 1500 nm) were prepared using the electron-beam evaporation technique. A 3-kW electron gun (Telemark model 528) was used. To ensure good quality deposited films, Thermo Scientific glass microscope slides (19 mm × 25 mm × 1 mm) used as substrates were pre-cleaned using an ultrasonic hot bath, distilled water and pure acetone. Before depositing the films, the graphite boat containing the fragments of bulk glass was heated slowly at approximately 200 °C to release most of the moisture imbedded within the glass. After the oxygen release, the vacuum chamber was evacuated to a base pressure of approximately 1.2 × 10⁻⁴ Pa. During the deposition process, the substrates were kept at room temperature (300 K). The deposition rate was adjusted to be 5 nm/s. To obtain homogeneous and smooth films, the substrates were rotated at a constant speed. The thickness of the produced films was monitored during the deposition process using a quartz crystal thickness monitor to an accuracy of 5 nm. A Hitachi S-900 high-resolution, field-emission scanning electron microscope was used to confirm the thickness of the films. A direct pull test was used to measure the adhesion between the thin film and the substrate. The film thicknesses were checked independently after removal from the chamber using a F20 profile meter.
The amorphous character of the deposited films was examined via X-ray diffraction studies using a Brucker D8 X-ray diffractrometer equipped with a Cu–K Alpha radiation source of wavelength 1.54048 Å.
The optical transmittance, T, and the optical reflectance, R, of the deposited films were measured in the wavelength range of 400–900 nm using a computer-controlled UV–visible–NIR JASCO-670 double-beam spectrophotometer. The transmittance and reflectance spectra were obtained with a glass substrate in the reference arm. All of the optical measurements were performed at room temperature.
3 Results and discussion
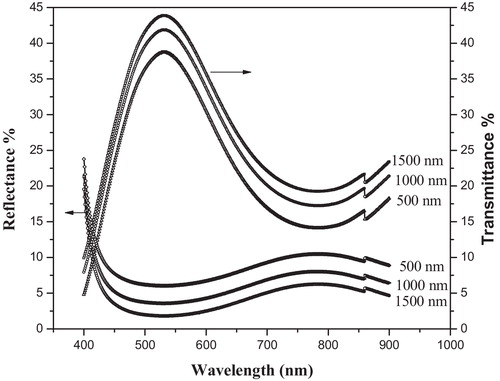
shows X-ray diffraction (XRD) patterns (diffractograms) for the deposited thin films. The diffractograms reveal the amorphous state of the films. The room temperature transmittance and reflectance spectra of films of different thicknesses (500, 1000 and 1500 nm) as a function of incident photon wavelength are shown in . The spectrum of the glass film exhibits a maximum transmittance of 42% in the visible region. The transmission curves can be divided broadly into regions of strong absorption near the optical band gap and a region with medium or weak absorption, where the effects due to interference are observed. The 4T2g → 4A2g transitions of B2O3 are known to occur at 588 nm [Citation28]. The 4T2g → 4A2g transition is observed as an absorption edge, whereas the long wavelength feature is suppressed by the interference effects. The other transitions are not observed because the interference pattern suppresses the effect due to these transitions.
Fig. 1 XRD patterns of 30Li2O–10WO3–60B2O3 glass films.
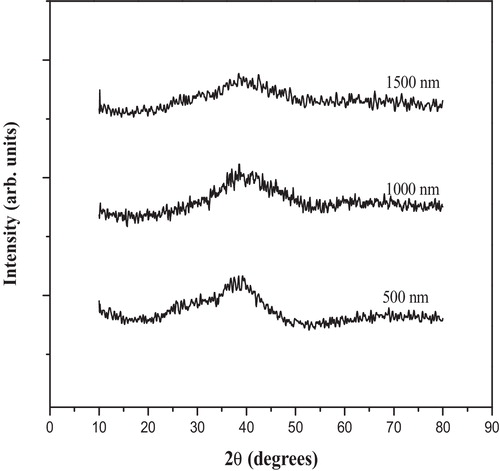
Fig. 2 The reflectance and transmittance spectra of the studied glass thin films.
The ability of a material to absorb light is measured by its optical absorption coefficient. Using the measured spectral reflectance (R) and transmittance (T) along with the film thickness d, the absorption coefficient (α) was calculated according to(1)
(1)
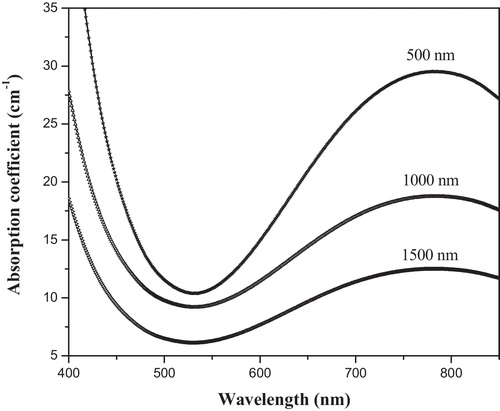
plots the optical absorption coefficient α of the studied films as a function of wavelength. The UV-absorption edges of the studied films are not sharply defined, which characterises the glassy nature of the samples. The figure reveals that the visible transmittance of the sample decreases and the positions of the fundamental absorption edge shift towards longer wavelengths in single alkali borate glasses with an increase in alkali content [Citation29,Citation30]. This shift to higher wavelength can be attributed to the increase in the non-bridging oxygen, which in turn causes a decrease in the bridging oxygen. Because the non-bridging and the bridging oxygen are bonded to only one and two frames of a network cations, the spectra of the present glass system reveal the presence of W5+ in addition to W6+ ions via a weak band region (800–1000 nm). This broad visible band is assumed to be due to the excitation of the W5+ ion from the ground state with the crystal-field parameters [Citation31].
Fig. 3 Optical absorption coefficient of the studied films as function of wavelength.
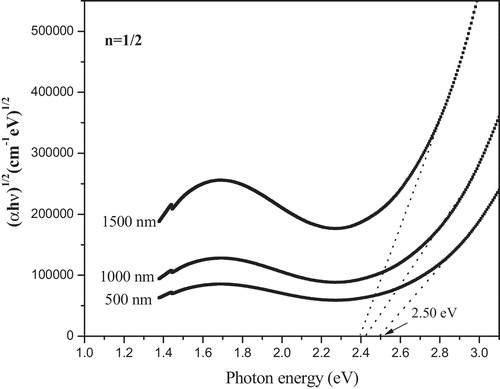
Davis and Mott [Citation32], Tauc and Menth [Citation33] related these data to the optical band gap, Eopt, through the following general relationship proposed for amorphous materials(2)
(2) where B is a constant related to the extent of the band tailing, and hν is the incident photon energy. The index n determines the type of electronic transitions causing the absorption, and takes on the values 1/2, 2, 2/3 and 1/3 for indirect allowed, direct allowed, direct forbidden and indirect forbidden transitions, respectively. According to the theory of the electronic structure of amorphous materials [Citation32], the absorption edge in the amorphous material is interpreted in terms of indirect allowed transitions. By plotting (αhν)n as a function of photon energy hν, one can find the optical energy band gap Eopt for all transitions. The values of the optical band gap energy Eopt can be obtained by extrapolating the absorption coefficient to zero absorption in the (αhν)n versus photon energy hν plots, as shown in . The optical band gap energies thus evaluated for the glass samples at different values of n are listed in . In the present study, the allowed indirect and direct band gap energies vary from 2.51 to 2.60 eV and 2.74 to 2.78 eV, respectively.
Table 1 Optical parameters of the 30Li2O–10WO3–60B2O3 glass films.
Fig. 4 Tauc plots (n = 1/2, 2, 2/3 and 1/3) for the 30Li2O–10WO3–60B2O3 glass films.
In the bulk 30Li2O–10WO3–60B2O3 glass sample, the allowed indirect and direct optical band gap energies are 3.77 eV and 3.90 eV, respectively [Citation27]. Because the obtained values of the optical band gap vary according to the selected value of the exponent n, one cannot practically decide which value of n should be selected. Therefore, Eq. Equation(2)(2)
(2) may be used only for the determination of the type of conduction mechanism, and Eopt itself should be determined using another parameter, i.e., the imaginary part of the dielectric constant (ɛ2), by which the exact value of exponent can be selected.
The complex refractive index and the dielectric function characterise the optical properties of glass. The values of the refractive index n and the extinction coefficient k can be determined from the theory of the reflectivity of light. According to this theory, the reflectance of light from a material can be expressed as [Citation34](3)
(3) where λ is the wavelength of the incident photon. The values of the refractive index were estimated by using the formula
(4)
(4) where R is reflectivity of the sample in the transparent region of glasses studied. shows the variation of the refractive index and of the extinction coefficient as a function of wavelength for different film thickness. The refractive index clearly decreases with increasing wavelength (low wavelength region) of the incident photon; in contrast the refractive index increases with the increase of film thickness. The extinction coefficient is the imaginary part of the complex index of refraction, which is also related to light absorption. The real and imaginary parts of the dielectric constant (ɛ1, ɛ2) are related to the n and k values by the following formulae:
(5)
(5)
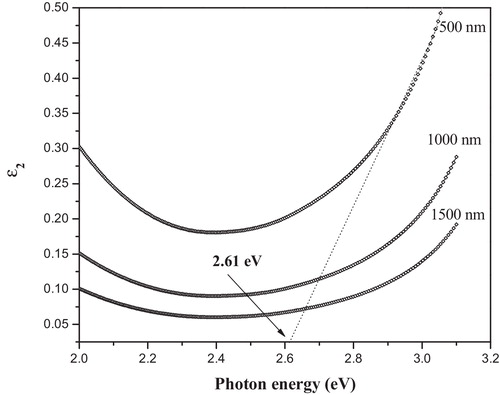
plots the variation of the imaginary part of the dielectric constant ɛ2 with photon energy for the studied glass. From the above figure, the optical band gap can be obtained by extrapolating the imaginary part of the dielectric constant to zero, as shown in the figure. A comparison of the optical energy gap values obtained from absorption spectra in the case of indirect allowed transition reveals that the values are in good agreement with the values estimated from the dielectric measurements ɛ2. Thus, the type of electronic transition in the present glass is indirectly allowed. From the optical absorption data, the values of the Urbach energy (ΔE) were determined (see ).
Fig. 5 The refractive index n and the extinction coefficient k as a function of wavelength.
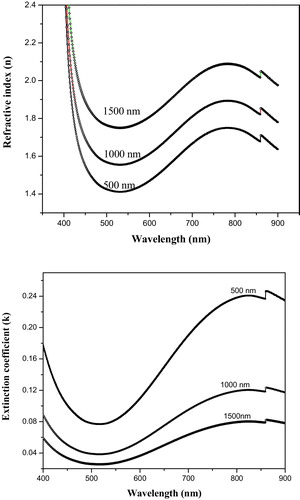
Fig. 6 Imaginary part of the dielectric constant ɛ2 as a function of photon energy.
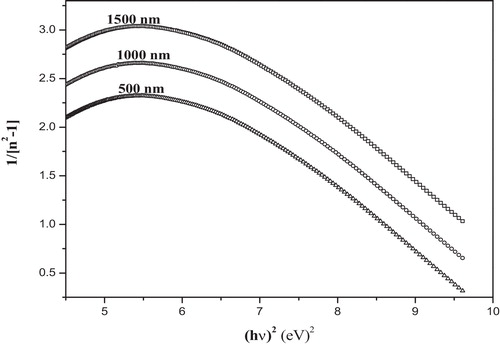
The refractive index variation with respect to photon energy could be obtained from the following relationship, based on the single oscillator approximation suggested by Wample [Citation35,Citation36]:(6)
(6) where n is the refractive index at a specific wavelength, E = hν is the photon energy, Eo is the average excitation energy for electronic transitions, and Ed is the dispersion energy. plots the variation of 1/(n2 − 1) with (hν)2. Eo and Ed can be determined from the linear fit of 1/(n2 − 1) versus (hν)2 plots (). The values of Eo and Ed thus evaluated are listed in . The data in this table clearly demonstrate that the average excitation energy Eo increases with film thickness.
Fig. 7 The relationship between 1/(n2 − 1) and (hν)2 for the studied glass films.
4 Conclusions
Thin films of 30Li2O–10WO3–60B2O3 glass (thicknesses of 500, 1000 and 1500 nm) were prepared via the electron beam evaporation technique and were found to exhibit minor delamination from the substrate. The amorphous character of the deposited films was confirmed using Glancing angle X-ray diffraction. The transmittance and reflectance spectra of thin films were used to determine the different optical constants in the wavelength range of 400–900 nm. The optical measurements indicate that the absorption mechanism is due to indirect transitions. The average excitation energy Eo was found to increase with film thickness.
Acknowledgments
One of the authors (A. Edukondalu) thanks Dr. V. Raghavendra Reddy and S. R. Potdar, Consortium for Scientific Research, Indore for providing access to the electron beam evaporation facility.
Notes
Peer review under responsibility of Taibah University
References
- G.PoirierF.C.CassanjesY.MessaddeqS.J.L.RibeiroJ. Non-Cryst. Solids3552009441
- M.RadaS.RadaE.CuleaJ. Non-Cryst. Solids35720112024
- I.V.KitykW.Imio”ekA.MajchrowskiE.MichalskiOpt. Commun.2192003421
- N.SogaK.HiraoM.YoshimotoH.YamamotoJ. Appl. Phys.6319884451
- S.M.KaczmarekOpt. Mater.192002189
- A.SheoranA.AgarwalS.SanghiV.P.SethS.K.GuptaM.AroraPhysica B40620114505
- J.PisarskaR.LisieckiW.Ryba-RomanowskiG.Dominiak-dzikT.GoryczkaL.GrobelnyW.A.PisarskiJ. Non-Cryst. Solids35720111228
- K.A.AlyA.M.AbousehlyM.A.OsmanA.A.OthmanPhysica B40320081848
- A.E.BekheetN.A.HegabM.A.AfifiH.E.AtyiaE.R.SharafAppl. Surf. Sci.22520094590
- K.A.AlyJ. Non-Cryst. Solids35520091489
- E.MárquezJ.Ramirez-MaloP.VillaresR.Jiménez-GarayP.J.S.EwenA.E.OwenJ. Phys. D251992535
- J.A.SavageInfrared Optical Materials and their Antireflection Coatings1985Adam HilgerBristol
- D.MinkovE.VatevaE.SkordevaD.ArsovaM.NikiforovaJ. Non-Cryst. Solids901987481
- E.R.ShaabanMater. Chem. Phys.1002006411
- G.KilicOptoelectron. Adv. Mater. Rapid Commun.420101111
- G.KilicS.PatM.Z.BalbagS.TemelS.KorkmazN.EkemOptoelectron. Adv. Mater. Rapid Commun.420101705
- M.JhaS.D.KshirsagarM.Ghanashyam KrishnaA.K.GanguliSolid State Sci.1320111334
- F.BerkemeierM.R.Shoar AbouzariG.SchmitzPhys. Rev. B762007024205
- K.H.JooP.VinatierB.PecquenardA.LevasseurH.J.SohnSolid State Ionics160200351
- C.LiuC.A.AngelJ. Chem. Phys.9319907378
- E.B.IntyushinA.V.NovikovThin Solid Film51620084194
- E.B.IntyushinYu.I.ChigirinskiiGlass Phys. Chem.312005162
- M.Emam-IsmailE.R.ShaabanM.El-HagaryI.ShaltoutPhilos. Mag.9020103499
- Y.MessaddeqS.J.L.RibeiroM.PoulainJ. Non-Cryst. Solids3512005293
- B.MontanariS.J.L.RibeiroY.MessaddeqM.S.LiG.PoirierAppl. Surf. Sci.25420082085
- C.O.AvellanedaL.O.S.BulhoesSolid State Ionics1652003117
- A.EdukondaluB.KavithaM.A.SameeS.K.AhmmedK.Syed RahmanSiva KumarJ. Alloys Compd.5522013157
- O.F.OzturkB.Zumreoglu-KaranS.OzcanZ.AnorgAllg. Chem.634200811271132
- R.SheibaniC.A.HogarthJ. Mater. Sci.261991429
- K.SubramanyamM.SalagramOpt. Mater.152000181
- G.L.FlowerG.S.BaskaranN.K.MohanN.VeeraiahJ. Mater. Chem. Phys.1002006211
- E.A.DavisN.F.MottPhilos. Mag.221970903
- J.TaucA.MenthJ. Non-Cryst. Solids81972569
- D.P.GosainT.ShimizuM.OhmuraM.SuzukiT.BandoS.OkanoJ. Mater. Sci.2619912371
- S.H.WemplePhys. Rev. B719733767
- S.H.WempleM.DiDomenicoPhys. Rev. B319711338
Appendix A
Supplementary data
Supplementary data associated with this article can be found, in the online version, at doi:10.1016/j.jtusci.2015.03.012.