
 ?Mathematical formulae have been encoded as MathML and are displayed in this HTML version using MathJax in order to improve their display. Uncheck the box to turn MathJax off. This feature requires Javascript. Click on a formula to zoom.
Abstract
The DFT-B3LYP method, with the base set 6-31G (d), was used to calculate several quantum chemical descriptors of 44 substituted flavonoids. The best descriptors were selected to establish the quantitative structure activity relationship (QSAR) of the inhibitory activity against aldose reductase using principal components analysis (PCA), multiple regression analysis (MLR), nonlinear regression (RNLM) and an artificial neural network (ANN). We propose a quantitative model according to these analyses, and we interpreted the activity of the compounds based on the multivariate statistical analysis.
1 Introduction
Aldose reductase (AR) is an essential enzyme of the polyol pathway and plays a vital role in the development of diabetic complications. Aldose reductase normally functions to reduce toxic aldehydes in the cell to inactive alcohols; however, when the glucose concentration in the cell becomes too high, aldose reductase also reduces the glucose to sorbitol, which is later oxidized to fructose. During the process of reducing high intracellular glucose to sorbitol, aldose reductase consumes NADPH. The accumulation of sorbitol can lead to an osmotic imbalance and may contribute to the progression of diabetic complications, such as cataracts, neuropathy, and nephropathy [Citation1–Citation3]. The inhibition of AR is a possible prevention or treatment for these effects [Citation4].
The inhibitory effect of aldose reductase was found in several structurally diverse classes of the compounds, including flavone coumarin, xanthine, naphthalene, flavone and quinazoline derivatives [Citation5–Citation8], but the flavonoid derivatives were more potent. A recent QSAR study on a data set of the inhibitory activities against the AR enzyme for the substituted flavonoids was reported using topology indices (JCIM 46, 90, 2006; JBMC 16, 7473, 2008) [Citation9,Citation10] and three-dimensional (3D)-QSAR methodologies (JMM 15, 841, 2009; JMC 6, 33, 2010) [Citation11,Citation12].
Flavonoids are a group of naturally occurring polyphenolic compounds that are ubiquitously found in fruits and vegetables [Citation13–Citation15]. Chemically, flavonoids are benzo-γ-pyrone derivatives, and they have potential application for a variety of pharmacological targets. The structural diversity of these compounds provides anti-hepatitis, antibacterial, anti-inflammatory, anti-mutagenic, anti-allergic, and anti-viral activities [Citation16–Citation18].
The increase in the speed and efficiency of drug discovery has been aided by large investments from major pharmaceutical companies, with the primary aim of reducing the cost per synthesized compound or assay. Computational models that predict the biological activity of compounds based on their structural properties are powerful tools to design highly active molecules. In this sense, quantitative structure–activity relationship (QSAR) studies have been successfully applied for modeling the biological activities of natural and synthetic chemicals [Citation19].
The objective of this study was to develop predictive QSAR models of the inhibitory activity of flavonoid derivatives against the aldose reductase enzyme using several statistical tools, such as principal components analysis (PCA), multiple linear regression (MLR), nonlinear regression (RNLM) and artificial neural network (ANN) calculations. To test the performance and the stability of this model, we opted for a validation method.
2 Material and methods
2.1 Data sources
In the present study, we selected 44 substituted flavonoids with activities reported in the literature by Stefanic-Petek et al. [Citation20]. The activities are reported as log (1/IC50) or pIC50 values, where IC50 refers to the molar concentration of the compound required for 50% inhibition of AR activity. Stefanic-Petek et al. initially proposed 75 compounds, and the remaining compounds had structures that differed from the structures required for this study. represents the basic structure of the flavonoids, and shows the substituted compounds studied and experimental activities corresponding to the pIC50. For the proper validation of our data set with a QSAR model, the 44 substituted flavonoids were divided into training and test sets. A total of 35 molecules were placed in the training set to build the QSAR models, whereas the remaining 9 molecules composed the test set. The division was performed by random selection.
Fig. 1 Chemical structure of the studied compounds.
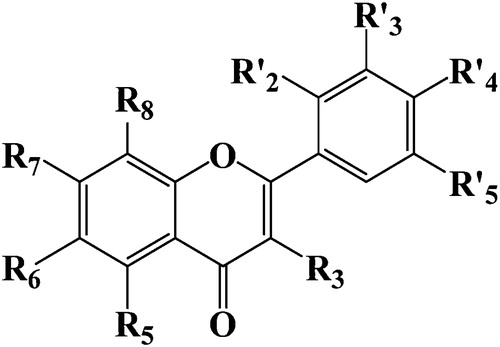
Table 1 Observed activity of studied flavonoids derivatives.
2.2 Molecular descriptors
Currently, there are a large number of molecular descriptors used in QSAR studies. After validation, the findings can be used to predict the activity of untested compounds.
The computation of electronic descriptors was performed using the Gaussian03W package [Citation21]. The geometries of the 44 substituted flavonoids against aldose reductase were optimized with the DFT method with the B3LYP functional and 6-31G (d) base set. Then, several related structural parameters were selected from the results of the quantum computation as follows: highest occupied molecular orbital energy (EHOMO), lowest unoccupied molecular orbital energy (ELUMO), dipole moment (DM), total energy (ET), absolute hardness (η), absolute electronegativity (χ) and reactivity index (ω) [Citation22]. The η, χ and ω were determined using the following equations:
ACD/ChemSketch program [Citation23] was used to calculate the topological descriptors, as follows: molar volume (MV), molecular weight (MW), molar refractivity (MR), parachor (Pc), density (D), refractive index (n) and surface tension (γ).
2.3 Statistical analysis
The objective of quantitative structure–activity relationship (QSAR) analysis is to derive empirical models that relate the biological activity of compounds to their chemical structures. In this QSAR analysis, quantitative descriptors are used to describe the chemical structure and analysis results in a mathematical model describing the relationship between the chemical structure and biological activity. To explain the structure–activity relationship, these 14 descriptors are calculated for the 44 molecules using the Gaussian03W and ChemSketch programs.
The quantitative descriptors of the substituted flavonoids are studied using statistical methods based on principal component analysis (PCA) [Citation24] with the software XLSTAT version 2013 [Citation25]. PCA is a useful statistical technique for summarizing all of the information encoded in the structures of the compounds. It is also helpful for understanding the distribution of the compounds [Citation26]. This is an essentially descriptive statistical method that aims to present, in graphic form, the maximum information contained in the data, as shown in and .
Multiple linear regression (MLR) analysis with descendent selection and elimination of variables is used to model the structure–activity relationship. It is a mathematical technique that minimizes the difference between the actual and predicted values. Additionally, it selects the descriptors used as the input parameters in the multiple nonlinear regression (MNLR) and artificial neural network (ANN).
MLR and MNLR are generated using the software XLSTAT version 2013. To predict the pIC50, equations are justified by the correlation coefficient (R), the mean squared error (MSE), Fisher's criterion (F) and the significance level (P).
The ANN analysis is performed using the Matlab software version 2009a Neural Fitting tool (nftool) toolbox on a data set of the compounds [Citation27]. A number of individual models of ANN were designed, built and trained. Three components constitute a neural network, the processing elements or nodes, the topology of the connections between the nodes, and the learning rule by which new information is encoded in the network. Although there many different ANN models, the most frequently used type of ANN in QSAR is the three-layered feed forward network [Citation28]. In this type of network, the neurons are arranged in layers as an input layer, one hidden layer and an output layer. Each neuron in any layer is fully connected with the neurons of a succeeding layer and no connections are between neurons belonging to the same layer.
According to the supervised learning adopted here, the networks are taught by providing examples of input patterns and the corresponding target outputs. Through an iterative process, the connection weights are modified until the network gives the desired results for the training set of data. A backpropagation algorithm is used to minimize the error function. This algorithm was described previously with a simple example of an application [Citation29], and the details of this algorithm are provided elsewhere [Citation30].
Testing the stability, predictive power and generalization ability of the models are very important steps in a QSAR study. For the validation of the predictive power of a QSAR model, two basic principles, internal validation and external validation, are available. Cross-validation is one of the most popular methods for internal validation. In this study, the internal predictive capability of the model was evaluated using leave-one-out cross-validation (). A good
often indicates good robustness and the high internal predictive power of a QSAR model. However, recent studies [Citation31] indicate that there is no evident correlation between the value of
and the actual predictive power of a QSAR model, suggesting that the
remains inadequate as a reliable estimate of the model's predictive power for all new chemicals. To determine both the generalizability of QSAR models for new chemicals and the true predictive power of the models, statistical external validation is applied during the model development step by properly using a prediction set for validation.
3 Results and discussion
3.1 Data set for analysis
A QSAR study was performed for a series of 44 substituted flavonoids against aldose reductase, as reported previously [Citation20], to determine a quantitative relationship between the structure and biological activity. The values of the 14 descriptors are shown in .
Table 2 Values of the obtained parameters of the studied substituted flavonoids.
3.2 Principal component analysis
The total of the 14 descriptors coding the 44 molecules was submitted to principal components analysis (PCA) [Citation32]. The first three principal axes are sufficient to describe the information provided by the data matrix. Indeed, the percentages of the variance are 47.32%, 26.41% and 10.08% for the axes F1, F2 and F3, respectively. The total information is estimated as 83.81%.
The principal component analysis (PCA) [Citation33] was conducted to identify the link between the different variables. The correlations between the fourteen descriptors are shown in as a correlation matrix.
Table 3 Correlation matrix between different obtained descriptors.
The obtained matrix provides information on the high or low interrelationship between the variables. In general, good co-linearity (r > 0.5) was observed between most of the variables. A high interrelationship was observed between ELUMO and ω (r = −0.999), and a low interrelationship was observed between ω and D (r = 0.001).
3.3 Multiple linear regressions MLR
Many attempts have been made to develop a relationship with the indicator variable of biological activity, pIC50, but the best relationship obtained using this method is only one corresponding to the linear combination of several descriptors selected, the total energy ET, the energy EHOMO, the energy ELUMO, the molar volume (MV), the refractive index (n) and the surface tension (γ).
The resulting equation is as follows:(1)
(1)
N = 35; R = 0.758; ; MSE = 0.552; F = 6.311; P < 0.0001.
In the equation, N is the number of compounds, R is the correlation coefficient, MSE is the mean squared error, F is the Fisher's criterion and P is the significance level. A higher correlation coefficient and lower mean squared errors indicate that the model is more reliable. A P that is smaller than 0.05 indicates that the regression equation is statistically significant. The QSAR model expressed by Eq. Equation(1)(1)
(1) is cross validated by its appreciable
values (
) obtained by the leave-one-out (LOO) method. A value of
greater than 0.5 is the basic requirement for qualifying a QSAR model as valid [Citation31].
The elaborated QSAR model reveals that the inhibitory activity against aldose reductase may be explained by a number of electronic and topologic factors. The negative correlation of the electronic descriptors (ET, EHOMO) and the topologic descriptors (MV, γ) with the activity pIC50 shows that an increase in the values of these factors indicates a decrease in the value of the pIC50, whereas a positive correlation of the energy ELUMO and refractive index (n) with the activity pIC50 reveals an increase in the value of the pIC50.
Based on Eq. Equation(1)(1)
(1) , we explain the mechanisms of inhibitory activity of the substituted flavonoids against aldose reductase as follows:
| (1) | The low total energy ET is generally associated with the high chemical stability of the compound. Therefore, the inhibitory activity varies inversely with the total energy ET of the substituted flavonoids. Consequently, there is chemical stability against aldose reductase. | ||||
| (2) | EHOMO is a quantum chemical parameter that is often associated with the electron donating ability of the molecule. The lower the EHOMO, the weaker the donating electron ability, showing that the electrophilic reaction occurs more easily and the inhibitory activity of the substituted flavonoids is higher. Accordingly, molecules with large values of EHOMO result in small values of the pIC50. | ||||
| (3) | ELUMO is a global molecular property that describes the electrophilicity of a compound in general terms and is also a measurement of the ability of the molecule to act as an electron acceptor. Good correlation with pIC50 and an obvious correlation with ELUMO demonstrate that the inhibitory activity of the substituted flavonoids is affected by electric properties. | ||||
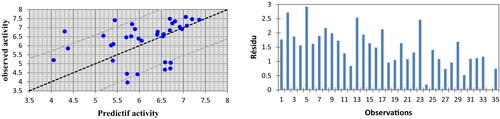
The correlations of the predicted and observed activities and the residual graph of absolute numbers are illustrated in . The descriptors proposed in Eq. Equation(1)(1)
(1) by MLR are, therefore, used as the input parameters in the multiple nonlinear regressions (MNLR) and artificial neural network (ANN).
Fig. 2 Graphical representation of calculated and observed activity and the residues values calculated by MLR.
3.4 Multiple nonlinear regressions (MNLR)
We also used the nonlinear regression model to improve the structure activity in a quantitative manner, taking into account several parameters. This is the most common tool for the study of multidimensional data. We applied this to the data matrix constituted from the descriptors proposed by the MLR corresponding to the 35 compound training set.
The resulting equation is as follows:(2)
(2)
The obtained parameters describing the topological and the electronic aspects of the studied molecules are as follows:
N = 35; R = 0.787; ; MSE = 0.628.
The QSAR model expressed by Eq. Equation(2)(2)
(2) is cross-validated by its appreciable
values (
) obtained using the leave-one-out (LOO) method. A value of
greater than 0.5 is the basic requirement for qualifying a QSAR model as valid [Citation31].
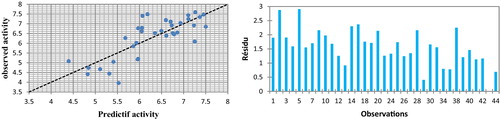
The correlations of the predicted and observed activities and the residual graph of the absolute numbers are illustrated in .
Fig. 3 Graphical representation of calculated and observed activity and the residues values calculated by MNLR.
3.5 Artificial neural networks (ANN)
Neural networks (ANN) can generate predictive models of the quantitative structure–activity relationship (QSAR) between a set of molecular descriptors obtained from the MLR and observed activity. The ANN calculated activity model was developed using the properties of several studied compounds. The correlation of the predicted and observed activities and the residual graph of the absolute numbers are illustrated in .
Fig. 4 Graphical representation of calculated and observed activity and the residues values calculated by ANN.
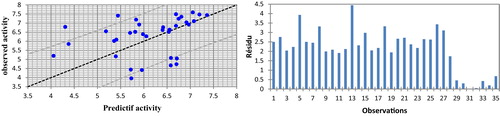
N = 35; R = 0.900; ; MSE = 0.458.
The obtained squared correlation coefficient (R) value is 0.900 for this data set of substituted flavonoids. This confirms that the artificial neural network (ANN) results are the best to build the quantitative structure activity relationship model. Furthermore, the high value (
) shows that the obtained QSAR model can predict the inhibitory activity against aldose reductase.
3.6 External validation
To estimate the predictive power of the MLR, MNLR and ANN models, we must use a set of compounds that have not been used as the training set to establish the QSAR model. The models established in the computation procedure using the 35 substituted flavonoids are used to predict the activity of the remaining 9 compounds. The main performance parameters of the three models are shown in . As seen from this table, the statistical parameters of the ANN model are better than the other models.
Table 4 Performance comparison between models obtained by MLR, RNLM and ANN.
We assessed the best linear QSAR regression equations established in this study. Based on this result, a comparison of the quality of the MLR and MNLR models shows that the ANN model has a significantly better predictive capability because the ANN approach yields better results than those of MLR and MNLR. ANN establishes a satisfactory relationship between the molecular descriptors and the activity of the studied compounds.
4 Conclusion
In this study, we investigated the QSAR regression to predict the inhibitory activity of flavonoid derivatives against aldose reductase.
The studies regarding the quality of the three models constructed in the study have good stabilities and great predictive powers. Moreover, compared to the MLR and MNLR models, the ANN model is better and is an effective tool to predict the inhibitory activity of the flavonoid derivatives. Furthermore, using the ANN approach, we established a relationship between several descriptors and inhibition values, pIC50, of several organic compounds based on the substituted flavonoids in a satisfactory manner.
The accuracy and predictability of the proposed models were illustrated by comparing key statistical indicators, such as the R or R2 of different models obtained using different statistical tools and different descriptors, as shown in . To validate these results, we generated two test sets, as shown in .
Table 5 Observed values and calculated values of pIC50 according to different methods.
Table 6 Results of test sets generated.
Finally, we conclude that the studied descriptors, which are sufficiently rich in chemical, electronic and topological information to encode the structural features, may be used with other descriptors for the development of predictive QSAR models.
Acknowledgments
We are grateful to the “Association Marocaine des Chimistes Théoriciens” (AMCT) for its pertinent help concerning the programs.
Notes
Peer review under responsibility of Taibah University
Related Research Data
References
- Z.KyselovaM.StefekV.BauerPharmacological prevention of diabetic cataractJ. Diabetes Complicat.182004129140
- Y.HamadaJ.NakamuraClinical potential of aldose reductase inhibitors in diabetic neuropathyTreat. Endocrinol.32004245255
- J.M.ForbesM.T.CoughlanM.E.CooperOxidative stress as a major culprit in kidney disease in diabetesDiabetes57200814461454
- S.MiyamotoRecent advances in aldose reductase inhibitors: potential agents for the treatment of diabetic complicationsExpert Opin. Ther. Patents122002621631
- P.E.KadorN.E.SharplessStructure–activity studies of aldose reductase inhibitors containing the 4-oxo-4H-chromen ring systemBiophys. Chem.819788185
- P.E.KadorJ.H.KinoshitaN.E.SharplessAldose reductase inhibitors: a potential new class of agents for the pharmacological control of certain diabetic complicationsJ. Med. Chem.281985841849
- J.R.PfisterW.E.WymannJ.M.MahoneyL.D.WaterburySynthesis and aldose reductase inhibitory activity of 7-sulfamoylxanthone-2-carboxylic acidsJ. Med. Chem.23198012641267
- M.S.MalamasJ.MillenQuinazoline acetic acids and related analogues as aldose reductase inhibitorsJ. Med. Chem.34199114921503
- Y.S.PrabhakarM.K.GuptaN.RoyY.VenkateswarluA high dimensional QSAR study on the aldose reductase inhibitory activity of some flavones: topological descriptors in modeling the activityJ. Chem. Inf. Model.4620068692
- A.G.MercaderP.R.DuchowiczF.M.FernandezE.A.CastroD.O.BennardiJ.C.Autinoet al.QSAR prediction of inhibition of aldose reductase for flavonoidsJ. Bioorg. Med. Chem.16200874707476
- H.LiuS.LiuL.QinL.MoCoMFA, CoMSIA analysis of 2,4-thiazolidinediones derivatives as aldose reductase inhibitorsJ. Mol. Model.152009837845
- S.TharejaS.AggarwalT.R.BhardwajM.Kumar3D-QSAR studies on a series of 5-arylidine-2,4-thiazolidinediones as aldose reductase inhibitors: a self-organizing molecular field analysis approachMed. Chem.620103036
- G.D.CarloN.MascoloA.A.IzzoF.CapassoFlavonoid: old and new aspects of a class of natural therapeutic drugsLife Sci.651999337353
- P.C.H.HaollmanI.C.W.ArtsFlavonols, flavones and flavanols – nature, occurrence and dietary burdenJ. Sci. Food Agric.80200010811093
- S.A.AherneN.M.O’BrienDietary flavonols: chemistry, food content, and metabolismNutrition1820027581
- O.P.AgarwalThe anti-inflammatory action of nepitrin, a flavonoidAgents Actions121982298302
- M.K.ChurchCromoglycate-like anti-allergic drugs: a reviewDrugs Today141978281341
- B.F.RasulevN.D.AbdullaevV.N.SyrovJ.LeszczynskiA quantitative structure–activity relationship (QSAR) study of the antioxidant activity of flavonoidsQSAR Comb. Sci.24200510561065
- H.KubinyiQSAR: Hansch analysis and related approachesR.MannholdP.Krokgsgaard-LarsenH.TimmermanMethods and Principles in Medicinal Chemistry1993VCHWeinheim
- A.Stefanic-PetekA.KrbavcicT.SolmajerQSAR of flavonoids. 4. Differential inhibition of aldose reductase and p56lck protein tyrosine kinaseCroat. Chem. Acta752002517529
- M.J.FrischGaussian 03 Revision B.012003Gaussian, Inc.Pittsburgh, PA
- U.SakarR.ParthasarathiV.SubramanianP.K.ChattarajiToxicity analysis of polychlorinated dibenzofurans through globalJ. Mol. Des. IECMD2004124
- Advanced Chemistry Development, Inc., Toronto, Canada, 2009 (www.acdlabs.com/resources/freeware/chemsketch/).
- M.LarifA.AdadR.HmammouchiA.I.TaghkiA.SoulaymaniA.ElmidaouiM.BouachrineT.LakhlifiBiological activities of triazine derivatives combining DFT and QSAR resultsArab. J. Chem.201610.1016/j.arabjc.2012.12.033 (in press)
- XLSTAT. software2013XLSTAT Companyhttp://www.xlstat.com
- S.ChtitaM.LarifM.GhamaliM.BouachrineT.LakhlifiDFT-based QSAR studies of MK801 derivatives for non competitive antagonists of NMDA using electronic and topological descriptorsJ. Taibah Univ. Chem.922014143154
- A.AdadM.LarifR.HmamouchiM.BouachrineT.LakhlifiJ. Comp. Methods Mol. Des.4320147283
- R.HmamouchiM.LarifA.AdadM.BouachrineT.LakhlifiJ. Comp. Methods Mol. Des.4320146171
- D.CherqaouiD.VilleminJ. Chem. Soc. Faraday Trans.90199497102
- J.A.FreemanD.M.SkapuraNeural Networks, Algorithms, Applications and Programming Techniques1991Addison-Wesley Publishing CompanyReading, MA
- A.GolbraikhA.TropshaBeware of q2!J. Mol. Graph. Model.202002269276
- Software STATITCF1987Technical Institute of Cereals and FodderParis, France
- A.OusaaB.ElidrissiM.GhamaliS.ChtitaM.BouachrineT.LakhlifiJ. Comp. Methods Mol. Des.4320141018