
Abstract
Clotrimazole (CLZ) is an imidazole derivative that is therapeutically used as an antifungal drug. The routine control analysis of CLZ requires rapid, reliable, accurate and precise methods for the quantification of the drug in its pharmaceutical formulations. Spectrophotometric methods are presented for the determination of the antifungal agent that are based on the charge transfer complexation reaction of CLZ with the π-acceptors tetracyanoethylene (TCE) and 7,7′,8,8′-tetracyanoquinodimethane (TCNQ). The formation of coloured complexes was quantitated at 396 nm and 842 nm for CLZ-TCE and CLZ-TCNQ, respectively, which enabled the development of simple and accurate spectrophotometric methods for the analysis of CLZ in pure drug substances and its pharmaceutical products. Under the optimum reaction conditions, linear relationships with appreciable correlation coefficients (0.9985–0.9994) were found between the absorbance at the relevant maxima and the concentrations of CLZ in the range of 5.00–35.00 μg mL−1 for CLZ-TCE and 1.00–25.00 μg mL−1 for CLZ-TCNQ. The molar absorptivities and Sandell’s sensitivity values were also statistically evaluated. The proposed methods were successfully applied to analyze CLZ in topical creams and sterile solutions with mean recovery percentages in the range of 99.60–100.20%, which indicated no interference from the inactive ingredients. Furthermore, the charge transfer complexes of CLZ were also characterized by FT-IR spectroscopy.
1 Introduction
Azole compounds are commonly used as antifungal agents, and CLZ is an imidazole derivative possessing effective antimycotic activity. CLZ is chemically designated 1-[(2-chlorophenyl)(diphenyl)methyl]-1H-imidazole (). It is used for the prevention of skin and vaginal infections due to dermatophytes and yeasts. The drug CLZ has broad-spectrum activity against fungal strains that cause peripheral fungal infections [Citation1]. CLZ exerts fungistatic activity at low concentrations by obstructing the de novo synthesis of sterols, which is required for the formation of fungal cell membranes [Citation2]. It also plays a fungicidal role by causing direct damage to the cell membranes of active organisms by impairing the biosynthesis of membrane lipids through inhibition of a fungal cytochrome P450 enzyme involved in the synthesis of ergosterol [Citation3].
Fig. 1 Chemical structure of clotrimazole.
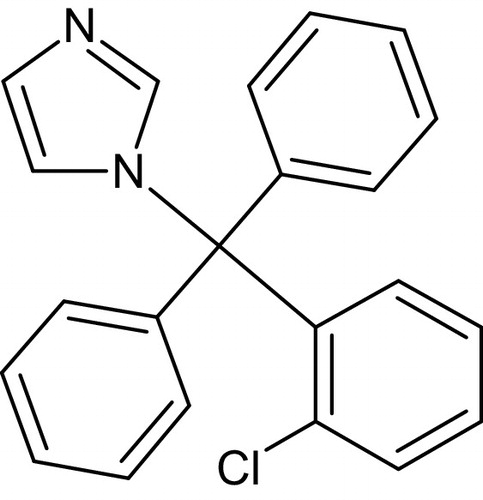
Table 4 Characteristic peaks of the CLZ and the π-acceptors.
Table 5 Infrared frequenciesTable Footnotea (cm−1) and their band assignmentsTable Footnoteb for the CLZ, free acceptors, and CLZ-TCE and CLZ-TCNQ complexes.
In recent years, the application of CLZ is increasing due to its effectiveness in the treatment of mycoses, especially in patients with low immunity. It is one of the commonly used imidazoles for the treatment of vulvovaginal candidiasis, and it persists in body fluids for 3 days following a single treatment. The increased efficacy, better patient compliance and good safety profile of CLZ makes it a successful therapy for curing fungal infections compared to other antifungal agents [Citation4]. Considering the potential pharmaceutical importance of CLZ, various analytical methods have been reported for the quality control analysis of CLZ in pharmaceutical preparations, which includes titrimetry [Citation5], high-performance liquid chromatography [Citation6–Citation8], high-performance thin layer chromatography [Citation9,Citation10], spectrofluorimetry [Citation11], and derivative spectrophotometry [Citation12,Citation13]. The UV-derivative methods lack sensitivity and possible spectral interferences could arise from inactive ingredients. Most of the reported procedures are often time consuming, require expertise, and utilize expensive reagents and techniques. Furthermore, the HPLC procedures cannot be conveniently applied for the determination of CLZ in creams as the oily excipients could possibly clog the column.
The UV–vis spectrophotometric technique is widely used for pharmaceutical analysis, and a literature survey also revealed visible spectrophotometric methods [Citation14–Citation17] for the quantitative determination of CLZ. However, many of the reported visible spectrophotometric methods require strict control of pH and cumbersome extractive procedures, which has limited its application in routine analysis of the drug. Quantification of CLZ has also been done using charge transfer methods [Citation18–Citation20], the main feature of which is the appearance of intense coloured absorption bands in the visible region of the electromagnetic spectrum. In continuation of studies on charge transfer complexes of CLZ, the present paper is aimed at developing fast and simple charge transfer methods based on complexation of CLZ with TCE and TCNQ for the quantitative determination of the drug in commercially available formulations.
2 Experimental
2.1 Instrumentation
Analytical measurements were carried out using a SHIMADZU UV-2550 dual beam spectrophotometer (Shimadzu Corporation, Japan) with 1 cm matched quartz cells. The infrared spectra for the solid charge transfer products were recorded within the range of 4000–400 cm−1 on a SHIMADZU FT-IR-Prestige-21 spectrometer (Shimadzu Corporation, Japan).
2.2 Materials
The drug CLZ in its pure form was received from CAD Pharma Inc., Bangalore, India. The following pharmaceutical dosage forms were obtained from commercial sources: Surfaz® 1.0% topical solution (Franco-Indian Remedies Pvt. Ltd., Mumbai, India), labelled to contain 10 mg of clotrimazole per mL, and Coniderm® 1% topical agent (Adonis Laboratories Pvt. Ltd., Mumbai, India), labelled to contain 10 mg of clotrimazole per gram of the cream.
2.3 Reagents and standards
All reagents used in the present investigation were of analytical grade. A solution of 0.02% (w/v) TCE (Sigma Aldrich, Mumbai, India) and 0.1% (w/v) TCNQ (Sigma Aldrich, Mumbai, India) was prepared by dissolving 0.02 g and 0.1 g in 100 mL of acetonitrile. A stock solution of 1000 μg mL−1 of CLZ was prepared by accurately weighing approximately 0.1 g of CLZ and dissolving in 50 mL of acetonitrile. The solution was then transferred to 100 mL standard flasks and diluted to the mark with the same solvent. The stock solution was further diluted with the same solvent to obtain the working concentrations in the range of 1.00–35.00 μg mL−1.
2.4 Analytical procedures
Aliquots equivalent to standard CLZ (5.00–35.00 μg mL−1; 1.00–25.00 μg mL−1) were transferred into two separate series of 10 mL calibrated flasks. To each series, 2 mL of 0.02% TCE or 0.1% TCNQ was added to separate flasks. The test tubes were swirled for 5 min, and the solutions were made up to the mark with acetonitrile. The absorbance was measured at 396 nm and 842 nm for CLZ-TCE and CLZ-TCNQ, respectively, against the appropriate reagent blank treated similarly.
2.5 Determination of the stoichiometry of the charge-transfer complexes
Stock solutions with equimolar concentrations of CLZ, TCE and TCNQ (1 × 10⁻³ M each) were prepared in acetonitrile. A series of solutions was prepared in two different sets of 10 mL volumetric flasks by mixing complimentary proportions of the drug and reagent solutions (0.5:4.5, 1.5:3.5, and 4.5:0.5). The solutions were then diluted to volume with the same solvent, and the absorbance was measured at 396 nm and 842 nm for the CLZ-TCE and CLZ-TCNQ complexes, respectively, each against its appropriate reagent blank.
2.6 Assay of pharmaceutical formulations
2.6.1 Cream
An amount of cream equivalent to 10 mg of drug was weighed and dissolved in 50 mL of acetonitrile. The cream formulation was melted in a water bath at 40 °C and stirred for 5 min. Then, it was filtered through Whatman No. 40 filter paper into a 100 mL standard flask and diluted to volume with the same solvent. An appropriate aliquot of the solution was analyzed using the proposed methods.
2.6.2 Topical solution
An aliquot of solution equivalent to 10 mg of drug was transferred to a 100 mL standard flask and dissolved in acetonitrile. The contents of the flask were swirled for 5 min and completed to volume with the same solvent. An aliquot of the solution was subjected to analysis using the proposed methods.
2.7 Synthesis of solid charge-transfer complexes
The solid charge transfer complexes (1:1) of CLZ with acceptors were prepared by mixing a saturated solution of CLZ (0.5 mmol) with TCE and TCNQ (0.5 mmol). The solutions were stirred in a magnetic stirrer at room temperature for 10 min and 25 min for CLZ-TCE and CLZ-TCNQ, respectively, and the formed complexes separated immediately. The products were then filtered and washed several times with a small amount of acetonitrile and dried.
3 Results and discussion
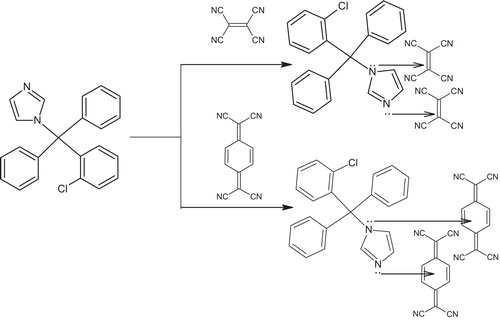
The molecular interactions between electron donors and acceptors are associated with the formation of coloured charge transfer complexes, absorbing radiation from the visible region of the spectrum. The absorption spectrum of CLZ in acetonitrile is shown in , where CLZ exhibits a peak at 238 nm. The reaction of CLZ with π-acceptors TCE and TCNQ involves n to π interactions, which yields the deep yellow CLZ-TCE complex and the green CLZ-TCNQ complex; these compounds absorb maximally at 396 nm and 842 nm, respectively (). These wavelengths are selected in order to obtain the highest sensitivity of the proposed methods. The drug CLZ has two electron donation sites (tertiary nitrogen) acting as a powerful electron donor that donates its electrons to the TCE and TCNQ acceptor molecules, and this interaction leads to pronounced bathochromic shifts indicating the formation of charge transfer complexes. The probable mechanism for the formation of the complexes is shown in .
Fig. 2 Absorption spectra of (a) CLZ (1000 μg mL−1), (b) CLZ-TCE (35 μg mL−1) and (c) CLZ-TCNQ (25 μg mL−1).
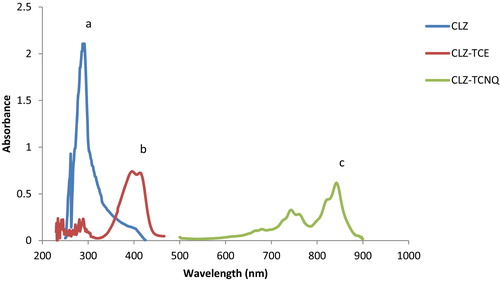
Fig. 3 Probable reaction mechanisms for the formation of the CLZ-TCE and CLZ-TCNQ complexes.
3.1 Optimization of the experimental conditions
The proposed spectrophotometric procedures were carefully optimized to obtain the maximum sensitivity and selectivity in the analysis of CLZ in its pharmaceutical dosage forms. The optimization of the experimental conditions depends on several variables, and the one variable at a time (OVAT) approach was considered to be effective in establishing the optimal conditions for the assay of CLZ by the proposed methods.
3.1.1 Effect of solvents
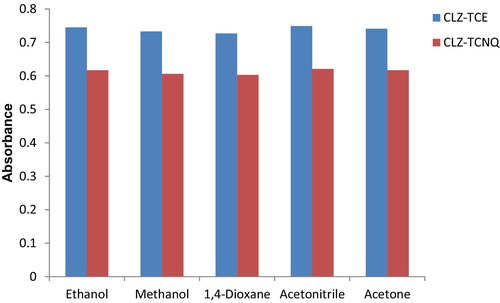
The evaluation of the effect of the solvent nature on the formation of the coloured complexes was performed by selecting different solvents, such as methanol, ethanol, 1,4-dioxane, acetonitrile and acetone, to carry out the reaction. Among the different solvents studied, acetonitrile was chosen as the best solvent for carrying out the proposed reactions, as it offered good solvating capacity and has high relative permittivity. The effect of the solvents on the formation of CLZ-TCE and CLZ-TCNQ complexes are shown in .
Fig. 4 Effect of solvent on the reaction of CLZ with TCE and TCNQ.
3.1.2 Effect of reagent volume or concentration
The optimum volumes or concentrations that gave maximum sensitivity and colour formation were 2 mL each of 0.02% TCE and 0.1% TCNQ solution in acetonitrile for CLZ-TCE and CLZ-TCNQ, respectively. Higher volumes of each of the π-acceptor reagents did not produce stable absorbance values and did not affect the colour intensity.
3.1.3 Effect of time on complex formation
The optimum reaction time was studied by following the colour intensity at the selected wavelengths at room temperature. Complete colour development was attained after 10 min and 25 min for the CLZ-TCE and CLZ-TCNQ complexes, respectively. All measurements were carried out after 2 min of mixing the solutions at room temperature, and thereafter, stable absorbance values were obtained for 24 h for both of the proposed methods.
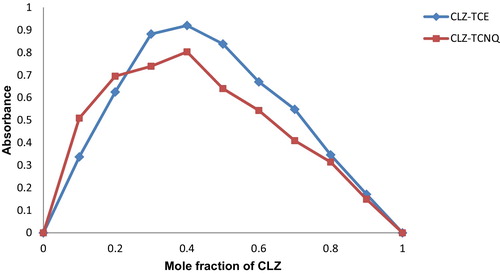
3.2 Stoichiometric relationship
The compositions of the charge transfer complexes were determined by Job’s method of continuous variation [Citation21]. The results indicated that the CLZ-TCE and CLZ-TCNQ complexes showed 1:2 molar ratios. The stoichiometric relationship is shown in .
Fig. 5 Continuous variation plots for the CLZ-TCE and CLZ-TCNQ complexes.
3.3 Validation of analytical methods
The validation of the proposed methods were done according to the ICH guidelines for validation of analytical procedures [Citation22], which included the evaluation of linearity, sensitivity, accuracy, precision, and limits of detection and quantification.
3.3.1 Linearity and sensitivity
As seen from the spectral data in , a linear plot was found between the absorbance and the concentration of the drug at λmax 396 nm and 842 nm in the ranges of 5.00–35.00 μg mL−1 and 1.00–25.00 μg mL−1 for CLZ-TCE and CLZ-TCNQ, respectively (). The regression equation for CLZ-TCE was found to be Y = 0.0262 + 0.0215X (r = 0.2271) and Y = 0.0891 + 0.0214X (r = 0.2343) for CLZ-TCNQ. The values of the limits of detection and quantification were calculated as per the recommendations set by the International Conference on Harmonization and are tabulated in .
Fig. 6 Calibration plot for the analysis of the CLZ by the proposed methods.
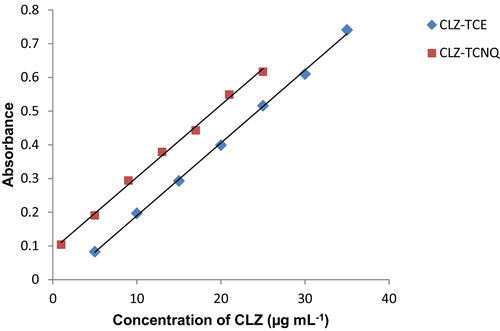
Table 1 Spectral data for the analysis of CLZ with the TCE and TCNQ acceptors.
3.3.2 Accuracy and precision
The accuracies and precisions of the proposed methods were evaluated by analyzing the pure drug CLZ at three different concentration levels within the working range, each concentration being replicated five times, and the results are presented in . The percentage relative standard deviation (% RSD) values were less than 2% for both the methods, indicating good precision of the developed methods. The accuracy of the proposed methods was evaluated as the percent relative error, and the values were less than 1%, demonstrating good accuracy for the proposed methods.
Table 2 Evaluation of the accuracies and precisions of the proposed methods.
3.3.3 Selectivity
The selectivity of the proposed methods for the analysis of CLZ was studied by analysis of a placebo blank and the prepared synthetic mixture. The proposed analytical procedures described above were applied for the placebo blank, and the resulting absorbance readings in both the methods were same as that of the reagent blank. The analysis of the prepared synthetic mixture yielded good percent recoveries for CLZ-TCE and CLZ-TCNQ, respectively. The results of the assay indicated that the excipients, such as propyl paraben, methyl paraben and benzyl alcohol, did not interfere, confirming the selectivity of the proposed methods for analysing CLZ in its dosage forms.
3.4 Application to dosage form analysis
Commercially available dosage forms of CLZ were analyzed using the proposed methods. With respect to the t-test, no significant differences were found between the calculated values of both the proposed methods and the theoretically tabulated value at the 95% confidence interval (). This indicated good accuracy and precision for the analysis of CLZ in its dosage forms. The good percentage recovery values obtained in the range of 99.60–100.20% for CLZ-TCE and CLZ-TCNQ, respectively, indicated that the excipients did not interfere with the assay.
Table 3 Statistical results from the analysis of the formulations using the proposed methods.
3.5 Characterization of the reaction products
3.5.1 IR spectra
The infrared spectra of the charge transfer complexes are shown in and , and the band assignments of CLZ and the charge transfer reagents with the characteristic peaks of important functional groups are given in and . A comparison of the relevant IR spectral bands of CLZ with the acceptors TCE and TCNQ clearly indicated shifts in the frequencies as well as reductions in the band intensities, which proved the formation of charge transfer complexes. These shifts in the values were due to changes in the electronic structures and molecular symmetries of reactants upon complex formation [Citation23]. The infrared spectrum of CLZ exhibited a characteristic peak of –C=N– at 1436 cm−1, which showed significant shifts to 1489 cm−1 and 1444 cm−1 in the infrared spectra of the CLZ-TCE and CLZ-TCNQ complexes, respectively, which confirmed the participation of the C=N group in the complexation process.
Fig. 7 Infrared spectra of CLZ-TCE.
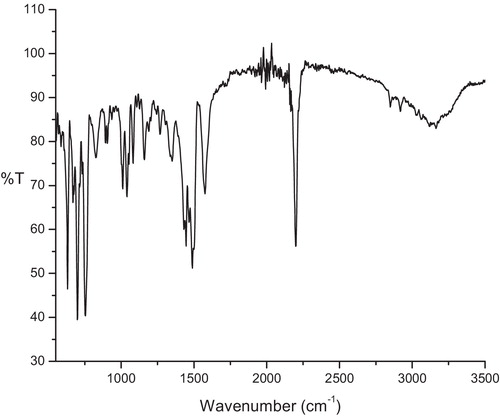
Fig. 8 Infrared spectra of CLZ-TCNQ.
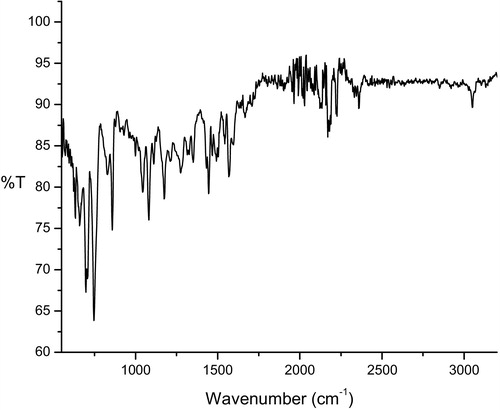
The infrared spectra of TCE gave peaks at 2270 cm−1, 1699 cm−1 and 1145 cm−1, corresponding to –C▂N–, –C=C– and –C–C–, which upon complexation with CLZ, shifted to 2198 cm−1, 1575 cm−1, and 1159 cm−1, respectively. The infrared spectra of the molecular complexes of TCNQ with CLZ indicated that stretching vibrations of –C▂N– and –C=C– at 2222 cm−1 and 1543 cm−1 of the free TCNQ molecule were shifted to 2171 cm−1 and 1570 cm−1, respectively. Further, the reductions in the intensities of the characteristic peaks of the CLZ and the free acceptors were also observed in the infrared spectra of the CLZ-TCE and CLZ-TCNQ complexes. Careful observation of the infrared spectra of the donor and acceptor molecules revealed the charge transfer interaction between them.
4 Conclusions
The determination of small amounts of CLZ in pharmaceutical preparations is important for medical needs; hence, two simple spectrophotometric procedures are developed for the quantification of the drug; these methods are specific and cost effective. The proposed methods also have the advantage of being single step reactions using a single solvent, and they can also be directly applied for the determination of CLZ in dosage forms containing parabens as the excipients without the requirement of any tedious, time-consuming drug isolation procedure. Hence, the suggested charge transfer complexation reaction is practical and economical for routine analysis of CLZ in control laboratories. In addition, the characterization of the synthesized charge transfer complexes by infrared spectroscopy has also been described.
Acknowledgements
The authors would like to acknowledge CAD Pharma Inc., Bangalore for gifting the drug sample. The authors would also like to thank Mangalore University for providing the required research facilities to carry out the present work and the University Grants Commission for financial assistance through a BSR one time grant (SR/S9/Z-23/2010/32 dated 15/03/2011) for the purchase of chemicals.
Notes
Peer review under responsibility of Taibah University.
References
- S.D.SethV.SethTextbook of Pharmacologythird ed.2009ElsevierIndia
- T.R.BeamJr.Antifungal agentsJ.C.WinterC.M.SmithA.M.ReynardTextbook of Pharmacology1992W.B. SaundersPhiladelphia888899
- J.B.PappasM.R.FranklinHepatic clotrimazole concentrations and hepatic drug metabolizing enzyme activities in adult male Sprague-Dawley ratsToxicology8019932735
- W.BettyW.DuncanH.BernardCandida albicans adhesion to and invasion and damage of vaginal epithelial cells: stage-specific inhibition by clotrimazole and bifonazoleAntimicrob. Agents Chemother.55201144364439
- A.MagdiTitrimetric method for determination of clotrimazole and tioconazole using N-bromosuccinimideAlex. J. Pharm. Sci.71993151153
- R.HajkovaH.SklenarovaL.MatvosaP.SvecovaDevelopment and validation of HPLC method for determination of clotrimazole and its two degradation products in spray formulationTalanta732007483489
- B.A.MousaN.M.El-KousyR.I.El-BagaryN.G.MohamedStability indicating methods for the determination of some antifungal agents using densitometric and RP-HPLC methodsChem. Pharm. Bull.562008143149
- C.ValentaA.LexerP.SpieglAnalysis of clotrimazole in ointments by high performance liquid chromatographyPharmazie471992641642
- D.MeshramD.PatelM.RohitS.DesaiM.R.TajneSimultaneous determination of clotrimazole and tinidazole in tablet and cream by HPTLCInt. J. Adv. Res.22014855862
- P.KumawatP.C.JagadishB.K.MuddukrishnaDevelopment and validation of stability-indicating HPTLC method for Clotrimazole lozenges formulationInt. J. Pharm. Pharm. Sci.62014126129
- P.Y.KhashabaS.R.El-ShabouriK.M.EmaraA.M.MohamedAnalysis of some antifungal drugs by spectrophotometric and spectrofluorimetric methods in different pharmaceutical dosage formsJ. Pharm. Biomed. Anal.222000363376
- R.J.EkiertJ.KrzekDetermination of azole antifungal medicines using zero-order and derivative UV spectrophotometryActa Pol. Pharm.6620091924
- A.S.SaadNovel spectrophotometric method for selective determination of compounds in ternary mixturesSpectrochim. Acta A1472015257261
- D.M.ShingbalH.S.KudchadkarA colorimetric method for the estimation of clotrimazoleIndian Drugs241987408410
- O.H.AbdelmageedP.Y.KhashabaSpectrophotometric determination of clotrimazole in bulk drug and dosage formsTalanta40199312891294
- P.S.N.H.R.RaoT.S.RaoU.V.PrasadC.S.P.SastryExtractive spectrophotometric determinations of clotrimazole in formulationsAsian J. Chem.142002190196
- M.A.OmarG.A.A.Abuo-RahmaO.H.AbdelmageedColorimetric determination of certain antifungals in pure forms and in their pharmaceutical formulationsBull. Pharm. Sci.292006501519
- S.R.El-ShabouriK.M.EmaraP.Y.KhashabaA.M.MohamedCharge-transfer complexation for spectrophotometric assay of certain imidazole antifungal drugsAnal. Lett.31199813671385
- H.LiG.ZhaoY.ZhaoZ.LiSpectrophotometric determination of clotrimazole based on charge transfer reaction between clotrimazole and chloranilic acidFenxi Huaxue302002334336
- K.KelaniL.I.BebawyL.Abdel-FattahA.S.AhmadSpectrophotometric determination of some n-donating drugs using DDQAnal. Lett.30199718431860
- K.HarikrishnaB.S.NagaralliJ.SeetharamappaExtractive spectrophotometric determination of sildenafil citrate in pure and pharmaceutical formulationsJ. Food Drug Anal.1620081117
- ICH harmonized tripartite guideline. Validation of analytical procedures: text and methodology, Q2 (R1), complementary guideline on methodology dated 06 November 1996International Conference on Harmonization of Technical Requirements for Registration of Pharmaceuticals for Human Use2005ICHLondon
- M.S.RefatO.B.IbrahimH.Al-DidamonyK.M.Abou El-NourL.El-ZayatSpectroscopic and thermal studies on the charge transfer complexes formed between morpholine as donor with p-chloranil and 7,7′,8,8′-tetracyanoquinodimethaneJ. Saudi Chem. Soc.162012227235