
 ?Mathematical formulae have been encoded as MathML and are displayed in this HTML version using MathJax in order to improve their display. Uncheck the box to turn MathJax off. This feature requires Javascript. Click on a formula to zoom.
Abstract
In this study, solution scanometry is presented as a highly sensitive, simple and rapid method for the colorimetric determination of palladium ion in water samples and walnut leaf. The method is based on the formation of a rose-brown complex between Pd2+ ion and an excess of iodide in acidic medium in Plexiglas cells, which are scanned by conventional flatbed-scanner, and the colour of each cell is analysed by software written in Visual Basic (VB 6) media to determine red, green and blue values. The relative standard deviation and linear range of the method were determined to be 1.0% and 0.1–72.0 μg mL−1, respectively. The proposed method was successfully applied for the determination of Pd2+ ion in water samples and walnut leaf.
1 Introduction
Palladium is an economically important metal of economic importance due to its increasing applications in the production of dental and medicinal devices and jewellery [Citation1,Citation2]. Palladium is also used for the purification of hydrogen gas [Citation2] and in the electrical industry as contacts in telephone relays [Citation3]. In recent years, the extensive use of palladium in automotive catalytic converters and in the chemical industry has led to increasing concentrations of this metal in the environment [Citation4]. It is a metal with low toxicity but may still have deleterious effects on the health of the general population [Citation5], such as causing asthma, allergy and other serious health problems [Citation6,Citation7]. Pd2+ ion shows a high ability to form complexes and react with reagents of practically all types [Citation8].
Many methods are known for the determination of palladium, such as spectrophotometry [Citation9], atomic absorption spectrometry [Citation3], inductively coupled plasma-mass spectrometry [Citation10] and inductively coupled plasma-optical emission spectrometry [Citation11].
The flatbed scanner was used for the first time by Suslik et al. in the development of a colorimetric sensor array for the detection and identification of volatile organic compounds [Citation12,Citation13]. It was then used to scan the TLC (Thin Layer Chromatography) strip in the paptode method. TLC acts as a substrate for the reaction between an analyte and a reagent [Citation14]. The solution scanometric method was introduced recently by Abbaspour et al. [Citation15]. In this method, the reaction is performed in a solution in Plexiglas® cells. The solution is scanned, and finally, the RGB (red, green and blue) colour model is used in colour monitoring [Citation16–Citation18]. This method has been used for the detection and determination of metal ions [Citation19,Citation20].
The solution scanometric method has the advantages of being easy to handle and having the capability to test various compounds simultaneously, with a high scanning speed, a quick response and limited interferences. Moreover, it is inexpensive, has portable systems and, unlike spectrometry, eliminates the need to find λmax. Finally, this method in comparison to other scanning methods such as paptode, can produce more clear, symmetrical and homogenous images.
In this work, solution scanometry was developed as a simple, fast and inexpensive method to determine Pd2+ ion based on the formation of a coloured complex between Pd2+ ion and iodide in acidic medium and in the presence of sodium sulphite as a reducing agent for iodine.
2 Experimental
2.1 Apparatus
The cells used were built from sheets of Plexiglas, according to the previous report [Citation15]. A flatbed CanoScan LIDE 200 with a 3-colour (RGB) LED (cold cathode fluorescent lamp (CCFL)) and charge-coupled device (CCD) as the light source and detection system, respectively, was used for scanning. The horizontal and vertical resolution of the scanner were both set at 300 dpi. The colour of each cell was analysed with software written in Visual Basic 6 (VB 6) media to determine the red, green and blue values. Three Biohit Proline pipettes with different volumes (0.5–10, 10–100 and 100–1000 μL) were used for injecting samples into the cells.
2.2 Chemicals and reagents
All chemicals used in this work were of analytical grade. In addition, double distilled water was used throughout. Palladium chloride and potassium iodide were purchased from Merck Company (E. Merck, Darmstadt, Germany). A laboratory stock solution (100 μg mL−1) was made by dissolving 0.0416 g palladium chloride in hydrochloric acid and diluting to 250 mL in a volumetric flask. The analytical-grade sodium sulphite used in this study was obtained from Fluka Company (Fluka, Buchs, Switzerland).
2.3 Principles of the red, green and blue (RGB) colour systems
The RGB colour model is an additive colour model. In this model, a colour is described by specifying the intensity levels of the colours red, green, and blue. The typical range of intensity values for each colour is 0–255, which gives 16,777,216 different colours. In the RGB system, any colour is represented in the form of (R, G, B), such that black is represented by the RGB value ‘0 0 0’ (R = 0, G = 0 and B = 0), while white is represented by the RGB value ‘255 255 255’ (R = 255 G = 255 and B = 255). The values of all three colours are converted to a single integer value using this formula:
where R, G and B are the red, green and blue values of the main colour, and V is the basis of the RGB system and is defined this way to identify a specific number for each colour. For black and white, V is equal to 0 and 16 777 216, respectively. The flowchart, R, G and B values of V for any colour can be extracted as described in the literature [Citation15].
It should also be mentioned that the R, G or B colour value that has the same colour as the solution is usually useless, as this value is often higher than 180 and does not change significantly during the experiment. In this experiment, two values of the RGB system (green and blue) changed in different concentrations of the complex, and therefore the one with the highest change, that is, ″B″, was chosen.
2.4 Procedure
First, 125 μl of 100 μg ml−1 palladium solution, 100 μl of 6 mol L−1 hydrochloric acid, 125 μl of 4 mol L−1 iodide and 50 μl of 0.02 mol L−1 sodium sulphite as an reducing agent for iodine were transferred into each cell, and an appropriate volume of double distilled water was added for a total volume of 500 μL in each cell. A cell containing the desired volume of acid, the colour-forming reagent solution and sodium sulphite without any palladium (total volume of 500 μL) was set as the blank. The cells were shaken to obtain a homogenous colour, and the Plexiglas sheet was scanned with the scanner. The image was transferred into the computer, and any colour changes in each cell were analysed using a program written in VB 6 media.
In this program, the colour of each cell is analysed based on the RGB system to obtain R, G and B values. In the colour analysis program, a specific area for analysis containing approximately 10000–300000 pixels was selected. The noise could thereby be vividly decreased. The effective intensity for any colour value was calculated as follows:
where Ax is the effective intensity for red, green or blue. Cs and Cb are the red, green or blue colour values of a sample and the blank, respectively.
2.5 Preparation of real samples
2.5.1 Water samples
First, 2 mL of 1 mol L−1 HNO3 was added to water samples, which were used after 1 hour. The standard addition method was applied to determine Pd2+ ion in the water samples according to the procedure given in the general procedure section. The Pd2+ ion in these samples was also determined by atomic absorption spectroscopy (AAS). The conditions for determination of Pd2+ by AAS were as follows: wavelength, 244.8 nm; slit, 0.2 nm; flame; C2H2–Air, using a hollow cathode lamp was used.
2.5.2 Walnut leaf
The walnut leaf sample was dried for 48 h at 70 °C in an electric oven, and 4.0000 g of dry sample was subsequently kept in a furnace for 1 h at 550 °C until it ashed. The ash was digested with 4 mol L−1 HNO3 and heated on a hotplate. After dissolution, the contents were filtered by filter paper and diluted to a final volume of 50 mL with double distilled water. Finally, 200 μl of the resulting solution was analysed according to the described procedure. The Pd2+ ion was also determined in this sample by atomic absorption spectroscopy (AAS).
3 Results and Discussion
In the reaction of Pd2+ ion with iodide, the precipitate of palladium iodide has been produced. However, if a large iodide excess is added, the palladium iodide precipitate dissolves because of the formation of a soluble PdI42− complex with rose-brown colour, according to the following reaction:
The B parameter of the picture of this colour has a good effective intensity. Accordingly, the determination of Pd2+ ion in this research is based on the change in this parameter.
3.1 Optimization of the system parameters
To obtain the maximum effective intensity of B as a signal, it was necessary to investigate the effects of reaction time, type and the concentration of reagents.
3.1.1 Effect of time
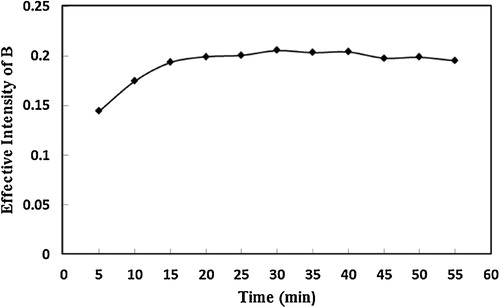
To attain the maximum signal, it was necessary for the interaction between reagents to be completed. The effect of the reaction time was studied in the range of 5–55 min. To examine the effect of reaction time on the determination of palladium, A cell containing 500 μl of a solution consisting of 25 μg ml−1 palladium, 1 mol L−1 iodide, 1.32 mol L−1 HCl and 2 × 10⁻³ mol L−1 sodium sulphite was scanned at 5 minute increments at room temperature, and after scanning of the sheet, the image of the cell was analysed using the software. The results, shown in , illustrate that the effective intensity is maximum at an analysis time of 20 minutes.
Fig. 1 Effect of time on effective intensity (Conditions: 500 μL solution containing 25 μg mL−1 Pd2+ ion, 1 mol L−1 iodide, 1.32 mol L−1 HCl and 2 × 10⁻³ mol L−1 sodium sulphite).
3.1.2 Effect of iodide, sulphite and acid concentrations
illustrates the effect of iodide and sodium sulphite concentration as well as the effects of HCl and H2SO4 and their concentrations. The effective intensity B increased with the addition of iodide and decreased from the concentration of 1 mol L−1 onwards, at which concentration the interaction between iodide and Pd2+ ion was complete. Therefore, 1 mol L−1 of iodide was selected as the optimum concentration.
Fig. 2 Effect of iodide and sodium sulphite concentration as well as the effect of HCl and H2SO4 and their concentration on effective intensity (Conditions: 500 μL solution containing 25 μg mL−1 Pd2+ ion, 1 mol L−1 iodide, 1.32 mol L−1 HCl, 0.42 mol L−1 H2SO4, 2 × 10⁻³ mol L−1 sodium sulphite; reaction time 20 min). For the other two parameters, the investigated parameter was changed, and the others were fixed similarly.
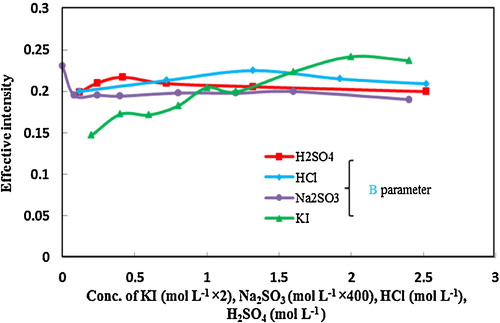
Because acid iodide solution slowly liberates iodine on standing, a quantity of sodium sulphite was added to the solution to reduce the iodine [Citation21]. Optimization of the concentration of sodium sulphite is one of the key optimization steps. According to observations without sodium sulphite in the reaction medium, the false blue signal attributed to the released iodine was increased. The highest signal was obtained at 2 × 10⁻³ mol L−1 of sodium sulphite. Thus, to provide sufficient sodium sulphite, this amount was selected as the optimum concentration.
The effect of HCl and H2SO4 and their concentrations on the formation of complex of Pd2+ ion with iodide was also examined. As shown in , at 0.42 mol L−1 H2SO4 and 1.32 mol L−1 HCl, the maximum colour intensity was observed. Because the effective intensity of the B parameter in the presence of HCl acid at the optimum concentration is greater than for H2SO4, HCl was accordingly used in subsequent studies. In previous reports, because of obtaining higher sensitivity and lower interference in the matrix, different acids have been used for the measurement of palladium with iodide reagent [Citation21–Citation23].
3.2 Analytical performance
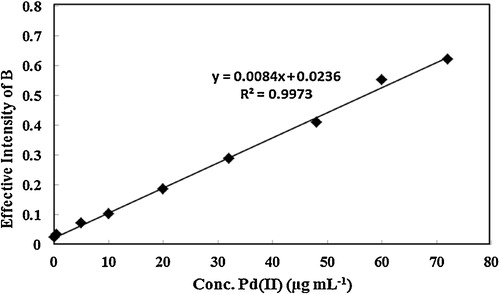
illustrates the calibration curve under optimum conditions. In the range of 0.1–72.0 μg mL−1, a proper linear relationship was obtained between the effective intensity of the product and the concentration of Pd2+ ion. The equation for the regression line was Y = 0.0084C + 0.0234 (for B), where C is the concentration of Pd2+ ion in μg mL−1. To determine the repeatability of the method, 5 sample solutions of 25 μg mL−1 Pd2+ ion were analysed, and 1.0 was the RSD% (Relative Standard Deviation) for the B colour value. The detection limit was found to be 0.089 μg mL−1 based on the standard deviation of six blanks.
Fig. 3 Calibration curve for determination of Pd2+ ion under optimum conditions.
3.3 Interference study
To study the selectivity of the proposed method for the determination of Pd2+ ion, the effect of various ions on the determination of 25 μg ml−1 Pd2+ ion was tested under optimum conditions. The tolerance limit was defined as the concentration of added ion that causes less than ±5% relative error of the B value. The results are shown in . In this method, most of the species do not interfere, because the scanometry is based on the reflective properties of the samples.
Table 1 Effect of interfering species on the determination of 25 μg ml−1 Pd2+ under optimum conditions.
3.4 Application
The applicability of the proposed method in determining Pd2+ ion was examined with walnut leaf and three different water samples, including tap (Yasouj city), river (Beshar in Yasouj city) and spring (Ghallat village in Yasouj city) water, under optimum conditions. The results are presented in . The results obtained by the proposed method were found to be in excellent agreement with the results obtained by atomic absorption spectrometry (AAS).
Table 2 Determination of Pd2+ ion in real samples.
4 Conclusions
Trace amounts of Pd2+ ion were determined using solution scanometry as a new, simple, fast and inexpensive method. compares the characteristics of the proposed method with some other previous reported methods for the determination of Pd2+ ion. As shown in , the method has a wide linear range, good precision and an acceptable limit of detection in comparison to the other methods. In addition, the method has other advantages, such as simplicity of operation, rapidity and low cost. The proposed method can be successfully applied to determine trace amounts of Pd2+ ion in real samples.
Table 3 Comparison of the results of solution scanometry and other methods for determination of Pd2+ ion.
Acknowledgement
We gratefully acknowledge the support of Yasouj University Research for this study.
Notes
Peer review under responsibility of Taibah University.
References
- C.R.M.RaoG.S.ReddiPlatinum group metals (PGM); occur-rence, use and recent trends in their determinationTrend Anal. Chem.192000565586
- M.C.BruzzonitiC.MucchinoE.TarascoC.SarzaniniOn-line preconcentration, ion chromatographic separation and spectrophotometric determination of palladium at trace levelJ. Chromatogr. A1007200393100
- S.TokaliogluT.OymakS.KartalDetermination of palladium in various samples by atomic absorption spectrometry after preconcentration with dimethylglyoxime on silica gelAnal. Chim. Acta5112004255260
- S.DanielJ.M.GladisT.P.RaoSynthesis of imprinted polymer material with palladium ion nanopores and its analytical applicationsAnal. Chim. Acta4882003173182
- V.FeigenbrugelC.LoewS.L.CalveP.MirabelNear-UV molar absorptivies of acetone alachlor, metolachlor, diazinon and dichlorvos in aqueous solutionJ. Photochem. Photobiol. A: Chem.17420057681
- K.RavindraL.BencesPlatinum group elements in the environment and their health riskSci. Total Environ.3182004143
- R.MergetG.RosnerEvaluation of the health risk of platinum group metals emitted from automotive catalytic convertersSci. Total Environ.2702001165173
- H.Puzanowska-TarasiewiczM.TarasiewiczH.BasinskaColorimetric determination of palladium (II) by means of promazine hydrochlorideMicrochem. J.191974353361
- I.MoriT.KawakatsuY.FujitaM.MatsuoSelective spectrophotometric determination of palladium(II) with 2(5-nitro-2-pyridylazo)-5-(N-propyl-N-3-sulfopropylamino)phenol(5-NO(2).PAPS) and tartaric acid with 5-NO(2).PAPS-niobium(V) complexTalanta48199910391044
- M.MullerK.G.HeumannIsotope dilution inductively coupled plasma quadrupole mass spectrometry in connection with a chromatographic separation for ultra-trace determinations of platinum group elements (Pt, Pd Ru, Ir) in environmental samplesFresenius J. Anal. Chem.3682000109115
- N.ZhangY.MaY.ShenX.GaoDetermination of platinum palladium, ruthenium, rhodium, and iridium in ultrabasic rock from the great dyke of Zimbabwe by inductively coupled plasma-optical emission spectrometryAnal. Lett.47201420722079
- N.A.RakowK.S.SuslickA colorimetric sensor array for odour visualizationNature4062000710713
- M.C.JanzenJ.B.PonderD.P.BaileyC.K.IngisonK.S.SuslickColorimetric Sensor Arrays for Volatile Organic CompoundsAnal. Chem.78200635913600
- A.AbbaspourM.A.MehrgardiA.NooriM.A.KamyabiA.Khalafi-NezhadM.N. Soltani Rad, Speciation of iron(II), iron(III) and full-range pH monitoring using paptode: A simple colorimetric method as an appropriate alternative for optodesSens. Actuators B1132006857865
- A.AbbaspourA.KhajehzadehA.GhaffarinejadA simple and cost-effective method, as an appropriate alternative for visible spectrophotometry: development of a dopamine biosensorAnalyst134200916921698
- A.AbbaspourA.KhajehzadehA.GhaffarinejadDevelopment of a new method based on scanner electrochemistry: applied for the speciation of Iron (ii) and Iron (iii)Anal. Methods3201122682272
- A.AbbaspourH.ValizadehA.KhajehzadehA simple, fast and cost effective method for detection and determination of dopamine in bovine serumAnal. Methods3201114051409
- A.AbbaspourE.Talebanpour-BayatE.MirahmadiA reliable and budget-friendly, solution-based analysis of multiple analytes of boiler water based on reflection scanometryAnal. Methods4201219681975
- A.ShokrollahiN.ShokrollahiDetermination of Mn2+ ion by solution scanometry as a new, simple and inexpensive methodQuim. Nova37201415891593
- A.ShokrollahiK.HemmatidoustF.ZarghampourDetermination of magnesium by solution scanometric method in colored titan yellow-magnesium hydroxide complex formJ. Taibah Univ. Sci.102016161167
- J.G.FraserF.E.BeamishW.A.E.McbrydeSeparation of palladium from lead and the colorimetric determination of palladium with potassium iodideAnal. Chem.261954495498
- J.J.MorrowJ.J.MarkhamImprovement in Spectrophotometric Determination of Palladium with Excess IodideAnal. Chem.361964 1159–1159
- R.N.RhodaR.H.AtkinsonStudy at iodide teration for determination of palladiumAnal. Chem.281956535536
- G.H.AyresB.L.TufflySpectrophotometric Determination of Palladium with BromideAnal. Chem.241952949952
- R.G.ClemE.H.HuffmanSpectrophotometric Determination of Palladium with AzideAnal. Chem.3719658689
- S.N.H.AzmiB.IqbalB.H.Al RuqishS.A.M.Al SayabiN.M.K.Al QurainiN.RahmaOptimized and validated spectrophotometric method for the determination of palladium(II) in synthetic mixture and automobile workshop area samplesJ. Assoc. Arab Univ. Basic Appl. Sci.1920162936