 ?Mathematical formulae have been encoded as MathML and are displayed in this HTML version using MathJax in order to improve their display. Uncheck the box to turn MathJax off. This feature requires Javascript. Click on a formula to zoom.
Abstract
Much of agricultural research has the ultimate goal of enhancing our ability to predict phenotypes (P) based upon knowledge of genotypes (G), environment (E) and management (M) in order to quantitatively predict phenotypes (P), also known as the GEM-to-P problem. Ecophysiological models are powerful tools for quantitatively predicting phenotypes in terms of environment and management, but their representations of genetic effects are very simplistic. Genomics offers promising avenues to reduce model uncertainty by improving descriptions of the genetic differences among cultivars. This paper reviews use of genetics and genomics with emphasis on wheat (Triticum aestivum L.), sorghum (Sorghum bicolor [L.] Moench) and common bean (Phaseolus vulgaris L.). Cultivar-specific parameters, such as for photoperiod sensitivity or grain size, are often problematic because their values are estimated empirically from field studies and because the assumed physiology is inaccurate. Estimates based on genotypic data should be more reliable than estimates from phenotypic data since environmental variation is eliminated. Using ecophysiological models for wheat, sorghum and common bean, cultivar coefficients were estimated using linear functions for gene effects. For all three crops, simulations with gene-based coefficients were similar to those from conventional coefficients. Wider use of this approach has been limited by the number of loci that have been characterized for readily modelled traits. However, data limitations are diminishing as genomic tools provide robust characterization of genes such as the Vrn and Ppd series in wheat. Genomics also can contribute to understanding of how processes should be represented in models. Examples include determining the end of the juvenile phase, characterizing interactive effects of temperature on photoperiod sensitivity, improving how tiller development is modelled, and estimating carbon costs of low-lignin traits for bioenergy crops. The merger of ecophysiological models with genomics, however, will not happen spontaneously. Modellers must broaden their understanding of genomics and related fields, while developing effective collaborations with the plant biology community.
1 Introduction
Process-based ecophysiological models predict how plant performance (the phenotype, P) varies in response to the genetic makeup of the plants (G), the biophysical environment (E) they grow in, and how the plants are managed (M). This prediction problem is often described as the genotype to phenotype or GP problem [Citation1,Citation2], but a more accurate term is the ‘GEM-to-P problem’, emphasizing that environment and management also determine the phenotype. Better prediction of phenotypes underlies much of crop research, including efforts to predict crop responses to water and fertilizer management, to identify trait combinations that enhance performance in a given population of environments, and to predict how processes such as climate change may impact agriculture. Crop science probably will never completely ‘solve’ the GEM-to-P problem, but ecophysiological models are already widely used both as research and decision support tools based on their ability to integrate diverse types of data and provide useful quantitative predictions of crop performance.
Accuracy of predictions should increase if model inputs are accurately specified and individual processes are represented as correctly as possible. Plant genomics offers avenues to benefit both aspects of modelling [Citation3]. The simplest and most immediately practicable opportunities relate to improved estimation of model parameters used to represent differences among cultivars, such as for photoperiod sensitivity or potential grain size. These parameters are often problematic because their values are estimated empirically from field studies and because the assumed underlying physiology is poorly understood. Even greater opportunities may reside in using information from genomics and related fields to improve representations of specific physiological processes, which likely will require integrating information and experimental approaches from the gene to whole-plant levels.
This paper reviews use of genetics and genomics to improve ecophysiological models, emphasizing experiences from wheat (Triticum aestivum), sorghum (Sorghum bicolor), and common bean (Phaseolus vulgaris). Six levels of genetic detail may be implemented in models [Citation3], ranging from non-species specific, generic models to models that seek to describe processes by scaling up from gene-sequences or gene products and eventually, to major physiological processes or even an entire plant (). These six levels provide a useful framework for discussion. Current widely used models such as the Cropping Systems Model [Citation4], which is distributed with the Decision Support System for Agrotechnology Transfer for (DSSAT) software [Citation5], and APSIM [Citation6] are at level 3 (). These models describe genetic differences through cultivar-specific parameters that describe traits like photoperiod sensitivity, leaf appearance rate, and characteristic leaf or grain sizes. Emphasis is given here to improvements in predicting specific phenotypic traits. The ultimate goal, of course, is to benefit applications ranging from specifying ideotypes for plant breeding to identifying opportunities for adapting cropping systems to climate change [Citation7].
Table 1 The six levels of genetic detail in crop simulation models [Citation3].
2 Gene-based estimation of model parameters
The most immediately practicable approach for employing genetic information is to estimate cultivar parameters as a function of the alleles present at known loci, corresponding to level 4 in . The first step in this approach is to assemble field data for a large set of germplasm known to vary for loci of interest. The field data are then used to calibrate the cultivar coefficients using the conventional approach of adjustment and comparison of measured vs. simulated data on phenotypes. With the coefficient values in hand, one can then proceed to estimate the effects of known loci.
Where only dominant and recessive alleles are considered and cultivars are pure inbred lines, the alleles at a given locus can be scored with a value of 1 if dominant and 0 if recessive, and their effects estimated through linear regression. Thus, for two loci affecting a cultivar parameter P, one might have:where a, b and c are regression coefficients (estimated through ordinary least squares), and L1 and L2 are scores for two loci. Interactions among loci (genetic epistasis) are accounted for by multiplying loci effects (e.g., L1 × L2), as done for the Ppd and Hr loci that determine photoperiod sensitivity in common bean [Citation9]. Applied to wheat, the estimating equation for the effect of the Ppd-D1 locus on the photoperiod sensitivity coefficient P1D thus was
where Ppd-D1 indicates whether the dominant or recessive allele was present. Note that dominance (Ppd-D1 = 1) reduces the value of P1D, reducing photoperiod sensitivity, in agreement with the described effect of the locus [Citation10].
The loci that are assumed to influence a given cultivar parameter and thus are included in a regression model should be chosen based on physiological evidence. For example, based on described effects of the Rht loci in wheat [Citation11], one might expect an Rht locus to influence internode length and leaf size but not photoperiod sensitivity. Statistics for significance of loci effects in a linear regression can be used to reject loci whose effects are too small or uncertain to merit inclusion in the regression for a given model coefficient, but physiological understanding (or at least firm hypotheses) should direct selection of candidate variables (loci).
Estimation through linear regression has been used successfully for common bean, soybean (Glycine max), sorghum and wheat [Citation8,Citation9,Citation12–Citation15]. shows simulations of days to flowering using gene-based approaches for sorghum and wheat, using sets of phenotypic data that were independent of data used to calibrate the models. The sorghum dataset consisted of results for 10 near-isogenic lines differing in three maturity (Ma) loci that appear to affect photoperiod sensitivity and earliness per se [Citation8]. The wheat dataset represented 29 cultivars from the International Winter Wheat Performance Nurseries (IWWPN), grown at diverse locations from 1969 to 1981 [Citation15]. These included both winter and spring types. For both crops, the gene-based simulations of flowering dates were similar to those obtained with conventional cultivar coefficients [Citation8,Citation15].
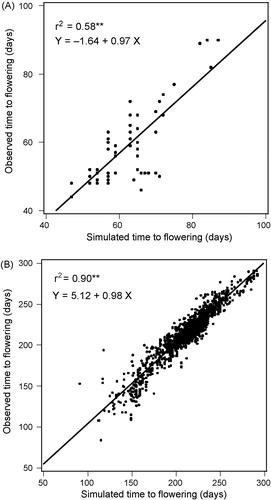
summarizes results of the simulations of time to flowering in sorghum and wheat using conventional and gene-based modelling. An effect of a ‘generic’ cultivar was assessed in order to provide a more meaningful basis for comparisons. The parameter values for the generic cultivars were estimated as the mean values for all cultivars being examined. For sorghum, the generic cultivar performed poorly compared with the conventional and gene-based models, but in wheat, the generic cultivar was surprisingly effective (). One interpretation of the contrasting results is that for the wheat dataset, there were large differences among the 34 locations that a generic cultivar was sufficient to describe, whereas in sorghum, cultivar differences were large relative to the differences between the two locations. Regression analysis and related techniques provide valuable tools for exploring the relative ability of ecophysiological models to explain genotype, environment and management effects [Citation16].
Table 2 Comparisons of results for conventional and gene-based simulation models of time to flower for 10 sorghum lines [Citation8] and 29 wheat cultivars [Citation15]. Evaluation datasets are independent from calibration sets, predominantly involving different locations. The variation that was explained by assuming no differences among cultivars was tested by evaluating simulations based on parameters for a single generic cultivar.
In the common bean model GeneGro, genotypes were input directly into the model. Gene effects were coded into the model, which made them difficult to modify. Since the gene effects were only used to specify cultivar parameters, the requisite calculations can be made external to the model code: the gene-based estimates of cultivar parameters can simply replace the conventionally estimated parameters. Thus, for wheat and sorghum, which were modelled using the DSSAT Cropping Systems Model [Citation4], gene effects were estimated with linear regression, and the results used to estimate values of the cultivar parameters used in the standard versions of the model. The gene-based parameters were then used as inputs to the model.
Additional modifications to the basic approach have included consolidating effects of three loci with similar effects (Vrn-A1, Vrn-B1, and Vrn-D1 in wheat) through a single variable for a number of dominant alleles present [Citation15] and accounting for the three alleles of the sorghum Ma3 locus by scoring values of 1.0, 0.5 and 0 based on estimates of the relative effect of each allele [Citation8].
Constraints to wider use of gene-based estimation of cultivar parameters include that modellers seldom are sufficiently familiar enough with the genetics of the crop of interest to implement the approaches, that loci are not sufficiently characterized to permit modelling their effects, that even when loci are known and well characterized, few cultivars have been genotyped for loci of interest, and that phenotypic data often are from materials of similar adaptation, which may have limited genetic variation for physiological traits. Reducing the first constraint requires efforts from the modelling community to collaborate with a broader range of disciplines. The next two constraints are diminishing rapidly as genomic tools facilitate characterization of cultivars for loci such as the Vrn and Ppd series in wheat as well as accelerate identification of new loci. Illustrating this progress, CIMMYT has offered to genotype wheat lines for photoperiod sensitivity (Ppd-D1), vernalization (Vrn-A1, Vrn-B1, Vrn-D1) and plant height (Rht-B1, Rht-D1), at a cost per locus of less than US$ 2.00 per data point (S. Dreisigacker, 2009, personal communication). The constraint on access to phenotypic data may require developing special nurseries or compiling data from regions growing contrasting germplasm. In the case of sorghum, near-isogenic lines for maturity loci have been tested in a wide range of environments, providing a valuable data resource for model development [Citation8].
Nonetheless, since characterization of specific loci affecting physiological traits has been problematic, researchers have pursued alternative approaches for incorporating genetic information in models. One strategy is to identify quantitative trait loci (QTL), and then use loci effects to estimate model parameters. This approach was implicitly used in GeneGro [Citation9] since the three hypothetical loci for seed mass were inferred mainly from QTL studies. QTL-based estimation, including consideration of larger numbers of minor QTLs, has been used to simulate barley (Hordeum vulgare L.) growth and yield [Citation17], sorghum phenology [Citation18] and leaf growth in maize [Citation19]. Traditional QTL studies based on mapping populations derived from bi-parental crosses have methodological limitations, but combining high-throughput marker systems such as Diversity Array Technology [Citation20] with association mapping [Citation21,Citation22] may overcome many of these problems.
3 Improving the physiological assumptions used to predict P from GEM
In a sense, using simple linear representations of gene action implies partial knowledge of the underlying physiology. Specifying that the bean Ppd locus only affected photoperiod parameters [Citation9] implicitly assumed that photoperiod control of phenology is independent of processes that are more directly related to growth such as intrinsic leaf size or potential leaf photosynthetic rate. Further work to incorporate differences at the Tip locus, which conditions whether photoperiod sensitivity increases with temperature, was implemented with a more mechanistic rate effect [Citation23]. However, such examples do little to advance our understanding of underlying processes. Closer integration of genomics and allied fields, whole-plant physiology and ecophysiological modelling is still needed in order to move to level 5 of [Citation24–Citation26]. Four cases are introduced to illustrate potential avenues for research. These cases by no means exhaust the knowledge emerging from plant biology. Other examples include control of plant architecture [Citation27], the identity and mode of action of florigen [Citation28], the role of Rubisco activase in thermotolerance [Citation29], and demonstration that multiple plant stress-signalling cascades likely involve common triggers involving detection of an energy deficit [Citation30]. Excellent sources of reviews on such topics include Annual Reviews of Plant Biology and Trends in Plant Science.
In many plant species, onset of flowering requires activation of the meristem identity gene APETALA1 (AP1), which initiates the conversion of the shoot apex to a reproductive state [Citation31,Citation32]. The photoperiod system inhibits AP1. To fully model photoperiod effects on development, one needs to estimate the times of onset and end of photoperiod sensitivity. In classical photoperiod research, the onset of sensitivity is termed the ‘end of the juvenile phase’. The value, if expressed in thermal time units (i.e., growing degree days) should be characteristic for a cultivar and usually is determined with reciprocal transfer (switching) experiments. Plants of a photoperiod sensitive genotype are grown under both short and long-day regimes, and individual plants are transferred from one regime to the other every few days. Analysis of days to flowering (or other stages) should reveal a date prior to which the plants can be grown in either photoperiod with no effect on development, indicating that this date corresponds to the end of the juvenile phase [e.g.,Citation33,Citation34]. However, such trials are labour intensive and time consuming. Genomic tools appear ideally suited for tracking the activity of the photoperiod system as manifested in levels of specific gene products and thus suggesting simpler, faster criteria for measuring the end of the juvenile phase. Similarly, genomics should be able to clarify what determines the end of photoperiod sensitivity, which although often assumed to end at floral initiation, appears to vary among cultivars (e.g., [Citation35,Citation36]).
Higher temperatures increase photoperiod sensitivity in many crops, and there are genetic differences among cultivars for this effect (e.g., [Citation37–Citation39]). Due to uncertainty over the physiological mechanisms involved, however, many ecophysiological models ignore photoperiod-temperature interactions. Genomics again offers the possibility of clarifying whether a specific, independent temperature response is involved or whether higher temperatures simply enhance some aspect of the basic photoperiod system through general effects of temperature on metabolic rates. Of course, just improving characterization of genotypes for this trait would facilitate testing alternative approaches to model the interaction.
In cereals, simple models that assume uniform tiller size may work well for conditions of high populations with uniform stands but have difficulties when yield variation is closely linked to variation in tiller number and fertility [Citation40]. Tiller production involves a phytochrome B-based sensing mechanism as part of a shade avoidance mechanism, and advances in understanding of this system [Citation41] are a promising source of information for modelling tiller development. Evers et al. [Citation42] combined the architectural model ‘ADEL-wheat’ with a light interception model to estimate red to far-red light ratios, which were then used to regulate bud extension. Genetic characterization of loci affecting tillering offers complementary avenues for more mechanistic approaches. For example, the Tin locus inhibits tillering in wheat [Citation43], whereas the TAC1 locus in rice affects tiller angle, with the tac1 allele conferring more erect tillers that are more efficient at high populations [Citation44].
Estimating the carbon costs of novel traits provides a fourth example where genomics can enhance ecophysiological modelling. The pioneering work of Penning de Vries et al. [Citation45] estimated that the cost of biosynthesis of different plant compounds [Citation45]. The cost of lignin synthesis was estimated at approximately 2.2 g glucose per 1 g lignin vs. 1.2 g g−1 for cellulose. This information is used in many ecophysiological models to estimate the growth component of respiration. Changes in plant composition are actively sought as a means to improve the digestibility of cereal straw for cellulosic ethanol production [Citation46]. Lignins, as complex polymers of phenolic compounds, are not fermentable, and breeders seek to manipulate their levels by means such as the brown-midrib mutants of maize and sorghum [Citation46]. In cereals, lignins typically represent 15–20% of stem dry weight, so reducing their levels could substantially reduce the net growth respiration. The costs of biosynthesis of Penning de Vries et al. [Citation45] provide rough estimates of the impact of reduced lignin content on growth respiration, but more precise estimates require a detailed understanding of the metabolic pathways affected [Citation47] – information obtainable through genomics and metabolomics. Of course, the metabolic benefit of lowering lignin content should be balanced against possible adverse effects such as in reducing stem strength. Note that consideration of costs of biosynthesis should have broad applications in predicting possible trade-offs for crop improvement efforts that seek to radically alter phenotypes for plant structure or composition, regardless of whether the changes are through application of molecular or conventional breeding.
4 Plant systems biology
The sixth and highest level of complexity in modelling approaches is to explicitly represent biochemical networks of genes and gene products to achieve what is sometimes termed the ‘in silico plant’ [Citation48]. Various software systems can simulate complex metabolic pathways [Citation49,Citation50], and the Systems Biology Markup Language (SBML) was established to facilitate this research [Citation51]. Welch et al. [Citation52,Citation53] have described models of control of flowering in Arabidopsis that are relevant to crop modelling and use simplified genetic networks. Other models of flowering also consider genetic networks [Citation54].
5 How solvable is the GEM-to-P problem?
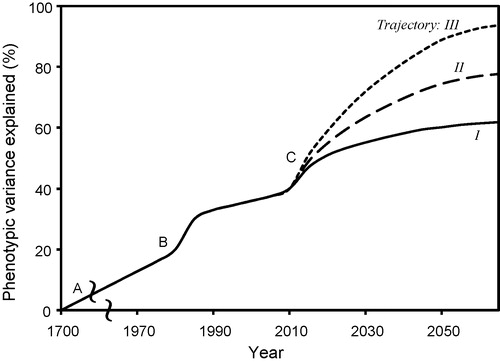
The arguments outlined above support optimism about improved prediction of phenotypes from genotypes, environment and management. However, there is value in considering the potential limits to prediction of phenotypes. For a given quantitative trait, one might ask what percentage of variation can ultimately be explained by models that integrate the best available knowledge about genetics, physiology and the environment. There has been remarkable progress since Reaumur [Citation55] first proposed the concepts that provided the foundation of quantitative modelling of plant development, and Garner and Allard [Citation56] demonstrated the influence of photoperiod on flowering time. But if we look to 2050 or beyond, how much further improvement can we expect? presents three hypothetical trajectories representing possible answers to this question.
When the Arabidopsis genome was sequenced in 2000 [Citation57], the genome was estimated to contain 25,000 genes. Subsequent progress in genomics suggests that the notion of ‘gene’ is much more complex than expected. MicroRNAs have important signalling roles, violating the ‘one gene, one enzyme’ paradigm [Citation58]. Similarly, alternate splicing patterns of pre-messenger RNA mean that a single gene sequence can result in multiple transcripts and hence, multiple proteins [Citation59]. And epigenetic effects imply that how DNA is physically packaged is sometimes more important in regulating transcription than the gene sequence per se [Citation60].
Taking 25,000 genes as a lower estimate of the potential complexity of a single plant species, one might argue that the prospects for major improvements in predicting P from GEM are poor, presumably supporting the most pessimistic trajectory, I, of . However, counter-arguments suggest that important simplifications are possible. Many gene systems may primarily affect disease or pest resistance and thus exert little direct effect on the processes used to predict P in current ecophysiological models. Additionally, certain complex processes such as for pollination, fertilization and early embryo development may have limited relevance except as they relate to specific stress responses. More speculatively, Kaplan [Citation61] argued that the generation of form of specific organs is produced independently of the patterns of cell division in plants. Thus, the possibility exists that many processes related to cell division are irrelevant for simulating processes at the scales from organs to plants. These arguments thus support optimism for solving the GEM-to-P problem, represented by trajectory III of .
In many cases, signalling systems, such as from roots to shoots, may not require complete description [Citation62]: it should suffice to know that a sensory mechanism exists and that when the sensor is activated, a message is transmitted to a receptor. The simplified gene networks modelled by Welch and others [Citation53] exemplify this ‘middle way’.
The possible limits of modelling to solve the GEM-to-P problem also relate to questions about how plants evolve. If physiological adaptations primarily evolve through slow accumulation of micro-adaptations, this would argue for models representing massively complex regulatory networks. If most mutations are essentially neutral, and only occasional mutations cause major, step-like changes in phenotypes, then variation in P presumably can largely be explained through effects of major loci. The increasing availability of genome sequence data allows more rigorous testing of the nature of evolution (e.g., [Citation63]), including for crop domestication [Citation64]. To date, the evidence mainly suggests that the genomic rate of adaptive evolution differs greatly among species [Citation65], suggesting that a wide range of trajectories in might be valid, depending on the crop species.
6 Conclusions
Prospects appear excellent for incorporating information from genomics into ecophysiological modelling, thus improving our ability to decipher the GEM-to-P problem. However, the required research is surrounded with uncertainty that may require answering fundamental questions of plant function and evolution. Furthermore, realizing the potential contributions of genomics will not happen spontaneously. Modellers must broaden their understanding of genomics and related fields and develop more effective collaborations with the plant biology community.
References
- M.CooperS.C.ChapmanD.W.PodlichG.L.HammerThe GP problem: quantifying gene-to-phenotype relationshipsIn Silico Biol.22002151164
- P.N.BenfeyT.Mitchell-OldsFrom genotype to phenotype: systems biology meets natural variationScience3202008495497
- J.W.WhiteG.HoogenboomGene-based approaches to crop simulation: past experiences and future opportunitiesAgron. J.9520035264
- J.W.JonesG.HoogenboomC.H.PorterK.J.BooteW.D.BatchelorL.A.HuntP.W.WilkensU.SinghA.J.GijsmanJ.T.RitchieThe DSSAT cropping system modelEur. J. Agron.182003235265
- G.HoogenboomJ.W.JonesP.W.WilkensC.H.PorterW.D.BatchelorL.A.HuntK.J.BooteU.SinghO.UryasevW.T.BowenA.J.GijsmanA.du ToitJ.W.WhiteG.Y.TsujiDecision Support System for Agrotechnology Transfer Version 4.0 [CD-ROM]2004University of HawaiiHonolulu, HI
- R.L.McCowanG.L.HammerJ.N.G.HargreavesD.P.HolzworthD.M.FreebairnAPSIM: a novel software system for model development, model testing and simulation in agricultural systems researchAgric. Syst.501996255271
- G.HoogenboomJ.W.WhiteC.D.MessinaFrom genome to crop: integration through simulation modelingField Crops Res.902004145163
- J.W.WhiteG.HoogenboomM.OttmanModeling phenology of sorghum based on known maturity (Ma) loci, in Farming Systems DesignProceedings of the International ConferenceCatania, Italy, 10–12 Sept. 2007(2007) 83–85. http://www.iemss.org/farmsys07/uploads/Main/Field_farm_scale_CD.pdf (verified 31 March 2008)
- J.W.WhiteG.HoogenboomSimulating effects of genes for physiological traits in a process-oriented crop modelAgron. J.881996416422
- J.BealesA.TurnerS.GriffithsJ.SnapeD.LaurieA pseudo-response regulator is misexpressed in the photoperiod insensitive Ppd-D1a mutant of wheat (Triticum aestivum L.)Theoret. Appl. Genet.1152007721733
- M.H.EllisW.SpielmeyerK.R.GaleG.J.RebetzkeR.A.RichardsPerfect markers for the Rht-B1b and Rht-D1b dwarfing genes in wheatTheoret. Appl. Genet.105200210381042
- G.HoogenboomJ.W.WhiteJ.Acosta-GallegosR.GaudielJ.R.MyersM.J.SilbernagelEvaluation of a crop simulation model that incorporates gene actionAgron. J.891997613620
- D.W.StewartE.R.CoberR.L.BernardModeling genetic effects on the photothermal response of soybean phenological developmentAgron. J.9520036570
- C.D.MessinaJ.W.JonesK.J.BooteC.E.VallejosA gene-based model to simulate soybean development and yield responses to environmentCrop Sci.462006456466
- J.W.WhiteM.HerndlL.A.HuntT.S.PayneG.HoogenboomSimulation-based analysis of effects of Vrn and Ppd loci on flowering in wheatCrop Sci.482008678687
- J.W.WhiteK.J.BooteG.HoogenboomP.G.JonesRegression-based evaluation of ecophysiological modelsAgron. J.992007419427
- X.YinS.D.ChasalowC.J.DourleijnP.StamM.J.KropffCoupling estimated effects of QTLs for physiological traits to a crop growth model: predicting yield variation among recombinant inbred lines in barleyHeredity852000539549
- J.ChantereauG.TroucheJ.F.RamiM.DeuC.BarroL.GrivetRFLP mapping of QTLs for photoperiod response in tropical sorghumEuphytica1202001183194
- M.ReymondB.MullerA.LeonardiA.CharcossetF.TardieuCombining quantitative trait loci analysis and an ecophysiological model to analyze the genetic variability of the responses of maize leaf growth to temperature and water deficitPlant Physiol.1312003664675
- P.WenzlJ.CarlingD.KudrnaD.JaccoudE.HuttnerA.KleinhofsA.KilianDiversity Arrays Technology (DArT) for whole-genome profiling of barleyProc. Natl. Acad. Sci.101200499159920
- J.–L.JanninkJ.B.WalshAssociation mapping in plant populationsM.S.KangQuantitative Genetics, Genomics and Plant Breeding2002CABIWallingford5968
- J.CrossaJ.BurguenoS.DreisigackerM.VargasS.A.Herrera-FoesselM.LillemoR.P.SinghR.TrethowanM.WarburtonJ.FrancoM.ReynoldsJ.CrouchR.OrtizAssociation analysis of historical bread wheat germplasm using additive genetic covariance of relatives and population structureGenetics107200718891913
- G.HoogenboomJ.W.WhiteImproving physiological assumptions of simulation models by using gene-based approachesAgron. J.9520038289
- G.L.HammerT.R.SinclairS.C.ChapmanE.Van OosteromOn systems thinking, systems biology, and the in silico plantPlant Physiol.1342004909911
- X.YinP.C.StruikM.J.KropffRole of crop physiology in predicting gene-to-phenotype relationshipsTrends Plant Sci.92004426432
- J.W.WhiteFrom genome to wheat: emerging opportunities for modelling wheat growth and developmentEur. J. Agron.2520067988
- Y.WangJ.LiMolecular basis of plant architectureAnnu. Rev. Plant Biol.592008253279
- F.TurckF.FornaraG.CouplandRegulation and identity of florigen: flowering locus T moves center stageAnnu. Rev. Plant Biol.592008573594
- M.E.SalvucciB.P.DeRidderA.R.J.PortisEffect of activase level and isoform on the thermotolerance of photosynthesis in ArabidopsisJ. Exp. Bot.57200637933799
- E.Baena-GonzalezJ.SheenConvergent energy and stress signalingTrends Plant Sci.132008474482
- K.MuraiM.MiyamaeH.KatoS.TakumiY.OgiharaWAP1, a wheat APETALA1 homolog, plays a central role in the phase transition from vegetative to reproductive growthPlant Cell Physiol.44200312551265
- T.ImaizumiS.A.KayPhotoperiodic control of flowering: not only by coincidenceTrends Plant Sci.112006550558
- J.L.CaddelD.E.WeibelPhotoperiodism in sorghumAgron. J.641972473476
- G.AlagarswamyD.M.ReddyG.SwaminathanDurations of the photoperiod-sensitive and -insensitive phases of time to panicle initiation in sorghumField Crops Res.551998110
- S.T.CollinsonR.H.EllisR.J.SummerfieldE.H.RobertsDurations of the photoperiod-sensitive and photoperiod-insensitive phases of development to flowering in four cultivars of rice (Oryza sativa L.)Ann. Bot.701992339346
- J.A.AlcaldeM.F.LarraínTiming of photoperiod sensitivity in relation to floral initiation in contrasting genotypes of pea (Pisum sativum L.)Field Crops Res.962006348354
- J.R.QuinbyJ.D.HeskethR.L.VoigtInfluence of temperature and photoperiod on floral initiation and leaf number in sorghumCrop Sci.131973243246
- W.CaoD.N.MossTemperature and daylength interaction on phyllochron in wheat and barleyCrop Sci.29198910461048
- J.W.WhiteJ.KornegayC.CajiaoInheritance of temperature sensitivity of the photoperiod response in common bean (Phaseolus vulgaris)Euphytica91199658
- T.A.LaFargeI.J.BroadG.L.HammerTillering in grain sorghum over a wide range of population densities: identification of a common hierarchy for tiller emergence, leaf area development and fertilityAnn. Bot.9020028798
- K.A.FranklinG.C.WhitelamPhytochromes and shade-avoidance responses in plantsAnn. Bot.962005169175
- J.B.R.EversJ.VosC.FournierB.AndrieuM.ChelleP.C.StruikAn architectural model of spring wheat: evaluation of the effects of population density and shading on model parameterization and performanceEcol. Modell.2002007308320
- R.RichardsA tiller inhibitor gene in wheat and its effect on plant growthAustral. J. Agric. Res.391988749757
- B.YuZ.LinH.LiX.LiJ.LiY.WangX.ZhangZ.ZhuW.ZhaiX.WangD.XieC.SunTAC1, a major quantitative trait locus controlling tiller angle in riceThe Plant J.522007891898
- F.W.T.Penning De VriesA.H.M.BrunstingH.H.Van LaarProducts requirements and efficiency of biosynthesis a quantitative approachJ. Theoret. Biol.451974339377
- G.SarathR.MitchellS.SattlerD.FunnellJ.PedersenR.GrayboschK.VogelOpportunities and roadblocks in utilizing forages and small grains for liquid fuelsJ. Indust. Microbiol. Biotech.200710.1007/s10295-007-0296-3
- J.S.AmthorEfficiency of lignin biosynthesis: a quantitative analysisAnn. Bot.912003673695
- P.V.MinorskyAchieving the in silico plant. Systems biology and the future of plant biological researchPlant Physiol.1322003404409
- S.HoopsS.SahleR.GaugesC.LeeJ.PahleN.SimusM.SinghalL.XuP.MendesU.KummerCOPASI—a complex pathway simulatorBioinformatics22200630673074
- K.TakahashiK.KaizuB.HuM.TomitaA multi-algorithm, multi-timescale method for cell simulationBioinformatics202004538546
- M.HuckaThe systems biology markup language (SBML): a medium for representation and exchange of biochemical network modelsBioinformatics192003524531
- S.M.WelchJ.L.RoeZ.A.DongGenetic neural network model of flowering time control in Arabidopsis thalianaAgron. J.9520037181
- S.M.WelchJ.L.RoeS.DasZ.DongR.HeM.B.KirkhamMerging genomic control networks and soil-plant-atmosphere-continuum modelsAgric. Syst.862005243274
- J.C.W.LockeM.M.SouthernL.Kozma-BognarV.HibberdP.E.BrownM.S.TurnerA.J.MillarExtension of a genetic network model by iterative experimentation and mathematical analysisMolec. Syst. Biol.120052005.0013
- R.A.Fd. Réaumur, Observations du thermomètre, faites a Paris pendant l’année 1735, comparés avec celles qui ont été faites sous la ligne, a l’Isle de France, a Alger et en quelques-unes de nos isles de I’ Amérique. Mémoires de l’Académie des Sciences, Paris (1735) 545–576.
- W.W.GarnerH.A.AllardEffect of the relative length of day and night and other factors of the environment on growth and reproduction in plantsJ. Agric. Res.181920553641
- Arabidopsis Genome InitiativeAnalysis of the genome sequence of the flowering plant Arabidopsis thalianaNature (London)4082000796815
- M.AxtellJ.A.SnyderD.P.BartelCommon functions for diverse small RNAs of land plantsPlant Cell19200717501769
- A.S.N.ReddyAlternative splicing of pre-messenger RNAs in plants in the Genomic EraAnn. Rev. Plant Biol.582007267294
- J.BenderPlant epigeneticsCurr. Biol.122002R412R414
- D.R.KaplanFundamental concepts of leaf morphology and morphogenesis: a contribution to the interpretation of molecular genetic mutantsInt. J. Plant Sci.1622001465474
- C.T.de WitF.W.T.Penning de VriesCrop growth models without hormonesNether. J. Agric. Sci.311983313323
- Drosophila 12 Genomes ConsortiumEvolution of genes and genomes on the Drosophila phylogenyNature4502007203218
- S.I.WrightI.V.BiS.G.SchroederM.YamasakiJ.F.DoebleyM.D.McMullenB.S.GautThe effects of artificial selection on the maize genomeScience308200513101314
- A.Eyre-WalkerThe genomic rate of adaptive evolutionTrends Ecol. Evol.212006569575