
 ?Mathematical formulae have been encoded as MathML and are displayed in this HTML version using MathJax in order to improve their display. Uncheck the box to turn MathJax off. This feature requires Javascript. Click on a formula to zoom.
Highlights
| • | Global climate change may influence the agricultural production specifically in the tropical regions like Pakistan. | ||||
| • | This study considers annual data from 1960 to 2009 and uses ARDL model to evaluate the impact of climate change on wheat production in Pakistan. | ||||
| • | The results reveal that up till now the climate change has not negatively influenced the wheat production in Pakistan. | ||||
| • | However, on the basis of the results some adaptative measures are proposed to confront any adverse shock to wheat production in Pakistan. | ||||
Abstract
Climate change and its impact on agricultural production is being debated in economic literature in context of different regions. The geographical location of Pakistan is assumed to be vulnerable to climate change. Concentration of greenhouse gases (GHGs) like carbon dioxide, methane and nitrous oxide through human activities has altered the composition of climate. These gases have increased temperature on earth by trapping sun light. This higher temperature in tropical regions may negatively affect the growth process and productivity of wheat. This study aims to look at the impact of climate change on wheat production in Pakistan. The study uses Autoregressive Distributed Lag (ARDL) model to evaluate the impact of global climate change on the production of wheat in Pakistan. The study considers annual data from 1960 to 2009. On the basis of this historical data the study tries to capture the impact of climate change on wheat production up to now. The results of estimation reveal that global climate change doesn’t influence the wheat production in Pakistan. However, on the basis of the results some appropriate adaptative measures are proposed to confront any adverse shock to wheat production in Pakistan.
Keywords:
1 Introduction
Anthropogenic activities are escalating the concentration of greenhouse gases during mass production. These GHGs are penetrating in global climate and have caused to evolve the problem of climate change. The effects of climate change may be positive, neutral or negative as per geographical location of each region. Being a global issue colossal research work has been done on the developed countries. However, attention was also paid on the tropical and subtropical developing countries after realizing severe consequence of the enriched carbon atmosphere in these countries.
Article 1 of United Nation Framework Convention on Climate Change (UNFCCC) defines climate change as; “a change of climate which is attributed directly or indirectly to human activity that alters the composition of the global atmosphere and which is in addition to natural climate variability observed over comparable time periods.” Climate change phenomenon is an externality. This externality is mainly caused by economic activities like land use, deforestation, fossil fuels etc. [Citation1]. These economic activities are altering the composition of GHGs in atmosphere. Important GHGs are carbon dioxide (CO2), nitrous oxide (N2O), methane (CH4) and water vapors. Higher concentration of GHGs is originating the problem of global warming [Citation2].
There are two major reasons for this high concentration of GHGs. First, big economies accelerate the pace of growth by exploiting natural resources for increasing their export share in international market. Second, United Nations Framework Convention on Climate Change (UNFCCC) lacks strictly enforceable climate related policies. Because of these reasons the concentration of CO2, which is the main constituent particle of GHGs, has increased from 280 ppm to 380 ppm since the industrial revolution.
The concentration of CO2 is mainly caused by developed countries through various production and consumption activities. However, the impact of climate change (through frequent floods, droughts, temperature hike, change in rainfall pattern, etc.) is mainly faced by developing countries, which are mostly located in tropical regions and relying heavily on agriculture sector. [Citation1].
Almost all the sectors are susceptible to climate change but agriculture on the most [Citation3]. Climate change will encounter the agriculture productivity through a number of ways like change in rainfall pattern, sowing and harvesting dates, temperature hike, water availability and evapotranspirationFootnote1 [Citation4].
Wheat is amongst C3 cropsFootnote2 category. Higher concentration of CO2 increases photosynthesis process and suppresses transpirationFootnote3 in C3 crops. Both of the factors cause to accelerate the growth of wheat plant. However, increase in temperature offsets the CO2 beneficial effect [Citation2,Citation5].
Pakistan being a part of South-Asia is very susceptible to calamities presumably caused by the climate change. For the last few decades extensive and frequent disasters have shuddered almost all the sectors specially agriculture sector [Citation6]. Wheat is the main food staple of this region. In Pakistan during 1960 wheat production was 3.91 million tons whereas area under wheat production was 4.88 million hectares. But after five decades the wheat production is about 23.86 million tons whereas corresponding area is about 9.041 million hectares. The growth is very much related with the inception of green revolution during 2nd and 3rd Five Year Plan (1960-70). Technology, new breed of seeds, fertilizers, expansion in irrigation and other agricultural policies have played their positive role. Beside these factors area is also increased during this period creating significant positive impact on wheat production. shows the historical trend of production and area under cultivation of wheat.
Fig. 1 Wheat Production and Area under Wheat Production in Pakistan. 1960-2010.
Source: Economic Survey of Pakistan.

Research relating to climate issues in Pakistan is limited. A simulation study made by [Citation7] used General Circulation Model (GCM) to check the impact of future CO2 saturated atmosphere on wheat production in Pakistan. According to them in future wheat productivity would significantly decline in almost all the wheat growing areas.
Most of the studies used agronomic models, e.g. CERES-Wheat, C-CAM, EPIC etc. It is difficult to apply these models in our case because agronomic models use farm-level data (quality of soil, nutrition, water, daily minimum/maximum temperatures, rainfall, etc.) which is not available at national level. Beside agronomic models Computable General Equilibrium model (CGE) is also used in some studies but the model for Pakistan has not been updated for last decade. Therefore, applying the old structure of CGE model would generate spurious results which can ultimately mislead the facts. Therefore, our study considered econometric approach for the projection of impact of different variables on wheat production.
The objective of our study is to check the impact of climate related variables, namely CO2, precipitation, temperature and water, on wheat production in Pakistan. Besides this our objective is also to investigate the impact of a set of explanatory variables on wheat production by using historical data.
Section 2 of our study pertains to data description and methodology. Section 3 contains estimations, results and interpretation. Section 4 presents concluding remarks and adaptation strategies.
2 Data Description and Methodology
2.1 Data Description
We used nine different variables for our study. Dependent variable is wheat production in thousand ton kilogram. As independent variables we used a number of climatic variables, i.e. emission of carbon dioxide for Pakistan expressed in thousand metric tons, average temperature in Celsius degree centigrade, average precipitation measured in millimeter and water measured in million acre feet (MAF). Beside these climatic variables we considered other explanatory variables including area under wheat production measured in thousand hectares, agriculture credit measured in billion rupees, fertilizers offtake in thousand nutrient tons and technology (tractors, thresher and tube wells) in numbers. Data for annual wheat production, area under wheat cultivation, water availability, agriculture credit, fertilizers offtake and technology are taken from different editions of Economic Survey of Pakistan [Citation9]. Carbon dioxide emission data is acquired from the website of Carbon Dioxide Information Analysis Center [Citation10]. Temperature and precipitation data are taken from Pakistan Meteorological Department.
2.2 Methodology
We used Autoregressive Distributed Lag (ARDL) model also known as bound testing cointegration technique originally developed by Pesaran et al. [Citation11]. There are reasons behind using this technique. Some of the variables in our study are stationary at level whereas, some of them are integrated of order 1. So in this case ARDL model is a better econometric technique as compared to other econometric techniques. Beside this as our objective is to check the impact of different variables on a single dependent variable (wheat production) in short-run as well as in long-run so this technique becomes more suitable than others.
ARDL is suitable for small data sample [Citation12]. It generates the short run and long run coefficient simultaneously and follows OLS procedure for cointegration among variables. ARDL provide flexibility regarding the order of integration of the variables. This technique does not require the pre-testing of the variables integrated in the model for unit roots unlike other methodologies like the Johansen cointegration technique. It is appropriate irrespective of whether the regressors in the model are purely I(0), purely I(1) or mutually cointegrated [Citation13]. However, this technique collapses in the presence of any variable of second order difference.
General form of ARDL model with n lags for variable Y and m lag for variable X is as follow:(1)
(1)
Whereas, the general form of ARDL error correction model is as follows:(2)
(2)
In the above equation Ψ shows the speed of adjustment parameter and for significant ECM model Ψ must be negative. Error Correction Term specifies that any divergence from the long-run equilibrium between variables is corrected in each period and how much time it will take to come again to the long-run equilibrium position. ECMt-1 is the residuals that are acquired from the estimated cointegration model.
The relationship of wheat production with variables is specified as follows:(3)
(3)
This linear combination is transformed into log-linear model which would present suitable and proficient outcomes as compared to the simple linear model.(4)
(4)
The specific form of ARDL model for our study to find out the long-run relationship among the variables is as follows:(5)
(5)
Whereas, the short-run dynamics of ARDL model can be found via the following equation;(6)
(6)
2.2.1 Bound Testing Procedure:
In ARDL or Bound testing long-run relationship among the variables is checked. In first step the null hypothesis of no cointegration H0: δ1 = δ2 = δ3 = δ4 = δ5 = δ6 = 0 among the variables is checked against the alternate hypothesis H1: δ1 ≠ δ2 ≠ δ3 ≠ δ4 ≠ δ5 ≠ δ6 ≠ 0 of cointegration among the variables.
Wald or F-statistic is used to check the significance of lagged levels of the variables in a conditional unrestricted equilibrium error correction model [Citation14]. F-stat distribution is non-standard irrespective of whether the variables are I(0) or I(1) or partially distributed.
Pesaran [Citation14] established two sets of critical values. One set presumes that all the variables are I(0), whereas, other presume all variables I(1). These two sets of critical values form a band which wraps all expected categorization of I(0), I(1) or even partially integrated.
The computed Wald or F-statistics values are reconciled with the critical values proposed by Pesaran [Citation14]. If Fcal > Fu then null hypothesis of no-cointegration δ1 = δ2 = δ3 = δ4 = δ5 = δ6 = 0 is rejected. And conclusive inference on the existence of long-run relationship among the variables is drawn. However, if computed values falls inside the critical values band then inference of inconclusive test is drawn. If Fcal > FL then inference of no-cointegration δ1 = δ2 = δ3 = δ4 = δ5 = δ6 = 0 among the variables is accepted.
Akike Information Criterion (AIC) and Schwarz Bayesian Criterion (SBC) are used for appropriate lag selection. In this stage the long-run elasticities δ2, δ3, δ4, δ5, δ6 are obtained.
2.2.2 CUSUM & CUSUMSQ Test
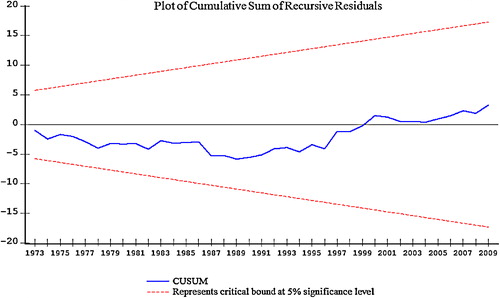
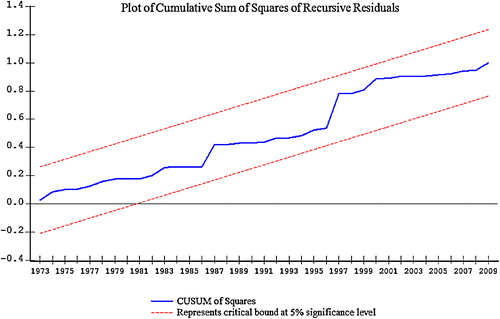
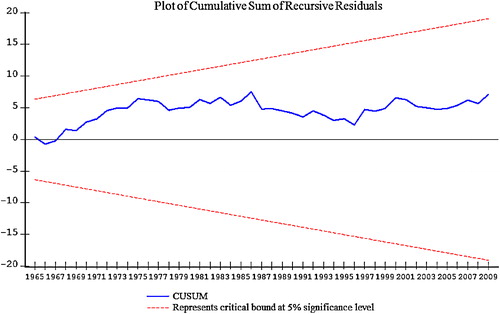
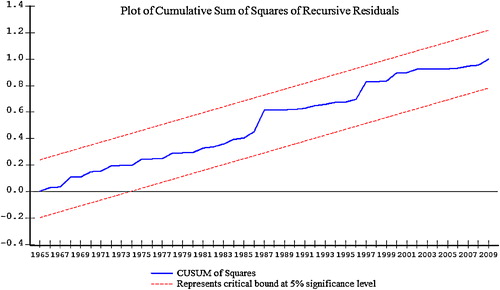
After confirming long-run relationship among the variables, we will incorporate cumulative sum (CUSUM) and cumulative sum of squares (CUSUMSQ) tests developed by Brown [Citation15]. These tests are used to check the goodness of fit for ARDL as suggested by Pesaran [Citation11,Citation14]. These tests are incorporated on the residuals of the error correction model and fabricate results in graphical form. For existence of the stability the plot of CUSUM and CUSUMQ have to stay within the 5% critical band.
3 Estimations, Results and AnalysesFootnote4
3.1 Unit Root Test Results:
Before incorporating ARDL bound testing approach we test stationarity of each variable. Bound testing approach necessitate all the variables to be integrated of I(0) or I(1) or of both nature for computation of F-statistics. But the condition which binds the researcher by applying unit root test is that none of the variable used in the study has to be integrated of order two. Variables integrated of level (2) in bound testing procedure would yield spurious results.
To check the order of integration of each variable we incorporated Augmented Dickey Fuller (ADF) and Phillips Perron (PP) unit root tests. The results of both the tests are reflected in .
Table 1 Unit Root Test.
The results in table-1 reveal that none of the variable of our study is integrated of order 2. The results demonstrate that precipitation is stationary at 10% significance level. Similarly, PP test shows that temperature is also stationary at 10% significance level. Beside temperature and precipitation all the variables are integrated of order I(1). The absence of I(2) variable corroborates the application of ARDL bound testing technique.
3.2 Bound Testing Approach for Cointegration Analysis
To check the long-run relationship among the variables bound testing approach is applied. In this regard we used equation (Equation5(5)
(5) ). We used truncated lag length one as recommended by Akike Information Criterion (AIC) and Schwarz Bayesian Criterion (SBC). Moreover, insignificant variables are eradicated by following the general to specific methodology.
For equation (Equation5(5)
(5) ) the null hypothesis of no cointegration δ1 = δ2 = δ3 = δ4 = δ5 = δ6 = 0 is tested against the alternative hypothesis δ1 ≠ δ2 ≠ δ3 ≠ δ4 ≠ δ5 ≠ δ6 ≠ 0 of cointegration among the variables. The results are reported in . The results clearly indicate that the calculated value of F-stat 4.640689 is greater than the upper bond values (Fu) of 4.05, 3.39 and 3.08 at 1%, 5% and 10%, respectively. The Fcal > Fu deduce the existence of long run relationship among the variables.
Table 2 Result of the F-test for Cointegration.
CUSUM and CUSUMSQ test are applied to corroborate the stability of ARDL procedure. The output of the test is given in the graphical form. From the and it can be seen that the CUSUM and CUSUMSQ lines are overtly in between the critical bound of 5% significance level over time. The output of CUSUM and CUSUMSQ shows that model is stable.
3.3 Short-run and Long-run Elasticities for Wheat Production
The results of the short-run and long-run elasticities are demonstrated in . The short-run values of area under wheat production and fertilizers are statistically significant. In the short-run area under the wheat cultivation and fertilizer will play an important role in increasing wheat production. The results show that 1% increase in area can increase the wheat production by 0.39%, whereas, 1% increase in fertilizer can increase the wheat production by 0.30%.
Table 3 Results of Short-run and Long-run Elasticities.
From the results we can deduce that in the short-run area under wheat production and fertilizers can be the better remedies to increase the wheat production. In short run to give an instant response to any adverse shock to wheat production, one must have to pay emphasize on area under wheat production and fertilizers. However, in the short run we can’t use barren land by converting it to arable land for cultivation of wheat as this whole process would require long span of time. In short run we haven’t enough time to cope with any adverse shock to wheat production. For this purpose we have to utilize the area under the cultivation of other cereal crops for wheat production. In this regard area is having significant importance to increase the wheat production. Similarly, another factor which can also play significant role to cope with any adverse shock to wheat production in short-run is fertilizers. Fertilizers, which are having the ability to enhance the soil nutrition and soil fertility, can also create considerable positive impact on wheat production through enhancing the per acre wheat yield. Therefore, any adverse shock to wheat production can also be curtailed through effective use of fertilizers. Thus, both the factors are having significant positive impact as compare to other variables, i.e. CO2, precipitation, temperature, water and agricultural credit. In short-run we do not perceive any significant role of temperature and CO2 on wheat production.
The long run elasticities for wheat production are presented in the following equation:(7)
(7)
After re-parameterization of the long-run coefficients the results are incorporated in the long-run wheat production equation.
We observe from the that t-stat value for CO2 is insignificant for long-run. From the results we can deduce that the impact of CO2 on wheat production in long-run is insignificant. In long-run we don’t see any major shift in wheat production due to climate change. The scientific studies show that the impact of CO2 on wheat production is positive but the extent of this positive impact is still a question mark.
The long run t-stat value for precipitation is also insignificant. We can infer from this that in long-run the impact of precipitation may be insignificant. The geographical rainfall pattern may change in consequence of the climate change. This shift in rainfall is uncertain and the uncertainty in rainfall pattern may influence the pattern of production, but it may create insignificant impact on the overall level of wheat production.
Temperature t-stat value is also insignificant. In long-run a small increase in temperature may create insignificant impact on wheat production in this region. As Pakistan is located next to the tropic region where any increase in temperature due to climate change may not have significant impact on agricultural production of wheat as compared to the tropical regions where temperature is already at threshold level.
Similarly, water t-stat value is also insignificant in long-run. This insignificance might be due to the limited availability of water reservoirs in long-run, until water reservoir management is significantly improved. Agricultural credit is also having insignificant t-stat value for long-run. This insignificance may also be due to the ineffective mechanism and distribution of agricultural credit to the farmers.
Area's long-run t-stat value is also insignificant. We can infer that area under wheat cultivation is substantial as compared to other major crops and any major increase in area under wheat cultivation may not be possible in future. Thus, we do not expect any visible contribution of area towards increase in wheat production in long-run.
In the long run fertilizers is only variable having significant t-stat value which is 4.721479. After re-parameterization the coefficient value of fertilizers becomes 0.200691. From this we can infer that 1% increase in fertilizers may cause to increase the wheat production by 0.20%. Fertilizers have dual effect. First they enhance the land fertility and second they increase the growth of plants. Fertilizers in long-run would increase the available land fertility causing to increase the agricultural production. Farmers of this region use natural as well as chemical fertilizers to increase the fertility of land. Hence for this region fertilizers may play important role to increase the wheat production.
The t-stat value for technology is insignificant. The insignificance of the technology shows that the technology adaptation is not frequent for this region. Farmers here are not well equipped regarding new technology. They mostly rely on old method of cultivation because of which it may have insignificant long-run impact on the wheat production. Lack of education and farmer's poor condition are also major reason for adopting new technology. Besides these factors lack of technology transfer is also a reason to create any significant impact on wheat production in long-run.
In long-run we do not observe any significant positive or negative impact of climate change factors, e.g. temperature, CO2 and precipitation, on the production of wheat in Pakistan.
3.4 ARDL-Error Correction Model (ECM)
The dynamic results of the error correction model are reported in . The coefficient sign of ECM term is negative and significant. The higher value of ECM shows fast adjustment process. From the results we can infer that the value of ECM term necessitates that change in wheat production from short run to long span of time is corrected by almost 87% each year with high significance. Thus disequilibrium occurring due to a shock will take slightly more than a year to attain the equilibrium. The results show that any negative shock to wheat production in short-run will be adjusted by area and fertilizers. Consequently, area and fertilizers will play an important role to absorb any negative shock to wheat production.
Table 4 Error Correction Model Results.
To check the stability of the ECM we incorporated CUSUM and CUSUMSQ tests. The results of the tests are presented in graphical form. The and demonstrate that the CUSUM and CUSUMSQ lines are within the critical band of 5% significance level over time. The graphical results confirm that ECM model is stable in our case.
4 Conclusion and Recommendations
Wheat is main food crop of Pakistan. The objective of this study is that whether the newly emerging threat of climatic change is influencing the level of wheat production in Pakistan or not. For this purpose the Autoregressive Distributed Lag (ARDL) model is used in this study in order to check the impact of climate change on wheat production in Pakistan. The study used data of the last half century. The results of historical data estimation revealed that up to now there is no short-run and long-run impact of climate change variables on wheat production in Pakistan. However, in short run land under wheat cultivation and fertilizers could play important role to offset any kind of negative shock to wheat production. Whereas, the long-run results revealed that fertilizers would be the only remedy to counter any deficiency of wheat production.
Keeping in view the results following adaptation strategies are suggested in case of any adverse shock to wheat sector;
| 1 | Government is required to promote the culture and mechanism of research and development to secure food for its population. In this regard new fertilizers are needed to be produced. | ||||
| 2 | In order to avoid the problem of food insecurity of wheat in future due to any adverse shock, the government may have to promote farmers by offering them fertilizers at subsidized prices. | ||||
| 3 | Government is required to increase the arable land area by offering the government owned virgin land area and communal/undivided land area to the deserving farmers/landowners on lease/ownership basis. | ||||
tjls_a_12128392_sm0001.doc
Download MS Word (187.5 KB)Acknowledgements
We are thankful to Mr. Nasir Awan and Mr. Muhammad Ramzan, Research Economists, Pakistan Institute of Development Economics Islamabad, for their valuable comments.
Notes
1 Evapotranspiration is the sum of evaporation and plant transpiration from the Earth's land surface to atmosphere.
2 In the 2nd stage of photosynthesis process dark reaction occurs in stroma of plastid. It has been named as C3 because during carbon fixation 3 carbon molecules are produced. Plants having this reaction during photosynthesis process are called C3 plants (Raven and Edwards, 2001) [Citation8].
3 Transpiration is loss of water by plant during exchange of gases.
4 PC application Eviews5 and Microsoft Excel worksheet have been used for the purpose of estimation.
References
- Stern, Stern Review: The Economics of Climate Change, HM Treasury England, http://siteresources.worldbank.org/INTINDONESIA/Resources/226271-1170911056314/3428109-1174614780539/SternReviewEng.pdf, (2006).
- R.MothaW.BaierImpact of Present and Future Climate Change and Climate Variability on Agriculture in the Temperate Regions: North AmericaClimate Change702005137164
- M.RosegrantM.EwingG.YoheI.BurtonS.HuqR.Valmonte-SantosClimate Change and Agriculture Threats and OpportunitiesFederal Ministry for Economic Cooperation and Development2008136
- W.PearceR.ClineN.AchantaS.FankhauserK.PachauriJ.TolP.VellingaThe Social Costs of Climate Change: Greenhouse Damage and the Benefits of ControlP.BruceH.LeeF.HaitesClimate Change 1995: Economic and Social Dimensions1996Cambridge University Press179224
- R.WarrickCarbon Dioxide, Climate Change and AgricultureThe Geographical Journal15421988221233
- World Bank Report, Climate Change Strategy for South Asia Region, http://siteresources.worldbank.org/SOUTHASIAEXT/Resources/Publications/448813-1231439344179/5726136-1232505590830/1SARCCSJanuary192009.pdf, (2009).
- A.QureshiA.IglesiasImplication of Global Climate Change for Agriculture in Pakistan: Impacts on Simulated Wheat Production1994Climate Institute Washington DC114
- J.RavenD.EdwardsRoots: Evolutionary Origins and Biogeochemical SignificanceJournal of Experimental Botany52900012001381401
- Pakistan Economic Survey, Chapter 2, Agriculture, Ministry of Finance, Government of Pakistan, Islamabad (2009).
- Carbon Dioxide Information Analysis Center <http://cdiac.ornl.gov/trends/emis/pak.html>.
- M.H.PesaranY.ShinAn Autoregressive Distributed Lag Modeling Approach to Cointegration Analysis, Econometrics and Economic Theory in the 20th Century: The Ragnar Frisch Centennial Symposium, Chapter 111999Cambridge University PressCambridge
- J.DuasaDeterminents of Malaysian Trade Balance: An ARDL Bound Testing ApproachJournal of Economic Cooperation28320102140
- M. J. Frimpong, E.F. Oteng, Bound Testing Approach: An Examination of Foreign Direct Investment, Trade and Growth Relationships, MPRA Paper No. 352: (2006) 1-19.
- M.H.PesaranY.ShinR.J.SmithBounds Testing Approaches to the Analysis of Level RelationshipsJournal of Applied Econometrics162001289326
- R.L.BrownJ.DurbinJ.M.EvansTechniques for Testing for the Constancy of Regression Relationship Over TimeJournal of the Royal Statistical Society1975149192
Appendix A
Supplementary data
Supplementary data associated with this article can be found, in the online version, at http://doi:10.1016/j.njas.2013.11.002.