
 ?Mathematical formulae have been encoded as MathML and are displayed in this HTML version using MathJax in order to improve their display. Uncheck the box to turn MathJax off. This feature requires Javascript. Click on a formula to zoom.
Abstract
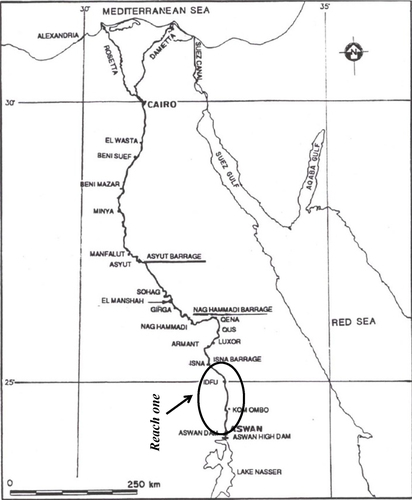
This paper investigates the development of Nile River islands in the first reach which extends between Aswan and new Esna barrages. A wide range of data compiled and used in this investigation which include produced maps in 1939, 1982 and 2003, and hydrological data. Compiled data drew a complete picture for up-to-date information on morphological changes since 1939. The analysis indicated that islands length; thus, area has reduced since 1939. Also, islands tend to reshape by elongating. The reduction in area is attributed in part to the merging of islands in either bank and adjustment of the river to the new flow conditions after the operation of High Aswan Dam. El-Mansouria Island which is the largest island in area was focused on. Recent human interferences accelerated the merging of island in the west bank. Consequently, river morphology has changed around the islands.
1 Introduction
Alluvial islands formation is a natural process influenced by the hydrology and sediment transport capacity of the system. The study of island formation is fundamental in understanding the morphological process of rivers. In Egypt, the first reach which extends for 169.085 km from downstream of Old Aswan Dam till upstream of the new Esna barrages has drawn special attention () since it has the highest flow rate from Aswan to the Mediterranean, and large number of islands. Significant research has been carried out to investigate the process of islands and channel formation. CitationLeopold and Wolman (1957) discussed types of islands. The fluvial island was formed as a result of the deposition of the coarse material from the suspended load. The island formed as a result of the less competence of the river to move the bed load, so it has collected to form the early stage of the island after that it received more deposits to extend in length and width. CitationTorab (1990) studied the effect of High Aswan Dam on the morphology of Damietta branch. Based on the analysis of aerial photos, Torab found that the branch width has declined by 27% between 1956 and 1985. In addition, he documented the morphological changes in islands. He attributed these changes to the change in flow conditions after the construction of High Aswan Dam.
CitationOsterkamp (1998) described several scenarios in which islands could disappear. Perimeter sediment deposition could eliminate an island by several methods. The first method is by preferential in-filling of one of the side channels that effectively raises the bed level in one branch (the minor channel) but not the other, and thereby shifts the flow into a single path. The second method is by sedimentation around the whole perimeter of the island until it eventually coalesces with other nearby islands or the floodplain, again forcing the flow into a single path. A third method of island elimination is by the flow preferentially incising one of the side channels and leaving the other branch ‘high and dry’. This is common downstream of dams after peak flows have been reduced. If a low flow regime persists for long enough, vegetation may accumulate between an island and its floodplain. The meandering nature of a river can cause it to laterally migrate and abandon one of the branches around an island. Floods can eliminate an island by two methods. The first is by simply increasing the flows to levels high enough that the entire island is eroded away. The second one is by changing the main direction of the flow during flood, thereby altering the angle of attack from the water and gradually wearing away the island by abrasion. CitationHam and Church (2002), studied bar growth and islands development during the twentieth century in a gravel reach of Fraser River in the Province of British Columbia in Canada. They found that below-average flood between 1977 and 2002 caused vegetation growth which got matured on elevated bar surfaces, thus, creating new island area. In addition, bed material influx to the reach was being increasingly deposited along or adjacent to high bar or island surfaces rather than within main flow channel. As a result, islands had grown in size and narrowing and deepening channel took place. The authors did not quantify the relation between the hydrological characteristics and islands growth.
This study describes the hydrological and morphological conditions of the first reach and focuses on the geometrical characteristics of islands between Aswan and new Esna barrages. Historical data collected between 1982 and 2003 are used to investigate change in islands morphology with time.
2 Data collection and procedures
Large set of data were compiled and used in the analysis which is grouped in two categories. The first category is the data deducted from the historical maps available at Nile Research Institute. These data are the hydrographic maps of Nile River bed produced in 1982 and 2003. The hydrographic maps of 1982 were produced by Kenting Earth Sciences LTD in 1982 at a scale 1:5000 for Nile Research Institute. While Hydrographic data of 2003 was produced by Nile Research Institute for the Ministry of Water Resources and Irrigation at scale 1:5000. In addition, inland topographic maps produced in 1939 were used in counting islands number and their geometrical properties. Islands numbers, locations and geometrical characteristics like length, width, shape and area were deducted from these maps and summarized in . The islands were defined according to the high water level marks which were defined in the maps. That is, submerged islands were not included in the analysis.
Table 1 The further details regarding island geometry.
The second set of data is the hydrological data set presents water level and flow rate downstream Aswan Dam. The flow rate presents the conditions downstream Aswan Dam after and before the operation of High Aswan Dam. Water levels at various staff gauges along the reach between Aswan and new Esna barrages were compiled.
3 Hydrology of the 1st river reach
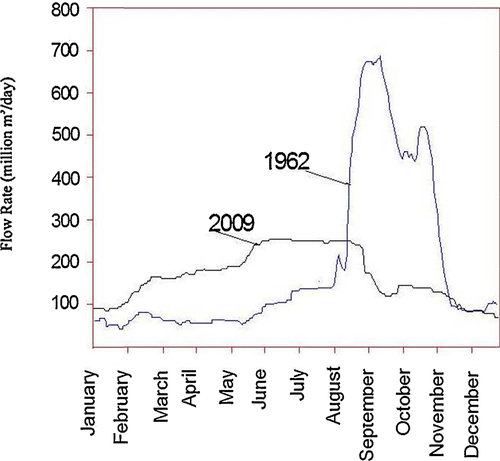
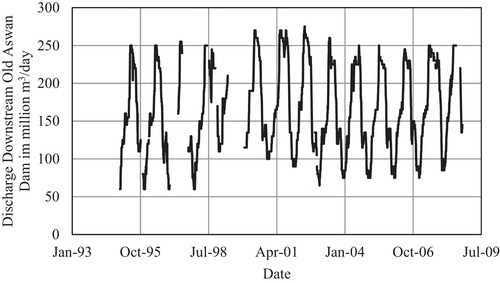
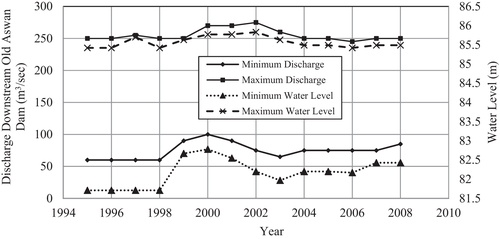
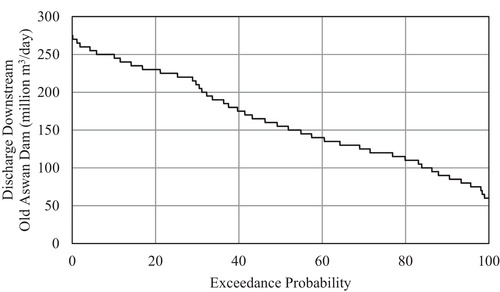
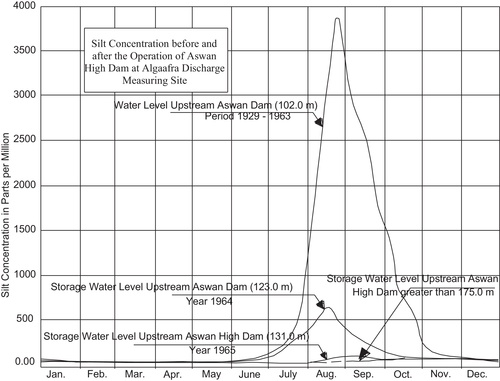
The operation of High Aswan Dam has its influence on flow rate and flow level downstream Aswan Dam throughout the year. Historical records () show remarkable reduction in the maximum flow rate after High Aswan Dam. Although, Nile River is regulated by High Aswan Dam throughout the year, the analysis of hydrological data set shows slight increase in the released flow from High Aswan Dam during the period between 1995 and 2008 (). The variation on flow discharge throughout the water year which extends between August and july of the following year is remarkable. During the period of maximum flow rate, discharge can reach up to 4.5 time the minimum flow rate (). The fluctuation in the flow rate is reflected on the water level downstream Aswan Dam (). Flow frequency analysis indicates that exceedance probability of 250 million m3/day is 5% of 160 million m3/day is 50% (). The suspended sediment transport, which normally contributes the majority of sediment transport, has been reduced after the construction of High Aswan Dam from 3800 ppm to 129 ppm during the flood period (). The reduction in suspended sediment has its implications on the river morphology as will be discussed later. On conclusion, the flow rate had dropped sharply after the operation of High Aswan Dam and suspended sediment transport as well. Between 1982and 2003, a little change took place in flow rate.
4 Status of islands between Aswan and new Esna barrages
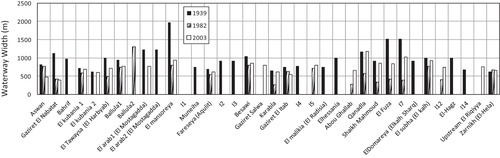
The recent hydrographic survey of the Nile River carried out in 2003 indicated that the total number of islands between Aswan and new Esna barrages is 23 (). These islands were identified according to the maximum water level as mentioned previously. Analysis of data indicates a reduction in the island area from 4841.96 feddan in 1982 to 3811.24 feddan in 2003. That is, the reduction of area is 27% over nearly 20 years period, further details regarding island geometry is summarized in . From the analysis of data in , it can be concluded that area and number of islands has decreased. The reduction of the number of islands can be attributed in part to the merging of islands with the east or west bank. In some cases, islands were merged together into one island. Roadway culvert and earth dams which are manmade structure have their impacts in accelerating the aggradation process and the merge of islands with banks.
Based on through , the number and the area of island has reduced after the operation of High Aswan Dam and regulating the flow rate downstream the dam and reducing greatly rate of suspended sediment transport. The low rate of the suspended sediment transport increased the flow potential to erode islands banks. Period of low and high flow after the operation of High Aswan Dam () has its impact also in merging islands with either right or left bank. During low flow period, flow abundance anabranch and flow mainly in the main branch. Thus, allowing growth of vegetation on the anabranch. During the high flow rate period, vegetation traps bed load and increases bed level in the anabranch. This period of high and low flow may result in merging of islands in banks ().
5 Human factors influencing islands
5.1 Effect of backwater curve on islands
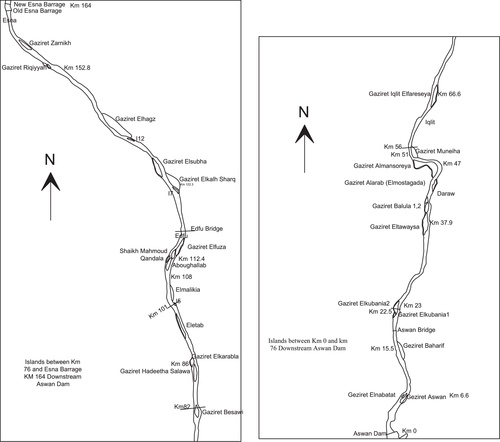
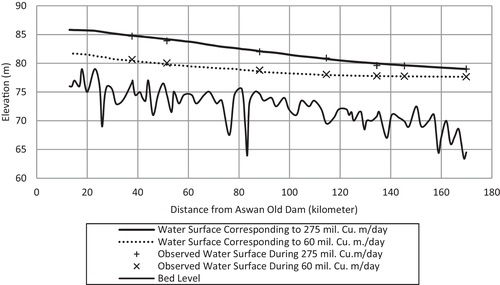
In order to determine the influence of the backwater curve of new Esna barrage on the island development, a one-dimensional numerical model was applied to predict water level upstream new Esna barrage. The model, HEC-RAS 4.1 is developed by the US Corps of Engineering and applies the standard step method to predict the backwater curve. Two scenarios were used in the analysis, the first scenario was during low flow period which is 60 million m3/day, and the second scenario was during the maximum discharge which is 275 million m3/day. The model results were calibrated against manning roughness for the low and high flow conditions as shown in which shows the predicted water surface profile and the measured water surface at specific gauge stations. Manning roughness was adjusted to obtain water surface which matches closely the observed gauges readings at the specific discharges. The low and high water level at islands were deducted from the model results. Thus, islands geometrical characteristics were obtained. From the model results, it can be concluded that the backwater curve extends its effectiveness to 40 km in case of the low flow and 34 km in case of high flow. Two islands lie within the influence of the backwater curve of new Esna barrages. These are El-Riqya Island which is located at km 152.790 and El-Hela Island which is located at km 159.500 downstream of the Old Aswan Dam. The first one did not undergo major changes. However, area of the former one is sharply increased since year 1939. In 2003, the island length has increased and its maximum width as well. Its area has reduced by 33% since 1982. The influence of backwater can be regarded as it reduces the mobility of the flow; thus, increases the aggradation and built up of islands. As the reach undergo low sediment transport rate, the backwater has little effect on islands development.
5.2 The manmade interference
There are five islands underwent human interference through construction of roadway culvert or roadway dam as found from topographic maps and recent version of aerial photographs. These islands are El-Mansouria, Fareseya (Aqulit), Karabla, El-Fuza, and El subha (El-kalh). The roadway culvert accelerated the rate of the island merging in banks and causes changes in the river morphology in the vicinity of the island. Roadway culvert acts as a dam by creating backwater curve in the upstream (CitationRaslan, 2009). The influence of manmade structure on Gaziret El-Mansouria will be focused on.
5.3 Islands after operation of High Aswan Dam
The operation of High Aswan Dam resulted in a drop in the annual flow rate downstream High Aswan Dam. The maximum flow rate dropped from 700 million m3/day during the flood period to 280 million m3/day after operation of High Aswan dam (). This was not the only consequence of the High Aswan Dam, the suspended load has decreased and hence the total load. The decrease in suspended sediment concentration has resulted in the degradation of the river reach after the operation of HAD as reported by CitationShalash et al. (1996). The main features in the Aswan new Esna barrages reach is merging of islands in banks. Thus, reduction of islands in number and area took place after the operation of High Aswan Dam (). The total land area of islands declined from 20.34 km2 (4841.96 feddan) to 16.01 km2 (3801.24 feddan) between 1982 and 2003. In order to characterize the geometrical properties of islands two parameters were calculated:
| 1. | Aspect ratio is a measure of the length/width, | ||||
| 2. | Elongation factor is a measure for the shape of the islands and it indicates islands shape with respect to its area. It can be calculated as follows: | ||||
Table 2 Geometric characteristics of islands in the first reach between 1939 and 2003.
It can be concluded that the reach is still under active process of erosion and sedimentation.
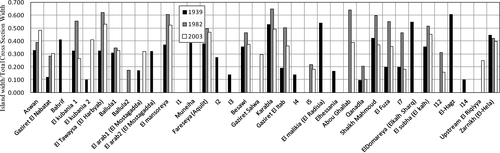
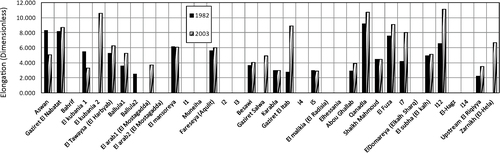
Islands may merge in banks and eroded with the result that the total area of islands are reduced by 27% since 1982. The lack of sediment after the operation of High Aswan Dam resulted in the degradation between Aswan and new Esna barrages. Islands also tend to elongate because of the reduction of its width. In the meantime the waterway width has increased (). shows the relation between Islands width and total cross section width in 1939, 1982 and 2003. When considering and , it can be affirmed that erosion took place for islands banks since the width of flow has increased and the ratio of islands width to cross section width has decreased as in . As a result, islands Elongation has increased between 1982 and 2003 as shown in .
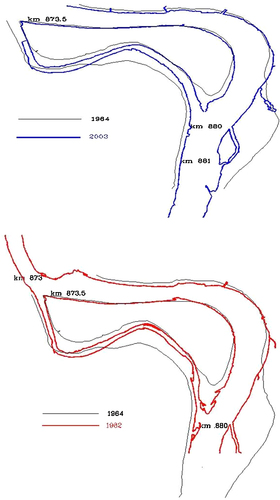
6 El-Mansouria Island
Among the well-known islands in the first reach is El-Mansouria Island for its large area and its fertile land. The Island is located from km 47.350 to km 53.450 downstream of the Old Aswan Dam at the inner curve of the Nile River course. summarizes the geometrical characteristics of the island before the operation of the High Aswan Dam and its current status. A roadway culvert near its downstream end had changed its shape and characteristics. It affected the aggradation and degradation process around the island. The flow capacity has reduced in the western channel. The elevation of the thalweg line in 2006 which follows the deepest point in the western channel has increased since 1982 (). On the other hand, flow rate has increased in the eastern channel causing degradation near the downstream end of the island as can be seen from comparing the thalweg line in 1982 and 2003 ().
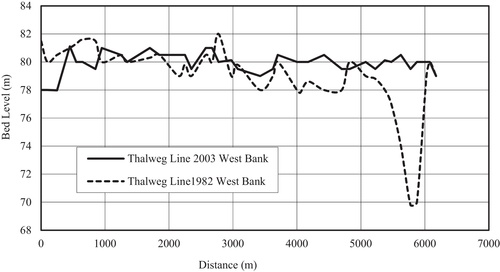
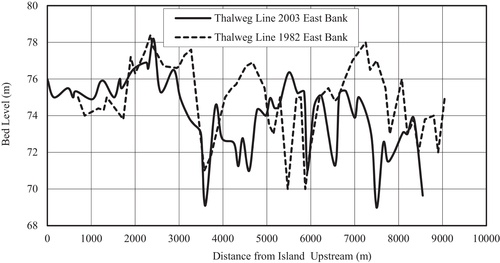
Table 3 Geometrical properties change of El-Mansouria Island.
Between year 1939 and 1982 sedimentation took place at the upstream for 621 m in the upstream direction. The left channel width reduced from 256 m in 1939 to 136 m in 1982. While the right channel reduced from 850 m to 587 m. At the downstream end, since the river course tends to curve to the right, deposition took place at the inner curve. The width of the island has increased near the downstream from 1006 m in 1939 to 1272 m in 1982 (). The most significant changes which happened between 1982 and 2003 were the erosion at the upstream part of the island and thus, the reduction in the island length and width.
7 Effect of wind blown sand on aggradation
CitationAttia and Raslan (2010) studied the effect of wind-blown sand on aggradation on Nile River between Aswan Dam and new Esna barrage. The authors utilized equations proposed by Bagnold (Citation1938, 1943). These equations were based on measurements in the Egyptian Western Desert and wind tunnel. For sand with a mean diameter of 0.25 mm, the sand discharge in metric ton per meter width per hour was:(3)
(3) where u is the wind velocity in centimeters per second at 1 m height, u1 is the threshold velocity at 1 m height which was found equal to 400 cm/s. The equation indicates that only wind speed greater than 4 m/s will lead to the movement of sand. shows the quantity of sediment discharge corresponding to different wind speeds. Western Bank of the Nile River in the Governorate of Aswan is largely exposed to the wind-blown sand of the western desert. It was estimated that 39 km of western bank of the Nile River within the Governorate of Aswan had no vegetation covers or not more than 100 m of vegetation covers. That is, river west bank was in direct contact with desert sand. The wind atlas provided essential information which can be utilized to investigate the potential of desert sand that may be dumped annually in the Nile River (). Although, the wind speed in the domain of Aswan Governorate is not the highest as indicated in the map since it ranges between 4 and 5 m/s (14.4–18 km/h), the west bank of the Nile River in the governorate lacks enough vegetation cover and the right bank is in direct contact with desert sand as indicated previously. According to CitationAttia and Raslan (2010), comparing wind speed obtained from the wind atlas of Egypt with values of sand discharge in , it can be concluded that during a wind speed of 5 m/s (18 km/h) up to 520 t/m/h of sand may be dumped on the agriculture land near Aswan. The final figure may be determined depending on the wind duration and vegetation cover.
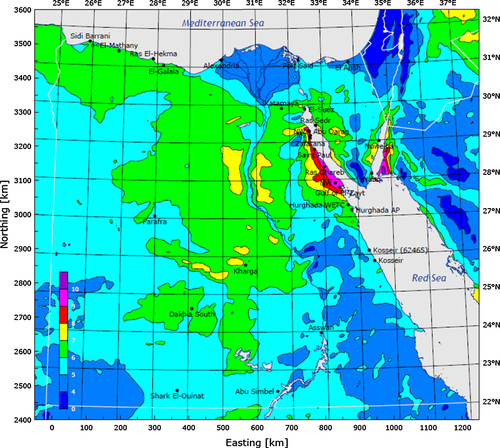
Table 4 Sand discharges related to different wind speed.
8 Conclusions
The reach between Aswan and new Esna barrages was investigated in terms of islands evolvement and morphology changes. Data sets present conditions before the operation of High Aswan Dam, after operation of the dam and present situation were utilized in the analysis. The data analysis indicated that islands areas have decreased after the operation of High Aswan Dam. Several islands were merged with either the right or the left bank. Islands areas are in decline either due to land erosion or merging with banks. Human interference contributes to changes in islands development.
Acknowledgments
The authors would like to thank Nile Research Institute for providing the hydrological data required for conducting the present research sincere efforts are greatly appreciated.
Notes
Peer review under responsibility of National Water Research Center.

References
- K.AttiaY.RaslanCause and Combat of Agriculture Land Desertification in Egypt2010The International Conference on Water Resources and Arid EnvironmentsRiyadh, Saudi Arabia (in press)
- R.A.BagnoldThe Measurements of Sand Storms, vol. 167A1938Proceeding, Royal Society of LondonLondon, England282291
- R.A.BagnoldThe Physics of Blown Sand and Desert Dunes1938William Morrow and Co.New York, NY265
- D.HamM.ChurchChannel Islands and Active Channel Stability in the Lower Fraser River Gravel Reach2002Department of Geography, the University of British ColumbiaVancouver, BC
- L.B.LeopoldM.G.WolmanRiver Channel Patterns: Braided, Meandering and Straight, U.S.G.S. Professional Paper 282-B1957
- NRIResearch Program & Activities Years 1975–19801980Research Institute of Saad El-Aali Side Effects, Bulletin No. 61
- W.OsterkampProcesses of fluvial island formation, with examples from Plum Creek, Colorado and Snake River, IdahoWetlands1841998530545
- Y.RaslanHuman impacts on Nile River morphologyFourteenth International Water Technology ConferenceCairo, Egypt2009
- S.ShalashRiver Nile Island, Report1996Nile Research Institute, National Water Research Center
- M.TorabThe impact of the construction of the High Dam on the morphology of the Damietta BranchA Local Seminar on the Impact of Human Intervention on the Nature of the River Nile, Cairo1990