
 ?Mathematical formulae have been encoded as MathML and are displayed in this HTML version using MathJax in order to improve their display. Uncheck the box to turn MathJax off. This feature requires Javascript. Click on a formula to zoom.
Abstract
The study objective of this work is to test the applicability of the Soil and Water Assessment Tool (SWAT) model to simulate the streamflow through calibration and validation for both daily and monthly basis in the Stung Pursat River catchment, an ungauged sub-catchment of Tonle Sap Basin in Cambodia. In order to achieve the objective of the study, SWAT model was set up with study period of 10 years (2001–2010). Additionally, ArcSWAT2012 and ArcGIS10.2.2 combined with Sequential Uncertainty Fitting-2 (SUFI-2) algorithms were used to conduct uncertainty analysis, calibration and validation of the SWAT model using daily observed streamflow data at the catchment outlet. Daily simulation produced the results with Nash-Sutcliffe Simulation Efficiency (NSE) of 0.38, Percent Bias (PBIAS) of +5.1% and Root Mean square error-observation standard deviation Ratio (RSR) of 0.79 in calibration period, and with NSE of −6.61, PBIAS of −78.38% and RSR of 2.67 in validation period. The streamflow results of monthly time series were improved and acceptable with NSE of 0.60 while decrease the value of PBIAS and RSR to 1.14, and 0.63 respectively. The SWAT model should be used to simulate monthly streamflow in such an ungauged catchment like the Stung Pursat catchment due to data scarcity and uncertainty.
1 Introduction
Cambodia’s economic growth largely depends on agriculture which is one of the largest sector in country constituting 33.5% of national gross domestic product (GDP) and also employed 56% of the labor force (CitationKimsun et al., 2011). However, this sector consumes large amounts of fresh water and often creates water scarcity. Hence, water is the most essential natural resources for sustainable development and poverty reduction in Cambodia. In reality, many communities, including the study site of Stung Pursat River Basin, face problems brought on by too much or too little water. This situation is compounded by the effects of catchment degradation caused by physical alteration of inland water systems (both quantity and quality), deforestation and habitat destruction, water withdrawal for agriculture, mining and urbanization, pollution, and hydrological and environmental changes due to infrastructure developments within and outside of Cambodia (CitationMOE, 2013). Thus, the study of streamflow or water resources availability in a catchment using scientific methods and approaches can help identify environmental problems in terms of land use changes, soil degradation and climate changes. Hydrological models are frequently applied for the estimation of reliable quantity of streamflow and the associated sediment transportation from upland areas into downstream watercourses, lakes and reservoirs (CitationHassen et al., 2016). Nowadays, there are many hydrological models to help calculate the water discharge more accurately, easily and quickly than the traditional measurement method. One of them is SWAT (Soil and Water Assessment Tool) model which is a basin-scale model integrated with ArcGIS to help improve the accuracy of simulated result of streamflow from rainfall and physical properties of the basin. The SWAT model has good reputation for best use in agricultural watersheds and its uses have been successfully calibrated and validated in many areas around the world. Additionally, SWAT has gained international acceptance as a robust interdisciplinary watershed modeling tool as evidenced by international SWAT conferences, hundreds of SWAT-related papers presented at numerous other scientific meetings, and large number of articles published in many journals (CitationGassman et al., 2007). The SWAT model has been applied to watershed-scale projects in different parts of the world such as the United States, the European Union (CitationBarlund et al., 2007), China (CitationHao et al., 2004), India (CitationKaur et al., 2004), Australia (CitationSun and Cornish, 2006) and Africa (CitationSchuol and Abbaspour, 2006). Results show that SWAT is capable of simulating streamflow and sediment loads of a river basin with satisfactory accuracies. In addition, the SWAT model has been successfully applied to simulate the streamflow in the Mekong River Basin which is one of the largest drainage areas in the region (CitationRossi et al., 2009). The statistical evaluation results for the Mekong River model calibration and validation showed that the Nash–Sutcliffe efficiency (NSE) monthly and daily values generally range between 0.8 and 1.0 for all of the monitoring stations. This result demonstrates that the model can potentially be used as an effective water quantity tool within this extremely large basin. Furthermore, the SWAT model has been applied to predict streamflow in other regions in the world. CitationHassen et al. (2016) used SWAT model to predict streamflow in tropical Maybar watershed. The results showed that SWAT model captured the amount and variability of monthly streamflow hydrograph time series very well both in calibration and validation periods. CitationJohn et al. (2011) made a preliminary assessment of the performance of a complex watershed model (SWAT model) in predicting stream flow on the Naro Moru river catchment in Ewaso Ngiro river basin, Kenya. The application of most hydrological models often requires a large amount of spatially variable input data and a large number of parameters. Due to the lack of high-quality input data and conceptual simplification of environmental processes, these models need to be calibrated, by varying degrees, to the observed hydrologic variables (CitationBeven, 2006; CitationGupta et al., 2008; CitationSrinivasan et al., 2010; CitationWagener et al., 2004). Since one technique cannot be applied to all situations and different projects, many procedures have become available to perform calibration and uncertainty analyses. CitationAbbaspour et al. (2007) have linked three programs to the hydrologic simulator SWAT (CitationArnold et al., 1998) under the same platform, SWAT-CUP (SWAT Calibration Uncertainty Procedures). These procedures include: Generalized Likelihood Uncertainty Equation (GLUE) (CitationBeven and Binley, 1992), ParaSol (CitationVan Griensven and Meixner, 2006), and Sequential Uncertainty Fitting Ver.2 (SUFI-2) (CitationAbbaspour et al., 2007). To successfully apply hydrological models in practical water resources investigations, careful prediction uncertainty analysis and calibration are required (CitationDuan et al., 1992). For example, CitationPerry (2015) applied SWAT hydrological model to simulate runoff in the B73A quaternary catchment located east of Blyde River Canyon in South Africa. The observed discharge data was used to calibrate and validate the using SUFI-2 method in the SWAT-CUP program. Results from calibration showed good agreement between observed and simulated monthly stream flow data (NSE = 0.80, R2 = 0.83 and percent bias PBIAS = 12.6%). Moreover, CitationNkonge et al. (2014) made a study on the application and comparison of two calibration-uncertainty methods for a distributed model in the Upper Tana Basin. Two uncertainty analysis techniques, including the GLUE and SUFI-2 were applied to assess the uncertainty of hydrological modeling results of the SWAT model. The result of this study showed that the best method for calibration and uncertainty analysis is SUFI-2 since SUFI-2 provided satisfactory statistical indicator (NSE = 0.49 and R2 = 0.64), comparing to GLUE (NSE = 0.42 and R2 = 0.62). So based on researches mentioned above, it is seen that the SWAT model was successful applied in many places to conduct various studies related to water resource system. Moreover, the SWAT-CUP which is an auto-calibration tool was selected to calibrate and validate the SWAT model with SUFI-2 method by providing the sufficient results.
Water resources in Stung Pursat catchment are very significant for irrigation development and domestic use. However water resources in Stung Pursat catchment are increasingly under pressure due to significant increases in paddy rice production and irrigated area and diversion of water to neighboring catchments for agriculture. The study objective of this work is to test the applicability of the SWAT model to simulate the streamflow through calibration and validation for both daily and monthly basis in the Stung Pursat River catchment, one of sub-catchment of Tonle Sap Basin in Cambodia.
2 Materials and methods
2.1 Study area
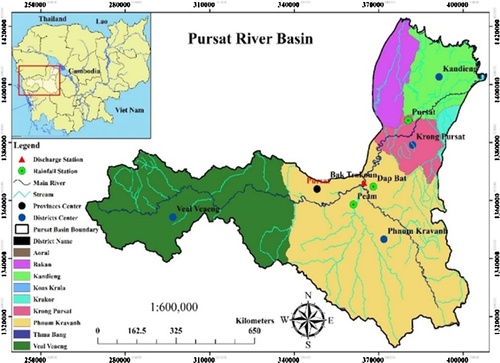
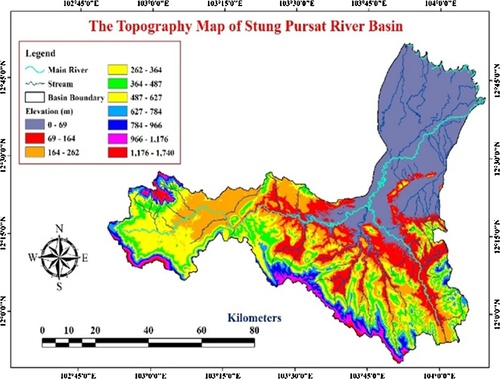
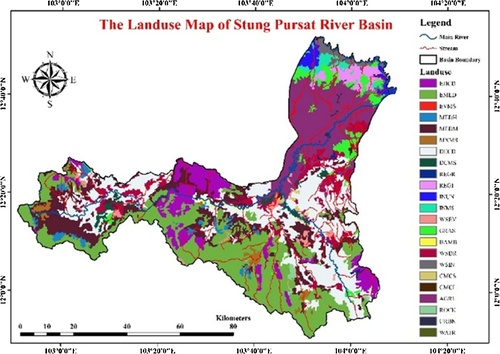
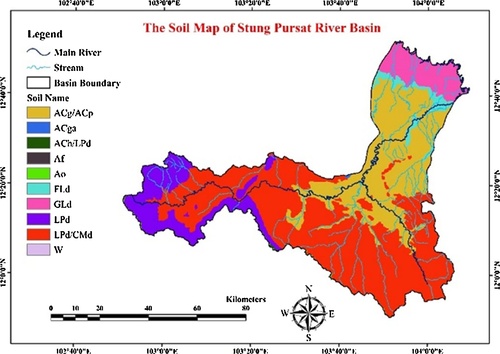
The Stung Pursat catchment is located in Pursat province, south of the Tonle Sap Lake, and drains an area of 5955 km2 (). The catchment is shared by six districts: Veal Vong, Kravanh, Sampov Meas, Krakor, Bakan and Kandieng (CitationCNMC, 2011). With an annual average discharge of 2818 MCM into the Tonle Sap Lake, Stung Pursat originates on the drier eastern slopes of the Cardamom Mountains and flows for approximately 150 km (CitationJICA, 2011). Two main tributaries, the Stung Peam and Stung Santre (Prey Khong) rivers, flow in a northerly direction and meet the Pursat River just above Bac Trakuon (CitationCNMC, 2011; CitationJICA, 2011). Elevations in the Pursat catchment range between 6 and 1717 m (masl) (). More than 75% of the catchment encompasses a hilly terrain, with an elevation greater than 30 m, and is covered by forested land of varying densities (CitationJICA, 2011). The remaining low-lying land is used by agriculture (). Major soil types in the Pursat catchment are Dystric Leptosol and Cambisol in the upper reaches; Gleyic and Plintic Acrsols in the mid-elevation reaches and; Dystric Fluvisol and Dystric Gleysol in the lower elevation reaches (CitationCNMC, 2012) (). Climate in Pursat catchment is influenced by tropical monsoon systems with distinct wet and dry seasons. The wet season, extending from May to November, is dictated by the southwest monsoon system, and receives approximately 90% of the total annual rainfall (CitationCNMC, 2012). The annual average rainfall ranges from 1200 mm to 1700 mm (CitationJICA, 2013).
2.2 SWAT model description
The SWAT model is a free software and was developed at the USDA-ARS (CitationArnold et al., 1998) during the early 1970’s. SWAT model which is a physically based model was developed for application to large and complex watersheds over long periods of time. Furthermore, it is a flexible framework that allows a simulation of a wide variety of conservation practices and other best management practices such as fertilizer and manure application rate and timing, cover crops, filter strips, conservation tillage, irrigation management, flood prevention structures, grassed waterways, and wetlands (CitationGassman et al., 2007). SWAT is a physically based model and hence it requires extensive physical parameters to represent the real hydrological processes in the catchment scale.
From topography data, the watershed is divided into number of sub-catchments. The use of sub-catchments in a simulation is particularly beneficial when different areas of the catchment are dominated by land-uses or soils dissimilar enough in properties to impact hydrology. Every sub-catchment is then subdivided into Hydrologic Response Units (HRUs). Every HRUs is a unique combination of land-use, soil, and management practices in a sub-catchment. Input information for each sub-catchment is grouped into the following categories: climate; hydrologic response units or HRUs; groundwater; and the main channel or reach, draining the sub-catchment. The water balance in SWAT is given as following:
(1)
(1)
where SWt is the final soil water content (mm H2O), SW0 is the initial soil water content on day i (mm H2O), t is the time (mm H2O), Rday is the amount of rainfall on day i (mm H2O), Qsurface is the amount of surface runoff on day i (mm H2O), Ea is the amount of actual total evaporation on day i (mm H2O), Wseep is the amount of water entering the vadose zone from the soil profile on day i (mm H2O), and Qgr is the amount of groundwater flow on day i (mm H2O).
2.3 Data acquisition
As mentioned briefly, SWAT which is a physically based model requires much specific information about the basin in order to be able to represent a complex hydrological process. Thus, the minimum required data of SWAT model are topography, land-use, soil properties and weather data which were collected from different sources and databases, summarized in .
Table 1 The available input data for setting SWAT model.
2.4 Sensitivity analysis
Sensitivity analysis is used to estimate the rate of change in model outputs in relation to change in the model inputs. It helps to determine which parameters are important for accurate results. It facilitates understanding the behaviors of the system being modeled, as well as evaluating the applicability of the model (Abbaspour, 2012). SWAT-CUP used the multiple regression analysis to determine the sensitive parameters. Then, the Student’s t-distribution which is a statistical distribution was used to get the statistic value (p-value) of each parameter. The smaller in value of the p-value, the more sensitive and significant the parameter is. Generally, a p-value of <0.05 is the accepted point at which to reject the null hypothesis (Abbaspour, 2012). Based upon several previous studies that were conducted near by the study area, especially, in some catchments of Lower Mekong Basin (CitationRossi et al., 2009) and Tole Sap lake (CitationLy and Oeurng, 2015), 15 parameters were chosen to do sensitivity analysis in order to determine which parameters were most sensitive in the simulated streamflow, see . SWAT simulations have been done for the period 2001–2010, where the simulation period 2001–2002 serves as a warm-up period for the model and is not considered in the sensitivity analysis and calibration process. SWAT-CUP combined with SUFI-2 method to conduct the sensitivity analysis for a period of 5 years (2003–2007).
Table 2 The selected parameters with initial parameter ranges put into SWAT-CUP program with SUFI-2 method for the parameter sensitivity analysis.
2.5 Model calibration
Model calibration involves the modification of parameter values and comparison of predicted output of interest to measured data until a defined objective function is achieved (CitationJames and Burges, 1982). After the most sensitive model parameters were identified, these were used for the calibration of the SWAT models by using SWAT-CUP combined with SUFI-2 method again. They were automatically adjusted in order to simulate the streamflow to meet the observed value. Anyways, the model calibration process was performed for the same period (2003–2007) as the sensitivity analysis period.
2.6 Model validation
The purpose of model validation is to establish whether the calibrated model has the ability to predict a streamflow comparing to observed streamflow for later time periods without making further adjustment of parameters which may adjust during calibration process. This validation process is also conducted by using ArcSWAT program. In this study, the data for a period of 3 years (2008–2010) was used for the model validation process.
2.7 Model performance evaluation
CitationMoriasi et al. (2007) recommended three quantitative statistics be used in model performance evaluation in watershed simulations: The Nash–Sutcliffe efficiency (NSE), percent bias (PBIAS) and ratio of the root mean square error to the standard deviation of measured data (RSR). Moreover, CitationMoriasi et al. (2007) suggested a general performance rating for the recommend statistics for SWAT model simulation as presented in .
Table 3 Performance ratings of recommended statistics for streamflow simulation.
The Nash–Sutcliffe simulation efficiency (NSE) indicates how well the plot of observed versus simulated value fits the 1:1 line. If the measured value is the same as all predictions, NSE is 1. If the NSE is between 0 and 1, it indicates deviations between measured and predicted values. If NSE is negative, predictions are very poor, and the average value of output is a better estimate than the model prediction (CitationNash and Sutcliffe, 1970). NSE is defined as:
(2)
(2)
where is the ith observed streamflow,
is the ith simulated streamflow, and
is the mean of observed data.
Percent bias (PBIAS) measures the average tendency of the simulated values to be larger or smaller than their observed counterparts (CitationGupta et al., 1999). The optimal value of PBIAS is zero, indicating exact simulation of observed values. In general, a lower value of PBIAS signifies accurate model simulation. PBIAS, which is the percent deviation of simulated data, is calculated as:
(3)
(3)
The RSR is an error index that standardizes the root mean square error using the observations’ standard deviation. RSR ranges between 0.0 and +1, with low values indicating good model performance. When RSR = 0 indicates that the model simulation fits perfectly to the measured data, while the large positive RSR values indicate a poor model performance (CitationMoriasi et al., 2007). RSR is calculated as:
(4)
(4)
3 Results and discussion
3.1 Model setup and sensitivity analysis
SWAT model requires the following main data to be performed: landuse, soil characteristics, topography, and climate data. Firstly, raster maps — topography, landuse, and soil were imported into ArcSWAT 2012 interface. Next, soil and landuse characteristics were overlaid for each sub-catchment. In addition, the weather data were defined. Finally, it was ran and simulated a 10-year period with 2 years warm-up from 2001 to 2002. SWAT-CUP with SUFI-2 method was used to conduct the sensitivity analysis for a period of 5 years (2003–2007) as previously described. The results of the parameters sensitivity analysis were identified and presented in which shows that the 7 most sensitive parameters related to streamflow simulation at outlet of the Stung Pursat River Basin among the 15 input parameters. The most sensitive parameters were shown from the least to the most sensitivity, based on their p-values.
Table 4 Most sensitive parameters for stremflow simulation in Stung Pursat River Basin.
3.2 Model calibration
After the most sensitive parameters related to streamflow simulation were selected during the sensitivity analysis, the calibration process both daily and monthly time series were conducted for a period of 2003–2007 with SWAT-CUP program again to define the optimum value of those parameters as illustrated in .
Table 5 Final auto-calibration result of fitted sensitive parameters.
3.2.1 Daily time series simulation
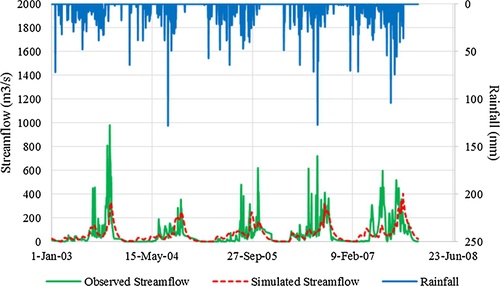
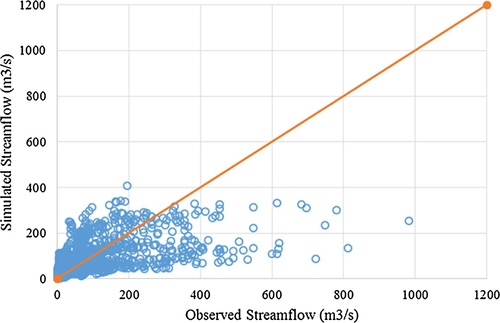
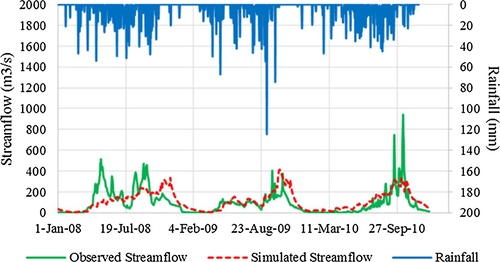
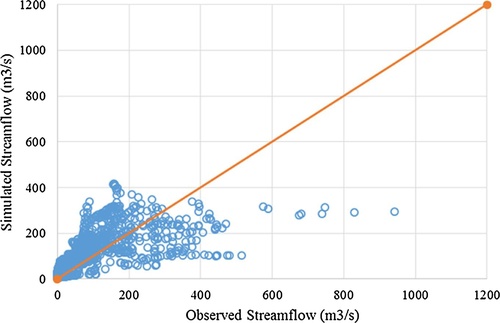
The statistical indicators showed a regression between the daily observed and simulated streamflow with NSE of 0.38, PBIAS of +5.1% and RSR of 0.79, respectively. The hydrograph of the daily observed versus simulated streamflow can be observed in general that the trends of the simulated and observed hydrograph were largely different (). Additionally, the model simulated low stream flow in the catchment particularly during peak flows than what were observed. This could be attributed to the representation of observed rainfall mainly at the upstream area with no observation and flow data since it’s obviously seen that the time of peak flows were not corresponded to the time of maximum rainfall intensity during the study period (.). The scatter plot between the simulated and observed streamflow given in , illustrated that the model has underestimated the streamflow since most of the simulated and observed value were under the line 1:1. This should be attributed to land-use largely changed in this period.
3.2.2 Monthly time series simulation
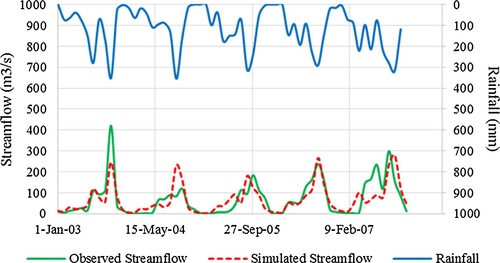
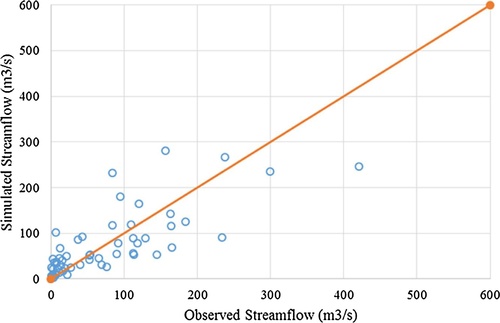
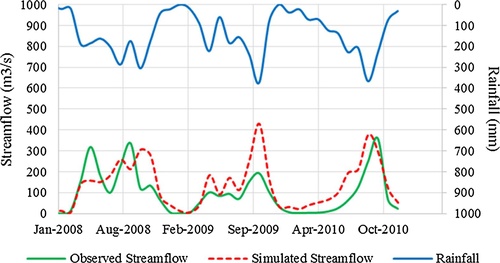
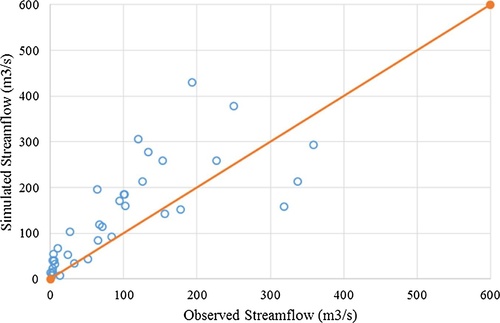
However, the monthly time series simulation seem to be better, which in turn improved the NSE to 0.60 while decrease the value of PBIAS and RSR to 1.14, and 0.63 respectively. showed that the simulated and observed hydrograph followed the similar pattern and the peaks position was better. The time of peak flows were also corresponded to the time of maximum rainfall intensity during the year. However, the model slightly failed to capture the value of peak flows during this calibration period. The scatter plot between the simulated and observed streamflow shows a very good agreement between simulated and observed streamflow values since both values tend to be close to 1:1 line and it was also found that the model has a predictive capability ().
3.3 Model validation
3.3.1 Daily time series simulation
The statistical indicators still showed a regression between the daily observed and simulated streamflow during validation period with NSE of −6.61, PBIAS of −78.38% and RSR of 2.67, respectively. Additionally, both and indicated a slight relation between simulated and observed streamflow, attributed to some data uncertainty like rainfall representative recorded improperly in this large catchment particularly at the upstream mountainous areas. Furthermore, water withdrawals were not taken in the model input since there was no available record of water diversion for any purposes.
3.3.2 Monthly time series simulation
The result of monthly flow validation was not sastified since the values of three statistical indicators: NSE, PBIAS and RSR are all unsatisfied with the number of 0.27, −41.86 and 0.85 respectively. The scatter plot between observed and simulated streamflow () and the hydrograph of observed versus simulated discharge () also showed some overestimation, attributed to the water diversion for daily use and irrigation at the upstream part along the Stung Pursat River catchment that were not considered in this study as previously mentioned due to poor data record from the relevant water agencies. Moreover, the streamflow data were not well measured since during the validation periods (2008–2010) with major floods occurred. possibly explained by the low accuracy of the discharge measurement and stage discharge relationship. Significant land use change due to deforestation upstream can also contribute to model uncertainty in streamflow modeling in this catchment and only static land use has been used in the model.
4 Conclusions
The results of this study showed that SWAT model fairly well performed in capturing the amount and variability of daily and monthly streamflow hydrograph time series both in calibration and validation periods. However, it gives an indication on the possibility of model applicability for local conditions. Better model performance results were attained during monthly time series calibration period giving a satisfactory value of NSE = 0.6, PBIAS = 1.14 and RSR = 0.63. This indicated an acceptable performance of the model at monthly time scale in the data scare region. Therefore, the SWAT model should be used to simulate monthly streamflow in such an ungauged catchment like the Stung Pursat catchment due to data scarcity and uncertainty.
References
- K.C.AbbaspourM.VejdaniS.HaghighatSWAT-CUP Calibration and Uncertainty Programs for SWAT. Eawag Web2007 https://www.mssanz.org.au/MODSIM07/papers/24_s17/SWAT-CUP_s17_Abbaspour_.pdf (Accessed 24 September 2016)
- J.G.ArnoldR.SrinivasanR.S.MuttiahJ.R.WilliamsLarge-area hydrologic modeling and assessment: part I model developmentJ. Am. Water Resour. Assoc.34119987389
- I.BarlundT.KirkkalaO.MalveJ.KämäriAssessing the SWAT model performance in the evaluation of management actions for the implementation of the Water Framework Directive in a Finnish catchmentEnviron. Model. Soft.2252007719724
- K.BevenOn undermining the science?Hydrol. Proc.2014200631413146
- K.BevenA.BinleyThe future of distributed models: model calibration and uncertainty predictionHydrol. Process631992279298
- CNMC (Cambodia National Mekong Committee)Profile of Sub Area Tonle Sap (SA-9C)2011Mekong River CommissionPhnom Penh
- CNMC (Cambodia National Mekong Committee)Basin Development Plan ProgramProfile of the Tonle Sap Sub-area (SA-9C)2012CNMCPhnom Penh
- Q.DuanS.SorooshianV.K.GuptaEffective and efficient global optimization for conceptual rainfall-runoff modelsWater Resour. Res.284199210151031
- P.W.GassmanM.R.ReyesC.H.GreenJ.G.ArnoldThe soil and water assessment tool: historical evelopment, applications, and future research directionsTrans. ASABE504200712111250
- H.V.GuptaS.SorooshianP.O.YapoStatus of automatic calibration for hydrologic models: comparison with multilevel expert calibrationJ. Hydrol. Eng.421999135143
- H.V.GuptaT.WagenerY.LiuReconciling theory with observations: elements of a diagnostic approach to model evaluationHydrol. Proc.2218200838023813
- F.HaoX.ZhangZ.YangA distributed non-point source pollution model: calibration and validation in the Yellow River BasinJ. Environ. Sci.1642004646650
- M.Y.HassenM.M.AssefaZ.GeteA.TenaStreamflow prediction uncertainty analysis and verification of SWAT model in a tropical watershedEnviron. Earth Sci.752016806 10.1007/s12665-016-5636-z
- L.JamesS.BurgesSelection, Calibration, and Testing of Hydrologic Models1982437470
- JICA (Japan International Cooperation Agency)Report on Examination of Impact of New Dam Plans on the West Tonle Sap Irrigation Rehabilitation Project in Pursat River Basin2011MOWRAMPhnom Penh
- JICA (Japan International Cooperation Agency)Brief Progress Report on the Water Balance Examination Study for Pursat and Baribor River basins2013MOWRAM
- P.O.JohnA.MohammedO.M.LawrenceModelling of streamflow of a catchment in KenyaJ. Water Resour. Prot.2011
- R.KaurR.SrivastavaR.BetneK.MishraD.DuttaIntegration of linear programming and a watershed-scale hydrologic model for proposing an optimized land-use plan and assessing its impact on soil conservation—a case study of the Nagwan watershed in the Hazaribagh district of Jharkhand, IndiaInt. J. Geogr. Inf. Sci.18120047398
- T.KimsunH.SochethP.SantosWhat Limits Agricultural Intensification in Cambodia. The Role of Emigration Agricultural Extension Services and Credit Constraints2011
- S.LyC.OeurngClimate change and water governance in Stung Chrey Bak Cathment of Tonle Sap Great Lake Basin in Cambodia15th Annual Conference of the Science Council of Asia (SCA)Siem Reap, Cambodia2015134138
- MOE (Ministry of Environment)Synthesis Report On The Cambodian Hydro-Meteorological Information System (HMIS) — Focus on Disaster Risk Management (DRM) and Climate Change Adaptation Planning, Pilot Program for climate Resilience (PPCR) Phase I2013
- D.N.MoriasiJ.G.ArnoldM.W.Van LiewR.L.BingnerR.D.HarmelT.L.VeithModel evaluation guidelines for systematic quantification of accuracy in watershed simulationsTrans. ASABE5032007885900
- J.E.NashJ.V.SutcliffeRiver flow forecasting through conceptual models part I—a discussion of principlesJ. Hydrol.1031970282290
- L.K.NkongeJ.K.SangJ.M.GathenyaP.G.HomeComparison of two calibration-uncertainty methods for Soil and Water Assessment Tool in stream flow modellingProceedings of Sustainable Research and Innovation Conference2014168171
- K.A.PerryApplication of the SWAT Hydrological Model in a Small, Mountainous Catchment in South Africa2015University of Pretoria
- C.G.RossiR.SrinivasanK.JirayootT.Le DucP.SouvannabouthN.BinhP.W.GassmanHydrologic evaluation of the lower Mekong River basin with the Soil and Water Assessment Tool modelInt. Agric. Eng. J.181–22009113
- J.SchuolK.C.AbbaspourCalibration and uncertainty issues of a hydrological model (SWAT) applied to West AfricaAdv. Geosci.92006137143
- R.SrinivasanX.ZhangJ.G.ArnoldSWAT ungauged: hydrological budget and crop yield predictions in the Upper Mississippi River BasinTrans. ASABE535201015331546
- H.SunP.S.CornishA catchmentbased approach to recharge estimation in the Liverpool Plains, NSW, AustraliaAust. J. Agric.2006
- A.Van GriensvenT.MeixnerMethods to quantify and identify the sources of uncertainty for river basin water quality modelsWater Sci. Technol.53120065159
- T.WagenerM.SivapalanJ.J.McDonnellR.HooperV.LakshmiX.LiangP.KumarPredictions in ungauged basins (PUB): a catalyst for multi-disciplinary hydrologyEos Trans. AGU85442004451452