
 ?Mathematical formulae have been encoded as MathML and are displayed in this HTML version using MathJax in order to improve their display. Uncheck the box to turn MathJax off. This feature requires Javascript. Click on a formula to zoom.
Abstract
In the context of implementing and modifying pump stations, this study was commenced with the purpose of enhancing the flow pattern at their upstream. For that, a hydraulic study using fixed bed physical model was carried out to investigate the non-uniformity of flow distribution due to the formation of separation zone upstream of Lateral Pump Station (New Hafeer Pump Station). A new approach was investigated in the model to reduce the separation zones activity without any adverse impacts on the operation process. The approach is a combination of installing series of small Spur Dykes and Humps at the drain where the station is located. Four complementary modifications using the new approach were proposed and simulated. The results indicated the effectiveness of the investigated approach in eliminating the separation zone and hence improving the approach flow at the station entrance which makes the station units to withdraw regular and equal discharges.
1 Introduction
Flow separation and the formation of recirculation zones have broad and significant consequences for the morph-dynamics of a river. The presence of a separation zone combined with a recirculation vortex can decrease the effective channel width and thus reduce the channel conveyance capacity. Changes in the direction of channel boundaries that lead to an adverse pressure gradient or induce sufficient inertia within the flow will produce flow separation from the boundary, which often leads to the formation of a zone of flow recirculation (CitationKoen et al., 2013). Flow separation decreases the effective channel width and thus reduces the channel conveyance capacity, which can alter morphological patterns (CitationFerguson et al., 2003; CitationKleinhans et al., 2009). Separations zones represent an obstacle for passing canals design discharges as a result of formatting sedimentation layers with potential impacts on ecological diversity, river plan form evolution and floodplain sedimentology (CitationBurge and Smith, 2009). Flow separation has been simulated by means of three-dimensional (3-D) eddy resolving techniques in open channel bend. It was concluded that the three-dimensional numerical models could not resolve the flow separation with high accuracy. This refers to the turbulence which plays a crucial role in the generation of flow separation in bends (CitationVan Balen et al., 2010; CitationKoen et al., 2013). The reduced flow depth near the convex bank further reduces flow velocities, which increase flow recirculation, and the reattachment of the internal shear layer. Because the turbulence-induced secondary flow, its importance can be expected to be minor in mobile bed configurations due to the reduced flow depth over the point bar (CitationHaray and Lane, 2011; CitationKleinhans et al., 2013).
Laboratory experiments were carried out by considering a different configuration with two opposing bends. The results indicated that the interaction between the flow, the sediment transport and the mobile bed topography lead to considerable modifications in the process of flow separation which reaches the high stage of separation (CitationBlanckaert, 2010, Citation2011). More laboratory experiments in an open channel bend had analyzed and provided insight into the physics of flow separation occurring in a variety of channel configurations. Velocity profiles in the separation zone were strongly deformed with maximum values near the bed and low velocities near the water surface which leads to considerably the increase of bed friction coefficients below the zone of flow separation (CitationBlanckaert et al., 2013). One of the most effective methods to diminish separation zones is by arranging vanes in the vicinity of station channel entrance but may considered in some flow conditions a barrier to the flow (CitationSassaman et al., 2009; CitationShabayek, 2010).
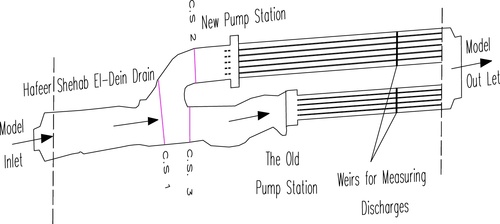
Flow separation has been observed and measured in natural rivers, but with a spatial resolution and accuracy that are insufficient for a detailed analysis of the fluid dynamics and a reliable validation of the numerical models. In spite of its importance, little is known about the fluid mechanics of flow separation induced by changes in the direction of the channel boundaries, and especially the role of turbulence in this process. The knowledge gaps may largely be attributed to the paucity of detailed experimental data, including the velocity components and turbulence characteristics (CitationBlanckaert, 2015). For that, the present study focused on using physical model techniques to solve with high accuracy the problems which arise in the flow pattern upstream of lateral pump stations as a result of the formation of separation zones. The study is related to pump station called New Hafeer Pump Station (NHPS) and was carried out using physical fixed bed model with undistorted scale of 1:20 in the Hydraulics Research Institute (HRI), Egypt. NHPS was constructed on Hafeer Shehab El-Dein Drain (HSD) which is located in Balteem City, Kafr El-Sheikh Governorate, Egypt. Photo 1 in Supplementary material shows the location of the two stations on HSD. NHPS lies near the old station [Old Hafeer Pump Station (OHPS)] at the left side to collect the drainage water of 90,000 Feddan and convey it to El-Gharbia Main Drain. OHPS consists of 5 units (i.e. one of them is spare). The design discharge for each unit is 5 m3/s while NHPS consists of 6 units (i.e. one of them is spare) with the design discharge of 8 m3/s for each unit. Photo 1 in Supplementary material presents the location of the two stations. NHPS suffers from the formation of separation zone in the upstream side which led to the irregularity of flow and thus the inability of station units to withdraw equal amounts of water. In addition, the channel that connects NHPS with HSD has bad configuration as it has short length, narrow width and sharp inclination with HSD. HRI has carried out before study on NHPS in 2013 using the above-mentioned physical model to investigate the flow distribution in the upstream side (CitationHRI report, 2013). The report recommended the dredging of HSD and NHPS channel bed and the rehabilitation of their banks to regulate the flow upstream of NHPS. These works were carried out in the prototype in 2016. The idea of this research is to replace the dredging works mentioned above by a new approach to ensure permanent situation upstream of NHPS free from separation zones and in general this approach can be applied to other pump stations have the similar situation.
2 Study procedure
The study procedure comprised field measurements carried out by HRI survey staff in 2013 using high technology instruments such as Differential Global Positing System, DGPS, Total Station, Echo Sounder, and Range Finder. The measurements covered a total distance of 360 m on HSD upstream of NHPS and OHPS and involved every needed detail to construct and calibrate physical model in HRI (flow velocities, water surface slope, etc.). The model was calibrated using the above mentioned data. After making sure that the model is simulating the prototype geometrically, kinematically and dynamically, several complementary modifications comprise a new approach were proposed and simulated to study the flow distribution upstream of NHPS.
3 Experimental work
A well designed 3-D hydraulic detail physical model for pump stations is considered the best tool to check the flow patterns in the upstream side especially in case of water turbulence and reverse flow due to the existence of separation zones. In case of the absence of reliable guidelines or design criteria of entrances to pump stations, the best method is to carry out a laboratory experimental work in a scaled model and observe the flow to detect the problem source and then suggest necessary modifications to adjust the flow upstream of the station (CitationTsou et al., 1994).
3.1 Physical model description
In accordance to the field measurements carried out by HRI survey staff on 2013, a well-designed model was utilized to simulate HSD & NHPS and OHPS. The modeled area was selected to guarantee high discharges and to secure adequate length of the drain upstream and downstream of the two pump stations. 360 m upstream of the stations was modeled. In addition, an appropriate reach in the downstream was modeled in order to ensure the flow measurements of each station unit.
In such a model with free surface flow, the inertial and gravitational forces determine the hydraulic phenomena to be investigated. Therefore, the model is based on the Froude Similarity law. For best possible simulation of hydraulic phenomena with the smallest possible scale effects, the geometrical scale of the model was selected as (1:20) which is determined by the available space in HRI’s experimental hall. The Froude number (F) which represents the ratio of inertial forces to gravitational forces is given by:
(1)
(1)
where:
F = Froude number
V = Average flow velocity (m/s)
d = Characteristic length (flow depth) m
g = Gravitational acceleration = 9.81 m/s2
Froude similarity requires that the Froude numbers in both model and prototype (nature) are equal. From this condition, the following scales are derived when selecting the geometrical scale:
Geometrical scale nl = 20
Velocity scale nv = (nl)0.5 = 4.47
Time scale nt = (nl)0.5 = 4.47
Discharge scale nq = (nl)2.5 = 1788.85
Because the model flow rate is determined on the basis of equal model and prototype Froude numbers, the Reynolds number could not have the same values as they have in the prototype and flow phenomena resulting mainly from inertial forces and friction forces of the fluid are not correctly modelled. However, a condition for flow modelling was a fully turbulent flow as in the prototype. This is proven for drain cross sections by the Reynolds number (Re = V d/ν) which is greater than 2000 (CitationKobus, 1980), where:
Re = Reynolds number
V = Average velocity (m/s)
d = average water depth (m)
ν = kinematic viscosity (m2/s)
shows a summary of the Reynolds number results in the model which proves that the flow in the model is fully turbulent where all the values of the Reynolds number are greater than 2000.
Table 1 Reynolds number values in the model.
presents the layout of the constructed model. It consists of three main components (i.e. Inlet, reach and outlet) as follows:
| • | Model inlet | ||||
It was constructed with 0.18 m thick bricks and its wall was covered with 0.02 m cement mortar mixed with chemical isolated material to prevent seepage. The model inlet is 6 m wide and 3 m long. It consists of 3 (i.e. 1 m each) successive divisions. The first upstream division is with 2 m high closed walls to conduct the water from the underground reservoir to the model. The second division is 1 m high and is constructed to convey the water, from the upstream compartment to the simulated model reach, through unfilled wall. The third downstream division is opened to guide the flow discharge to the modelled reach via an access ramp. It is provided with a wooden frame to distribute the flow throughout the entire model cross sections, in such a way, to simulate the prototype in its real-world.
| • | Modeled reach | ||||
It is the main element that simulates 360 m of HSD, which is the upstream of both OHPS and NHPS. It was molded according to the prototype in terms of levels and locations. It was constructed of 7 cm thick plain concrete layer. The prototype measured cross sections were scaled down and similarly allocated in terms of orientation, location and levels. The separation between successive cross sections was filled and shaped with plain mortar. The widths and heights of OHPS and NHPS were manufactured in the “HRI” workshop and inserted in the HSD model. Four point gauges, with an accuracy of ±0.1 mm, were installed in order to monitor water surface levels along the model. Each was fixed to a vertical 10 in. diameter side well which was connected to HSD bed via 10 mm diameter plastic tube.
| • | Model outlet | ||||
The principal function of the model outlet is to maintain water surface level through the modeled reach and pump stations to replicate prototype hydraulic conditions. Vertical gates were installed downstream each pump station to lead the discharge to the outlet sharp crested weirs (i.e. 30 cm high and 20 cm wide).
3.2 Discharge measurements
The model was constructed over a large underground reservoir to feed and drain the system (recirculated feeding system). Its capacity was sufficient to feed the model with flows higher than maximum required discharge. An electric centrifugal pump of 10 in. diameter pipeline with capacity of 150 l/s was utilized. An Electro-Magnetic Flow meter was placed over the pipeline to measure the flow rate with ±1% accuracy.
The requested flow is pumped from the underground reservoir via the pump to reach the model entrance and the flow from both stations was redirected to underground reservoir. Two flow measuring techniques were applied. The first technique is used on delivery pipeline, which conveys water from underground feeding reservoir to the upstream model inlet. The second technique is used to measure outlet flow rate over 11 sharp crested weirs installed downstream units of both stations. The outlet flow was determined by using the variation in the flow water levels over the sharp crested weir, which corresponds to out flow rates for each pump station unit in the model.
Velocities in the model were measured within accuracy limits of ±1% using Electro-Magnetic current meters type E.M.S. manufactured by Delft Hydraulics, Netherlands. Signals were integrated by mean value meter to average the velocity signals for selected time intervals.
3.3 Model calibration
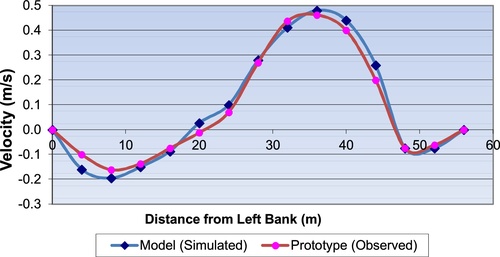
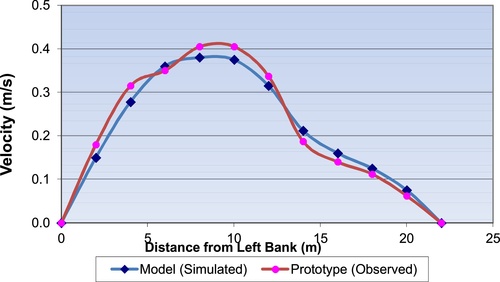
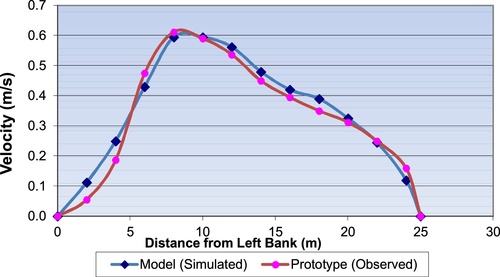
In order to ensure that the model complies with the prototype geometrically, kinematically and dynamically, the model was calibrated in terms of velocity distribution and water surface slope. The water velocities were measured in the prototype at three cross sections, (). At each point of the cross sections, the velocity was measured in the vertical direction at 0.2, 0.5 and 0.8 D (water depth) and the mean velocity at each point was taken as the average of these three measurements. In case of water depth is not enough to measure three points in the vertical direction, the velocity measurements are taken at 0.5 D only because the current meter should have enough distance free whether from the water surface or from the bed. Velocities measurements were taken in the prototype at the period that represent most of the discharges exist during the year (dominant discharges). As long as the prototype and model velocities will have a good correlation, then the model can represent all discharges whether minimum, dominant or maximum.
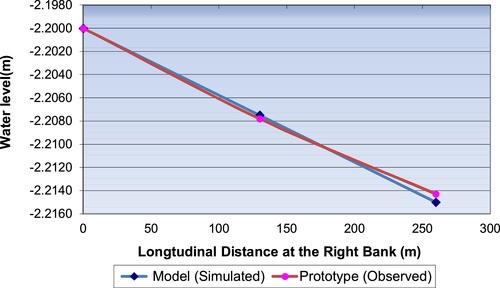
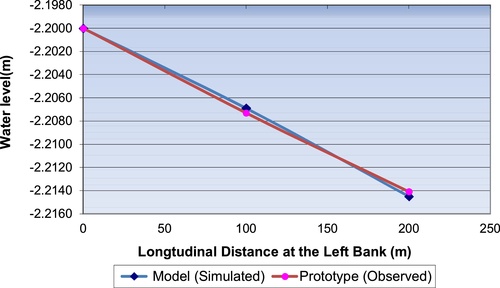
The HSD bed and banks were simulated in the model with very smooth surface to verify the velocities and water level slope in the model as in the prototype. The water velocities were measured in the model at the same locations where the measurements were taken in the prototype. The results were compared with their equivalents velocities measured in the prototype. – present the comparison between prototype (observed) and model (simulated) flow velocities at these cross sections. The water surface slope along HSD was measured in three points at each bank. and show a comparison between observed and simulated water levels. It is clear from the figures that there is a good agreement between the observed and simulated water levels as the difference in values did not exceed 0.5%.
Statistical analysis is always used to check the matching between any observed and simulated parameters. To further inspect the goodness of fit, F-test was implemented. The F-test is used to determine whether two samples have different variances or not. If we are running an F Test, we should use Excel, Minitab or some other kind of technology to run the test because the calculation of F test by hand including variances is tedious and time-consuming and will probably make some errors along the way. In this test, Pvalue is used to support or reject the null hypothesis. It is the area in the right tail of a probability distribution. When we run the hypothesis test, the test will give us a value for P. Compare that value to the chosen alpha level, (are related to confidence levels and is always equal to 0.05). If Pvalue is larger than alpha level and the returned Fvalue is less than Fcritical for certain accuracy, then the hypothesis of similar variances is valid. demonstrates the Pvalue & Fcritical and the corresponding Fvalue for the calibration stage. It is clear from the table that the returned Fvalue is less than Fcritical and Pvalue is larger than alpha level in all velocity sections, i.e. there is a good correlation between the observed and simulated velocities. The coefficient of determination (F2) was also used for the comparison of the simulations with observations. F2 is based upon the sum of squares of the differences between observed and simulated values as indicated in Eq. (Equation2(2)
(2) ) (CitationDiskin and Simon, 1977). indicates the values of F2 for the three velocity cross sections which were found close to number one (F2 ≈ 1) (CitationMinns, 1995). From the results of F-test and F2, it is clear that the model can be put into operation for trustful predictions and the model could be further implemented to simulate the problem in hand.
(2)
(2)
Table 2 Fcritical and corresponding Fvalue for model calibration.
Table 3 Coefficient of determination for observed and simulated velocities.
Ao: observed values, A s: simulated values
A−o: mean of observed values, m: number of values
3.4 Proposed modifications and simulations
In order to minimize the separation zone and enhance flow distribution over the entire width of HSD upstream of NHPS, four complementary modifications were proposed and simulated under the drain critical condition. This condition is associated with the maximum discharge that can pass in HSD and was determined by Department of Mechanics and Electricity (Ministry of Water Resources and Irrigation as 50 m3/s). The design discharge is 8 m3/s for one unit of NHPS and 5 m3/s for one unit of OHPS. So, to pass the maximum discharge of 50 m3/s, NHPS will operate with its full capacity (five units in operation) and OHPS will operate with only 2 units. Some sensitive tests were carried out by monitoring dye tracer to detect which two units of OHPS have more effect on the flow distribution upstream of NHPS. It was found that the effect of operating any two units was inside the channel of OHPS and far from the region which distributes the flow on both stations and consequently has no effect on the flow pattern upstream of NHPS.
For comparison purposes, the velocity and discharge measurements were carried out in the model before doing any modifications to HSD configurations, (existing situation), to be used as a reference in order to evaluate the achieved enhancement. The modifications comprised dredging of HSD and NHPS channel bed, rehabilitation of the left bank of NHPS channel, installing Spur Dykes at HSD right bank and creating Humps in HSD bed. Each modification was constructed and tested. The velocity distributions were measured at three cross sections upstream of NHPS and the discharges passed from OHPS and NHPS units were also measured.
3.4.1 Modeling results of existing situation
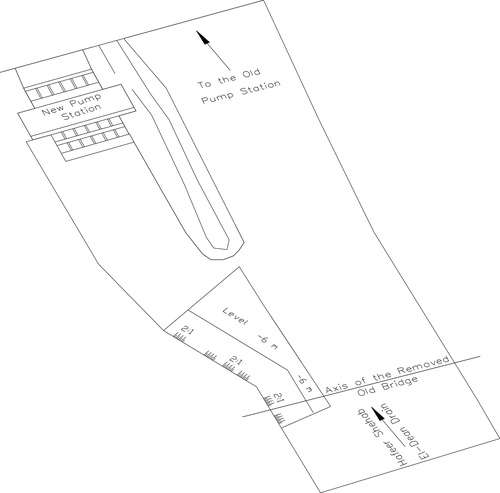
shows the model arrangements in the existing situation. The velocity and discharges measurements indicated that the flow direction is concentrated more towards the right bank of HSD at which OHPS is located and the flow distribution upstream of NHPS is irregular. The velocity values near the right bank of NHPS channel were found lower than near the left bank which means the flow tends to move more towards OHPS. In addition, a dye tracer was utilized to detect the separation zone. This inspection indicated that a large separation zone was formed upstream of NHPS near its channel left bank as a result of rising levels of the HSD bed. This rising is due to the presence of sedimentation and some remains belong to a removed old bridge which led the flow to direct more towards OHPS.
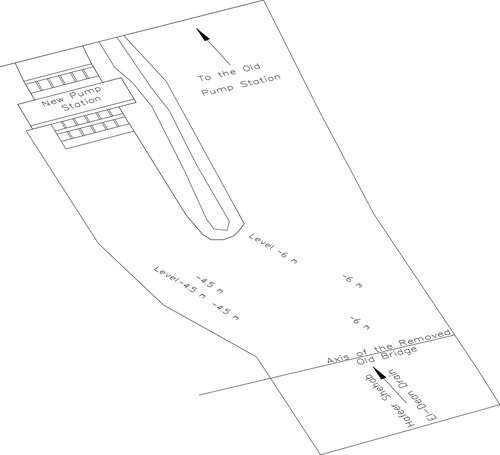
Photo 2 in Supplementary material presents the non-uniformity of flow distribution and the existence of separation zone up stream of NHPS. The discharges from NHPS units were unequal. The first unit near the right bank of NHPS channel passed discharge of 4.4 m3/s while the other one near its left bank passed discharge of 8.6 m3/s. The sum of all discharges passed from all NHPS units was 36.6 m3/s. This means that NHPS units are not capable to pass its design discharge, (40 m3/s for the five units). On the other hand, the two units of OHPS in operation passed discharge of 13.4 m3/s; while they should only passed 10 m3/s (i.e. design discharge for each unit is 5 m3/s). The existing situation showed that NHPS is not capable of passing its design discharge and has flow irregularity in the upstream side, which caused the units to pass uneven discharges.
3.4.2 Modeling results of first modification
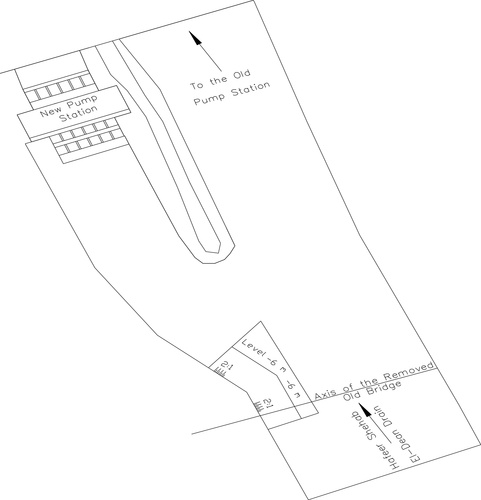
Inspired by the modeling results of the existing situation, the first proposed modification, , encompassed the dredging the sedimentation and remains of the removed bridge that raised HSD bed levels upstream of NHPS. In order to expand the width of NHPS channel, the side slope of its left bank was rehabilitated to be 2:1 instead of 3:1 for a distance of 50 m (i.e. 25 m upstream of the axis of removed bridge and at 25 m downstream side). The bed levels were adjusted along this distance to be −5.5 m instead of −4.5 m as this level is considered the prevailing level of HSD bed upstream of NHPS and near left bank of NHPS channel.
The first modification was modeled and measurements were undertaken and analyzed. The modelling results indicated that an improvement in the flow distribution towards the left bank of NHPS channel. The flow was distributed along the whole width of NHPS channel which reduced the area of the separation zone in its upstream side. Flow velocity at right bank of NHPS channel was found higher than in the left side and the discharge differences were evident from NHPS units. A little improvement was observed (i.e. first and last unit discharged 5.6 and 8.2 m3/s, respectively, instead of 4.4 and 8.6 m3/s in the existing situation) but NHPS is still incapable to passing equal discharges through its units. Photo 3 in Supplementary material presents the slight improvement of implementing the first alternative.
3.4.3 Modeling results of second modification
Motivated by the modeling results of the first modification, the second proposed modification, , encompassed completing the rehabilitation of side slope of the left bank of NHPS channel for another 50 m downstream of the axis of the removed bridge so that the total rehabilitated side slope distance after the first and second modification is 25 m upstream of the bridge axis and 75 m downstream of it. HSD bed levels were adjusted along this distance to be − 6.0 m instead of −5.5 m. Also, the toe of the embankment, between NHPS and OHPS was shifted by 2 m towards OHPS to expand the width of NHPS channel to receive more discharge.
The second modification was modeled and measurements were undertaken and analyzed. The modeling results indicated that more improvement in flow distribution towards the left bank of NHPS channel was evident. Flow separation zone was reduced but flow velocities at right bank of NHPS channel are still higher than at the left side. The discharge differences were evident as the discharges passed from the first and last units were found equal 6.2 and 8.1 m3/s, respectively instead of 5.6 and 8.2 m3/s. An improvement in the flow distribution upstream of NHPS is evident but NHPS is still incapable of passing its design discharges and distribute them equally. Photo 4 in Supplementary material presents the improvement of flow distribution and reduction of separation zone up stream of NHPS.
3.4.4 Modeling results of third modification
The modeling results of the first and second modifications indicated that a lot of modifications should be done to reach the optimal situation of flow conditions upstream of NHPS. The configurations of HSD and NHPS channel represent significant obstacles for improving the flow pattern upstream of NHPS. The inclined angle of the channel with the drain prevents the flow to be directed smoothly towards NHPS. In addition, the shortness of the channel length and the narrowing of its width as well as the bad configurations of HSD bed and banks increased the flow disturbance. It will cost a lot in the prototype to regulate the flow upstream of NHPS by adjusting all HSD and NHPS channel configurations. Therefore, it was thought to continue the modifications by finding a new situation to replace these high-cost modifications.
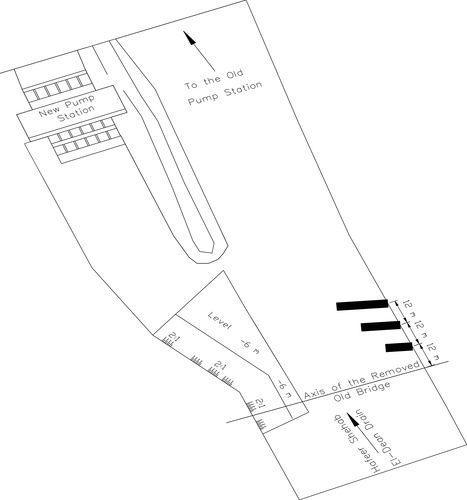
A new approach was investigated to reduce the separation zone activity without any adverse impacts on NHPS operation and to regulate and direct the flow towards NHPS. The approach is a combination of series of small Spur Dykes and humps installed at HSD right bank and bed. In this modification, it was decided to test first the installation of series of Spur Dykes without humps. The tested Spur Dykes included variations in its geometrical and direction features. The final locations and dimensions of the installed Spur Dykes which verify the best situation of directing the flow towards NHPS were determined after some successive tests carried out in the model. This was done by monitoring the dye tracer and taking photos using high definition digital camera to trace the formation of the separation zone and spots of its activity. Also, visual aids such as neutral-density particles were used to observe and monitor the flow patterns in the vicinity of NHPS channel. The modeling results indicated that the best arrangement of the Spur Dykes is installing three of them with horizontal angle of 75° with HSD right bank. The lengths of the three Dykes are 2, 7 and 12 m measured from contour line of level −2 m on HSD right bank and at a distance of 12, 24 and 36 m from the axis of the removed bridge respectively. shows the model arrangements after the third modification. Enhancement was achieved in the flow distribution towards NHPS as the flow separation zone was nearly diminished. Some high velocities at right bank of NHPS channel than in the left side. The discharge improvement was evident as the passed from first unit increased to 6.8 m3/s instead of 6.2 m3/s, while other unit at left bank passed 8.0 m3/s. The total discharges became 38 m3/s instead of 36.15 m3/s. There is a remarkable improvement in the flow distribution upstream of NHPS but still some flow adjustments are required to pass discharges equally. Photo 5 in Supplementary material presents the improvement of flow distribution and reduction of the separation zone dimensions near the left bank of NHPS channel.
3.4.5 Modeling results of fourth modification
Encouraged by the modeling results of the first, second and third modifications it was decided to continue the process of improving the flow distribution upstream of NHPS by creating humps in HSD bed downstream of the installed Spur Dykes and at a location near the right bank of NHPS channel. It was found that, it is not economic and applicable to increase the number of Spur Dykes more than installed in the third modification. More Spur Dykes will decrease the width of HSD upstream of OHPS which may cause flow disturbance and affect its capability of drawing its design discharges. The final locations and dimensions of the Humps were determined after some successive tests carried out in the model by monitoring the dye tracer and taking photos using high definition digital camera as carried out in the third modification. The dye tracer and digital photos results proved that the best situation to create Humps was by adjusting HSD bed to the level of −5. 5 m for a lateral strip of 30 cm width followed by another one of 50 cm width of −5.25 m level as showed in . The modeling results indicated that the velocity measurements experienced uniformity upstream of NHPS and the separation zone up stream of NHPS channel was completely diminished. Photo 6 in Supplementary material presents the improvement of flow distribution and the disappearance of the separation zone upstream of NHPS. Flow velocities were nearly equal beside the two NHPS channel banks. The flow from the first unit near the right bank of NHPS channel increased to 7.45 m3/s while the unit near the left bank passed the design discharge which is 8.0 m3/s. The sum of all passed discharges was equal to 39.1 m3/s. summarizes the works which happened in the four complementary modifications. – present the gradual improvement of the velocity distribution up stream of NHPS due to the complementary modifications carried out in the physical model. presents the gradual improvement of the flow discharge passed from NHPS units.
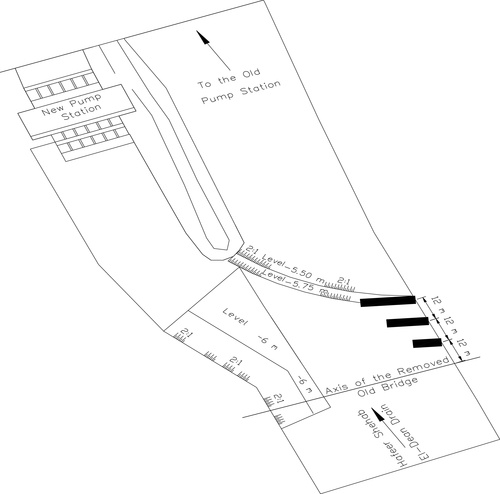
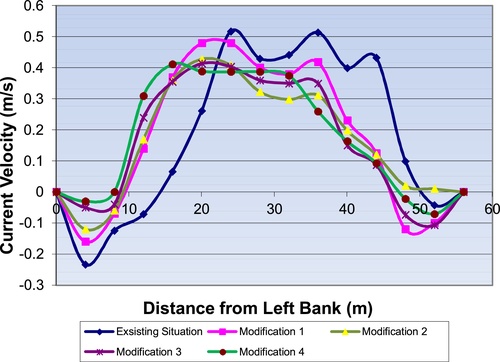
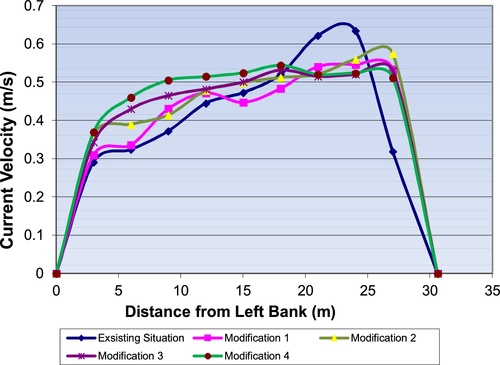
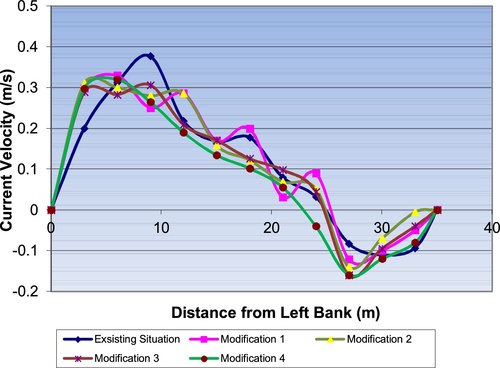
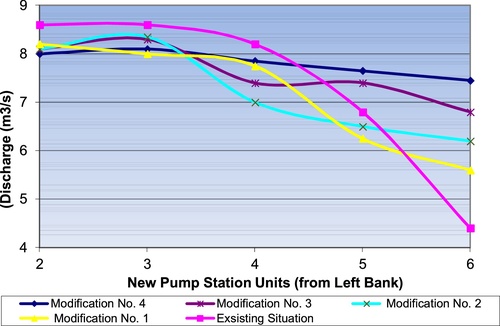
Table 4 Summary of the four complementary modifications.
4 Conclusions and recommendations
Based on the results of the present investigation it was concluded that the flow velocities in the existing situation upstream of NHPS and near its channel left bank had negative values that ranged between zero and −0.25 m/s. This proves the existence of reverse flow and formation of separation zone upstream of NHPS. So, it was decided to investigate a new approach to reduce the separation zone activity and regulate the flow upstream of NHPS. The approach is a combination of installing series of small Spur Dykes at HSD right bank and creating some humps in the bed. Four complementary modifications were carried out to reach the optimal situation of flow distribution upstream of NHPS which allows for passing equal discharges through its units. A gradual improvement in the velocity distribution upstream of NHPS occurred due to the complementary modifications carried out in the physical model. With the dredging of HSD bed to level −6 m and rehabilitation of left bank of NHPS channel to be 2:1 instead of 3:1 and also installing the Spur Dykes and Humps, the negative values were reduced and diminished completely. The flow became well distributed at the left bank of NHPS channel. Also a gradual improvement of the discharge passed from the pump units that experienced the incapability of conveying the designed discharges. The passed discharge from the first unit of NHPS near its channel right bank, which had the lowest value before carrying out the complementary modifications, improved and reached to 7.45 m3/s after applying all modifications.
Based on the study results, it is recommended to apply the investigated approach on New Hafeer Pump Station as it is considered permanent solution for adjusting the flow pattern and preventing the formation of separation zone in its upstream side. In general this approach can be applied to other pump stations in Egypt which have similar situations. More intensive laboratory experiments are recommended to investigate the effectiveness of Hump and Spur Dykes in other lateral channels configurations (channel inclination, length and width) to provide more about the physics of flow separation occurring upstream of pump stations in a variety of channel configurations. The height of humps can be increased up to the level of critical flow and investigation can be taken up to find the flow characteristics under conditions close to choking up conditions.
Supplementary Photo 1
Download MS Word (89 KB)Supplementary Photo 2
Download MS Word (137 KB)Supplementary Photo 3
Download MS Word (142.3 KB)Supplementary Photo 4
Download MS Word (140.4 KB)Supplementary Photo 5
Download MS Word (534.6 KB)Supplementary Photo 6
Download MS Word (526.1 KB)Acknowledgement
Special thanks and appreciation is due to Prof. Khaled Ramadan the director of HRI for his support and advice during the research period. Appreciation is due to HRI colleagues for providing the hydrographic and bathymetric survey data. Special thanks are due to Dr. Mohamed Abdullatif for his help throughout the model operations.
Notes
Peer review under responsibility of National Water Research Center.
References
- K.BlanckaertTopographic steering, flow recirculation, velocity redistribution and bed topography in sharp meander bendsWater Resour. Res.462010 W09506
- K.BlanckaertHydrodynamic processes in sharply-curved river bends and their morphological implicationsJ. Geophys. Res.1162011 F01003
- K.BlanckaertM.G.KleinhansS.J.MclellandW.S.UijttewaalFlow separation at the inner (convex) and outer (concave) banks of constant-width and widening open-channel bendsEarth Surf. Process. Landf.382013696716
- K.BlanckaertFlow separation at convex banks in open channelsCamb. Univ. J. Fluid Mech.7792015432467
- L.M.BurgeD.G.SmithConfined meandering river eddy accretions: sedimentology, channel geometry and depositional processesN.D.SmithJ.RogersFluvial Sedimentology VIvol. 282009Blackwell Science113130 Special Publication of Internat., Association of Sedimentologists
- M.H.DiskinE.SimonA procedure for the selection of objective functions for hydrologie simulation modelsJ. Hydrol.341977129149
- R.I.FergusonD.R.ParsonsS.N.LaneR.J.HardyFlow in meander bends with recirculation at the inner bankWater Resour. Res.3911200313221333
- R.J.HarayS.N.LaneFlow structures at an idealized bifurcation: a numerical experimentEarth Surf. Process. Landf.3615201120832096
- HRIHafeer Pump Station Physical Model Study. Technical Report No. 1882013National Water Research Center, Ministry of Water Resources and IrrigationEgypt
- M.G.KleinhansR.I.FergusonS.N.LaneR.J.HardySplitting rivers at theirs seams: bifurcations and avulsionEarth Surf. Process. Landf.3820134761
- M.G.KleinhansF.SchuurmanW.BakxH.MarkiesMeandering channel dynamics in highly cohesive sediment on an intertidal mud flat in the Westerschelde Estuary, the NetherlandsGeomorphology1052009261276
- H.KobusHydraulic Modeling1980German Association for Water Resources and Land Improvement, Bulletin 7Germany
- B.KoenG.MaartenJ.StuartFlow separation at the inner (convex) and outer (concave) banks of constant width and widening open channel bendsEarth Surf. Process. Landf.382013696716
- A.W.MinnsAnalysis of experimental data using artificial neural networksHydra 2000 (Proc. XXVI Congress IAHR)vol. 11995Thomas Telford Services Ltd.London, UK218223
- T.C.SassamanA.E.JohanssonM.PadmanabhanAvoiding common pitfalls in cooling tower pump intake design related to hydraulic performanceProc. American Society of Mechanical Engineers Power Conf.2009199204
- S.A.ShabayekImproving approach flow hydraulics at pump intakesInt. J.Civil. Environ. Eng. IJCEE-IJENS10620102331
- J.L.TsouB.W.MelvilleR.EttemaT.NakatoReview of Flow Problems at Water Intake Pump Sumps1994American Society of Mechanical EngineersNew York, NY (United States)
- W.Van BalenK.BlanckaertW.S.J.UijttewaalAnalysis of the role of turbulence in curved open-channel flow at different water depths by means of experiments, LES and RANSJ. Turbul.112010 N12
Appendix A
Supplementary data
Supplementary data associated with this article can be found, in the online version, at https://doi.org/10.1016/j.wsj.2018.02.002.