Abstract
In this paper we reflect on the last 10 years of the Journal of the Operational Research Society (JORS). We use metadata and citation analysis to profile OR research and practice published in this prestigious journal. The analysis of the published material includes examining variables such as the most productive authors, the papers having the highest number of citations, the universities and organisations associated with the most publications and their geographic diversity, OR techniques and their application areas, the number of authors per paper, the background of the authors, etc. Moreover, this work includes variables from a previously published study of JORS that profiled research from 1981 to 1999. Therefore, the analysis allows a comparison to be conducted between some of the findings of the two studies. This research has implications for researchers, journal editors and research institutions.
Introduction
The Journal of the Operational Research Society (JORS) is a high-ranking research journal focusing on the frontiers of Operational Research (OR). It has a 3* ranking in the Association of Business Schools’ guide to academic journal quality for subjects associated with business and management (CitationAssociation of Business Schools, 2009). During the 60 years of its existence, JORS has established itself as a quality outlet for publishing reports of innovation in OR research and practice. Over these years it has continually developed its international reach and has evolved both in terms of quality and quantity of output.
With reference to journal publications, profiling is considered to be an art of introspection (CitationPalvia et al, 2007) that aims to benefit a specific audience and is intended to take a journal towards a balanced direction. For the benefit of the audience of JORS, this paper provides an overview of research and practice published in the journal over the last 10 years. JORS claims to have a particular flavour, of extending theory by the use of real-world analysis (CitationWilliams and Wilson (2002), the first editorial of the current editors, briefly describes this flavour), this giving the paper a distinctive difference from, say, theoretical journals such as Management Science or journal describing case-studies such as Interfaces; this paper will look at whether the journal lives up to this flavour. There are numerous literature review papers capturing the evolution of a particular OR technique (CitationGraves, 1981; CitationSilver, 1981; CitationErnst et al, 2004; CitationFraminan et al, 2004; CitationFildes et al, 2006; CitationHollocks, 2006) and others which focus on the use of one or several OR techniques in a specific sector (CitationFleischmann et al, 1997; CitationJun et al, 1999; CitationFon et al, 2003; CitationJackson, 2006; CitationHaksöz and Seshadri, 2007; CitationTurner, 2008). In this paper, we aim to contribute to the identification of the various topics (techniques and sectors) that are considered important for research and publications, thus providing a valuable addition towards understanding and developing the area of Operational Research and Management Science. Furthermore, our study is likely to stimulate researchers to profile other OR journals in order to conduct comparative/cross-journal studies that will ultimately help towards the understanding of the overall evolution of the OR discipline. Similar research has also been undertaken in other fields and particularly in Information Systems and Electronic Commerce with great success (CitationClaver et al, 2000; CitationAvison et al, 2008; CitationDwivedi and Kuljis, 2008; CitationDwivedi et al, 2008; CitationDwivedi et al, 2009).
In this profiling paper, we find it useful to look back and reflect on the previous volumes of JORS. On its 50th anniversary, the JORS editorial written by CitationRanyard (2001) presented some metrics pertaining to the most cited articles and the most cited authors in the history of the journal. Now, with 60 years’ experience and a rapid growth of research in the field (CitationSimchi-Levi, 2008), we feel that it is appropriate to analyse and reflect on the development of the journal and the changes and trends that have occurred over the decade. Reviewing and profiling existing JORS publications can help to identify currently under-explored research issues, and select theories and methods appropriate to their investigation, all of which are recognised as important issues for conducting fruitful, original and rigorous research (CitationGalliers et al, 2007; CitationPalvia et al, 2007).
This paper aims at profiling OR research and practice published in JORS in the last 10 years (2000–2009). This aim is realised through the following objectives:
To categorise JORS papers according to type (theoretical papers, papers focussing on OR practice, review papers, etc.) and to identify those categories with increasing inputs.
To determine the number of revisions before a paper is accepted for publication to the journal.
To determine the number of contributing authors.
To determine the geographic location of the contributing authors.
To identify authors’ background, that is academic or practitioner.
To identify the university departments associated with the majority of OR publications.
To identify the universities that are most productive in publishing OR research.
To identify the practitioner organisations associated with the most OR publications.
To identify the most productive authors.
To determine the research impact of the most cited papers.
To identify the OR techniques that are popular among the JORS authors.
To identify areas/sectors where the application of OR is widespread.
Methodology for journal profiling
Profiling OR research and practice published in JORS required the authors to do an exhaustive review of papers published in this journal from 2000 to 2009 (both years inclusive). JORS publishes 12 issues every year and each issue usually incorporates between 10 and 15 articles. Thus, the authors carefully reviewed a total of 1459 research articles and captured data on variables relating to the authors and their affiliations, authors’ background (academic or practitioner), number of revisions required, OR techniques used, application domains, metrics on paper citations from Google Scholar and ISI Web of Science, etc. Extracting detailed information of the variables not only required reviewing the abstract and keywords of every paper, but in some cases it was necessary to examine the full text (for example, to capture data related to the OR techniques used, its area of application and the number of revisions required). Collation of data pertaining to these variables enabled the analysis of additional parameters such as the productivity of authors, institutional contributions, citations of selected articles and geographic regions.
The analysis conducted in this study excluded editorials, book reviews and selections, viewpoints, corrigenda, forewords, obituaries and republished anniversary papers. Other similar profiling papers, for example, CitationGallivan and Benbunan-Fich (2007), followed the same approach pertaining to the exclusion of paper types from their analysis. The 1459 articles analysed by the authors were thus classified under the following seven categories: (a) general papers, (b) case-oriented papers, (c) theoretical papers, (d) technical notes, (e) practice notes, (f) review papers and (g) special issue papers. The special issue papers were further classified under (a)–(f). These categories are consistent with the headings under which the papers are published on the JORS Advanced Online Publication System.
The rest of this section discusses information specific to certain variables or types of analysis.
Authors’ affiliation (variable)
Data pertaining to the authors’ university department was not always available in the articles. This piece of information is not necessarily recorded and therefore there were many missing variables in our dataset. Moreover, for capturing the data on university departments in a readable way, we clustered departments with similar subjects and backgrounds in an attempt to minimise the number of different department names from above 100 to just 10. Therefore, caution should be exercised in interpreting statistics related to this variable.
Variables pertaining to the geographic location of the authors’ affiliations were recorded. Results are presented by popular countries.
OR technique and OR application area (variable)
To facilitate a ‘structured’ recording of data pertaining to OR techniques, we first compiled a keyword list comprising of 145 OR techniques. This list encompasses the OR techniques that appear in the keyword lists of the following three journals—JORS, Operations Research and Management Science. Since a significant number of the JORS papers report on the use of more than one OR technique, our coding allowed assigning up to four techniques per article. An identical classification approach was followed for recording data pertaining to the OR application area (sectors). In this case our list, again an assimilation of keywords pertaining to OR application areas identified in the keyword list associated with the three aforementioned journals, consisted of a total of 122 sectors and each JORS paper could be assigned to up to four sectors.
Contributions/productivity of educational institutions and practitioner organisations (analysis)
Institutional contributions/productivity were examined in three ways: (a) number of articles per institution (wherein only one count was allocated per article regardless of the number of co-authors from the same institution); (b) number of authors from an institution (wherein one count was allocated for each author from an institution); and (c) a total contributions approach (wherein one count was allocated to any one author from the same institution per article). The same approach was followed in order to classify practitioner organisations.
Authors’ productivity (analysis)
In order to record authors’ productivity, we assumed that each publication, counted as one for all authors, regardless of the number of co-authors. The impact of research by the most productive authors was assessed by calculating the total and average citation counts. The citation-specific data used in these calculations were extracted from two sources—Google Scholar and ISI Web of Science.
The findings of this study are presented in the subsequent section. However, before this section comes to a close, the authors would like to sound a note of caution to the readers with regards to interpreting the data presented in the ‘Findings’ section. It is important to emphasise that the findings of this study, in terms of most productive authors and universities with the most contributors, should be regarded as indicative only of JORS activity. This is because such profiling analysis may exclude important researchers because they might not have published in JORS within the duration of this analysis or many authors may simply have the expertise and the skills to publish in other preferred outlets (rather than JORS).
Findings
The analysis of JORS papers from 2000 to 2009 concluded in a series of findings. These findings cover frequencies and trends pertinent to the type of articles published in JORS, statistics with regards to the average number of revisions required before final acceptance of articles for publication, analysis related to the number of authors who have published in JORS and statistics on the number of authors per paper. Results are presented relating to the countries of the authors’ affiliations and a comparison is made between authors from academia and practitioners. We list university departments (by subject type), research universities and organisations who are active in the field of OR; we identify the most popular OR techniques and their application areas. Additionally, the most productive authors and most cited JORS papers are noted, the latter with reference to both Google Scholar and ISI Web of Science citations. These findings are presented under separate headings below. Every heading maps to one of the 12 objectives outlined in the introduction. Thus, the findings presented under each heading realise a stated objective of this paper.
(1) Analysis by article type
We start our analysis by looking at the types of the papers submitted and published over the period 2000–2009 (volumes 51–60). There are seven categories of published papers. In our set of 1459 papers, the highest number are theoretical papers (43.7%) followed by case-oriented papers (26.1%). Special issue papers are third in the list (15.1%), followed by technical notes (9%) and general papers (4.5%), respectively. Review papers and practice notes come last in the list with less than 1% representation in the journal.
The special issue papers appear in journal issues that are dedicated, either entirely or partially, to a particular OR topic or application area. The period of our analysis covered 26 special issues or part-special issues. shows the various topics associated with these special issues. Columns 1, 2 and 4 of this table present the year of publication, the issue number and the number of papers included in the special or part-special issue, respectively. We see that Credit Scoring, Intelligent Management Systems, Problem Structuring Methods, Data Envelopment Analysis and Operational Research in Health are topics that appear more than once in special issues and they consist of a relatively large number of papers. Apart from being dedicated to a specific topic, the special issue (or part-special issue) papers can also be categorised under the aforementioned paper types. Thus, special issue papers that were classified as theoretical papers were first with 51.8% representation, followed by case-oriented papers (34.5%) and then general papers (10%). Review papers (3.6%) were a distant fourth. Finally, there were no papers that could be categorised under practice or technical note.
Table 1 JORS Special Issue topics
JORS special issues can be divided into two types: those specialising in a domain, such as health, education or defence and those specialising in a technique, such as Data Envelopment Analysis (DEA). It is not surprising that in the first category the number of case-oriented papers outweighs the number of theoretical papers, whereas in the second category there are roughly three times as many theoretical papers as compared to case-oriented papers.
shows the number of papers under each category (subsequent to the reclassification of the special issue papers according to paper type). The data suggest that theoretical and case-oriented papers have been the constant majority during the period of analysis. Moreover, there is an ascending trend of theoretical and case-oriented papers. The last column also shows that the total number of published papers has steadily increased over the last 3 years.
Table 2 JORS article types frequency per year
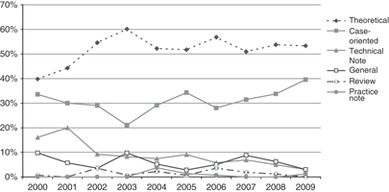
In order to see the data presented in more clearly, we take each paper category and plot them in a line graph, which shows the proportion of paper types over the total number of papers per year. The figure illustrates that over the past 4 years there has been an upsurge in case-oriented papers in contrast to theoretical papers whose representation in the journal seems to stay steady over the same period. On the other hand, technical notes seem to decrease over the decade.
In the early years of the decade, an increasing preponderance of theoretical papers can be seen. On taking over the editorship, the current editors made a decision to ensure that the journal stayed with its historical mission (see the discussion about the history of this aspect and the possible developments of the journal in the long-term future in CitationWilliams et al (2005)) and to slant the journal as much as possible to work that was not only theoretically and academically sound but that also showed real-world, practical advances in OR. Given the lead time in encouraging and publishing papers, starkly shows the evidence of this emphasis, as the declining trend in case-oriented papers gradually reversed, and now approaches almost as many as the theoretical papers.
Figure 1 Proportion of published article types over the decade.
(2) Analysis based on the number of revisions requested
Most papers submitted to JORS are reviewed and re-reviewed by two referees. This is in addition to the review done by one of the editors. Special issues follow a slightly different, albeit equally rigorous, route with the guest editors overseeing the process. Papers usually cycle through the system a few times. Our data pertaining to the number of revisions requested before paper acceptance has shown that the average number of review cycles is 1.5, with a range of 0–4 times.
(3) Analysis based on authorship
Our analysis pertaining to the number of authors revealed that a total of 2407 authors have contributed to JORS over the decade. Of these, 530 (22%) have contributed more than one paper and 1877 have contributed just one paper. Moreover, 1129 of 2407 (47%) authors appear as first authors and the remaining 1278 are contributors/co-authors.
Among the papers published, 20.9% were single authored, 40.5% were by two authors (which form the largest category), 27% by three authors, 8.6% by four authors and almost 3% were by five to eight authors. These percentages seem to be constant throughout the decade. In general, the average number of authors per paper was 2.3.
(4) Analysis based on authors’ geographic location
Our analysis of the authors’ affiliations revealed that contributors came from 65 different countries, with the UK (24.3%) and the US (17.6%) dominating. The third largest category (6.2%) was formed by Taiwanese authors. Spain, Canada and China (including Hong Kong) were next in the list. The number of European countries represented in our dataset was 23 (35%). shows the top 20 countries in terms of (a) the geographical location of the authors’ affiliations (columns 1–3), and (b) the total region-specific contributions of the authors taking into consideration the fact that authors could have contributed to more than one paper (columns 4–6). Finally, shows only papers that were accepted by the journal. With an acceptance rate of only around 25%, there are four times as many contributions proffered to the journal than are shown here.
Table 3 List of the top 20 geographical locations of JORS authors
It is perhaps not surprising that the largest contribution is from the UK. This is because JORS was created and established in the UK with UK editors and is the oldest established journal of the Operational Research Society, a UK-based learned society. However, the large representation of other countries indicates the journal's international audience and reputation.
(5) Analysis based on authors’ background
In this study we consider the authors’ background to be in either academia or industry. Our analysis has shown that the vast majority of the authors were from academia (2107 authors; 87.5% compared to only 11.8% from industry—283 authors). This is true even though many JORS papers are based on case studies and action research (such papers generally highlight the prevalence of OR research in organisations). The predominance of authors from academia is fairly consistent throughout the period of our analysis. Some authors appeared to switch between academia and practice in the period under examination. In these cases, we classified them under the category in which they appear to have most of their contributions. Unfortunately, no data were available for some authors (17 out of a total of 2407 authors).
(6) Analysis based on authors’ home department/school affiliation
Our next finding is with regards to the departments/schools in which the academic authors are located. Unfortunately for this variable we had a lot of missing data. From a total of 2107 academic authors and co-authors we could only gather information for approximately 60% (1266 authors to be precise). Moreover, in order to present readable results we had to cluster the names of the authors’ departments/schools under more general and distinct headings. For example, all Business schools, school or departments of Management, Business Administration and Organisational Studies were clustered under the Business and Management category; all the specific Engineering departments were classified under the Engineering category; the Operational Research category consists of OR, Management Sciences and Decision Sciences departments. In total we formed 10 such categories (these are shown in ). Unavoidably, during the 10 years of JORS publications some authors have changed institutions and departments. In such cases, we considered as indicative the department/school from which the author produced most of the JORS papers. However, it was soon realised that most of these authors had moved into departments/schools which were under the same general category (presented in ) as their former departments/schools. Analysing the department/school-specific affiliation information provided by the academic authors, we found, perhaps unsurprisingly, that the largest number of contributors are from departments that fall under the category of Business and Management (41.4%), followed by Engineering departments (19.1%) and then by dedicated OR departments (11.1%). Other departments including Mathematics (8.8%), Economics (6.0%), Computer and Information Systems (5.7%) and Statistics (2.2%) have a smaller representation. It is also worth highlighting that Health-related departments form a distinct category with 23 contributors. This may imply that OR in Health is well established, which becomes apparent when we examine the OR application areas in a subsequent section of the paper (). One reason for this is that JORS published two special issues on Health care during the period of our analysis (refer to ).
Table 5 List of the top 20 universities that published in JORS (2000–2009)
Table 4 Classification of the authors’ home departments/schools under 10 broad categories
Table 11 Areas/sectors in which OR techniques are frequently applied by JORS authors
(7) Analysis based on authors’ university affiliation
For our next analysis, we consider the university-specific affiliation information provided by the authors. The reader should note that this analysis also includes educational institutions that are not necessarily universities. Our data shows that 780 different universities have been represented in JORS between 2000 and 2009, each university contributing to one or more articles. The breakdown of the number of papers with regards to the contribution of the top 20 universities is illustrated in (columns 1–2). Columns 3–4 show the number of unique contributors/authors affiliated to a particular educational institution. Finally, columns 5–6 show the total number of contributions from all the authors affiliated to specific universities. Data for columns 5–6 is obtained from our database by counting the occurrence of different educational institutions associated with the authors. We call this the total contributions approach. This measure is different from the number of papers that each university has contributed to (columns 1–2), since there are papers with more than one author from the same institution. It is also different from the number of contributors/authors affiliated to a particular university (columns 3–4) because an author may have contributed to more than one paper. The total contributions approach (the data for which is shown in columns 5–6) results in the combined count of all authors being greater than the total number of articles.
From we see that the University of Southampton is ranked first with the largest number of papers (52), authors (52) and total contributions (96). It is followed by the University of Warwick in second place with 47 papers, 24 authors and 56 contributions and the University of Lancaster in third place with 35 papers, 29 authors (in the second place in terms of authors) and 48 contributions. The University of Salford is in the fourth place with 31 papers, 24 authors and 43 contributions. The remaining 16 most productive universities/educational institutions with respect to the number of papers, authors and total contributions are listed in . It is worth mentioning that a vast majority of these universities are based in the UK.
(8) Analysis based on practitioners’ organisation
An analysis similar to the one presented in the previous section was carried out in relation to the organisations/companies to which the practitioners belonged. As illustrates, in all the three categories (ie, the number of papers, authors and total contributions) the first three positions are occupied by Defence Science and Technology Laboratories (UK), Department of Health (UK) and CSIRO Mathematical and Information Sciences and Sustainable Ecosystems (Australia), respectively. IBM holds the fourth position in our top 10 list with regards to the number of papers and the number of authors.
Table 6 List of the top 10 organisations that published in JORS (2000–2009)
(9) Analysis of the most productive authors
The focus of our next analysis was to determine the authors who have published the most during the period 2000–2009 in JORS. For assessing research productivity, we counted the number of publications from each author/co-author. lists the 18 most productive authors, along with their current affiliations and geographical locations, sorted by the number of publications as well as alphabetically for authors sharing the same number of publications. In order to present the findings of this analysis in the form of a table, we have included only those authors in the list who have published seven or more articles during the period studied. The top place is occupied by Laporte with 22 publications, followed by Thomas with 12, then Kim with 10, Berman, Lim and Mingers with nine publications each, and then by Drezner, and Gupta with eight publications each. The remaining 10 authors in each contributed to seven publications. Nineteen authors contributed to six articles, 20 authors to five articles, 49 to four articles, 99 to three articles, 317 authors contributed to two articles and, finally, the largest number of authors (1877) contributed to just the one article.
Table 7 List of the top 18 most productive authors with seven or more publications, their current affiliations and the order of authorship
A further analysis determined the order of the most productive contributor on multi-authored papers. The findings presented in suggest that although Laporte is the most productive author, he only appears as the first author in two articles. This is also true for the third researcher, Kim, who has only co-authored JORS articles in the period studied. On the other hand, the largest number of first-authored articles were contributed to by Berman (eight articles) and Podinovski (seven articles), followed by Ormerod and Robinson, who are the first authors in six out of the seven articles in which their name is present.
(10) Citation analysis
We conducted a citation analysis to determine the research impact of JORS publications. Citation counts can be extracted from different alternative databases such as Google Scholar and ISI Web of Science. However, some recent studies have compared these databases to illustrate that both these databases possess some shortcomings that may affect the quality and the precision of citation data (CitationJacso, 2005; CitationClarke, 2008a, Citation2008b). For example, CitationJacso (2005) found that Google Scholar records citations from all sources including conferences, book chapters, working papers and other non-traditional sources that may affect the quality of citation data. Similarly, CitationClarke (2008a, Citation2008b) found many serious problems in citation analysis particularly when using ISI Web of Science for this purpose. Since both the databases reportedly have some shortcomings, we have considered it appropriate to employ both ISI Web of Science and Google Scholar for citation analysis of JORS publications. provides citation data from Google Scholar and ranks the articles according to the number of total citations. In the last column of the table, the average citations (total citations divided by the number of years since publication) are also shown. This is another way to measure the research impact of articles taking into account the years passed since publication. This is important since older articles have a higher chance of having more citations and average citations, or ‘citations per year’, allows comparative citation measures among articles. The findings suggest that the highest number of Google Scholar citations (188) is for the theoretical article entitled ‘A unified tabu search heuristic for vehicle routing problems with time windows’ by Cordeau et al published in 2001. Second in the list is a review paper entitled ‘A guide to vehicle routing heuristics’ by the same first author published in 2002, with 145 citations. With 96 citations, the third position is occupied by the article entitled ‘Benchmarking state-of-the-art classification algorithms for credit scoring’ by Baesens et al published in 2003. Eighty-eight citations for an article of the same year entitled ‘Performance metrics in supply chain management’ written by Kleijnen et al places it in fourth position. It is worth mentioning that if we had ranked our whole database of 1459 papers according to average citations (and not total citations), the first four articles would still have appeared in the same order. We may therefore conclude that the topics dealt with in these papers are quite popular. For example, the top two articles are on vehicle routing and this has been identified as a popular subject in our subsequent analysis (see ).
Table 8 List of the top 16 most cited JORS papers—using Google Scholar database for citation analysis
Table 10 OR techniques that are most frequently researched/practised by JORS authors
Looking at the ISI Web of Science citation analysis in , we notice that the number of total citations is much lower overall. A simple explanation for differences in the citation count obtained from these two sources is that ISI Web of Science only records citation counts if a particular article is cited by journal articles indexed in the ISI Web of Science database. Only journals with an impact factor are indexed in this database, thus eliminating citations included in conference articles and book chapters. However, Google Scholar records citations from all sources including conferences, book chapters, working papers and even from non-peer-reviewed sources. Therefore, it is important to remind readers that for citation analysis purposes, cautious use of Google Scholar should be made to avoid distortion in data introduced by including non-peer-reviewed citations. Nevertheless, the first three most popular articles remain the same in the two tables, both in terms of total and average citations. On the other hand, from the 13 remaining articles only three are common between . These articles are Teng et al published in 2002, Mosheiov et al and Ulrich et al both published in 2003.
Table 9 List of the top 16 most cited JORS papers—using ISI Web of Science database for citation analysis
(11) Analysis pertaining to OR techniques
We now present an analysis of the OR techniques that have been reported in JORS articles published between 2000 and 2009. lists the OR techniques, the frequency of their occurrence in JORS papers and their corresponding percentages. The table includes 25 OR techniques with more than 1% presence in the dataset. The total frequency (2363) of all topics is higher than the total count of articles (1459) published during the study period. This is because an article often deals with multiple topics. Furthermore, an OR technique may be described in general terms (eg heuristics) as well as in specific terms (such as tabu search, simulated annealing, genetic algorithms, etc).
The most frequently researched/practised topics by JORS authors are heuristics (157 articles, 6.6%) and scheduling (151 articles, 6.4%), followed by Data Envelopment Analysis (125 articles, 5.3%), simulation (108 articles, 4.6%) and optimisation (95 articles, 4%). Integer programming, mathematical modelling and vehicle routing are next in line in terms of frequency of occurrence in JORS papers. The remaining 17 OR techniques (out of a total of 145 OR techniques) are illustrated in . The popularity of topics over the decade seems to be fairly constant with only a few exceptions. For example, some OR techniques predominate in certain years because in the same year special issues focussing on the very techniques may have been published.
(12) Analysis pertaining to the areas/sectors of OR application
In our final analysis, we present the sectors that have seen the predominant application of OR techniques () in the years 2000–2009. The first position is occupied by the general area of Methodology and the second position is shared between the Transportation and Production/Manufacturing sectors. The predominance of Methodology implies that many articles analyse and develop specific OR techniques and focus more on the method rather than on testing their application on a specific sector. The prevalence of papers relating to the Transportation sector (111 JORS papers, 6%) makes it one of the most popular application areas together with production/manufacturing and the more specific flow-shop/job-shop/machine scheduling applications (98 JORS papers, 5.3%). The health-care sector comes next with 88 JORS papers (as shows, the popularity of health care has meant that two special issues have been dedicated to the topic and this, in turn, has increased the paper count). Other areas that utilise OR techniques are inventory problems, supply chains, military/defence, logistics etc (refer to ).
As can be seen from the table below, the total frequency of all application areas (1851) is higher than the total count of articles (1459) published in JORS during 2000–2009. The reason for this is outlined in the previous analysis.
Discussion and further reflections
The findings presented above explored a number of dimensions of the JORS publications from 2000 to 2009. This allowed us to identify certain trends that are applicable to JORS. However, since JORS is a top OR journal, we may conclude, through inference, that some of these trends may apply to the OR discipline as a whole.
By examining the topics of the special issues published in JORS during this decade, we identify some trends with regards to OR techniques and its applications. We see that local search (part of heuristics), credit scoring, DEA and data mining are popular techniques used in OR. This is consistent with our findings of the most researched OR techniques in which heuristics and DEA hold the first and the third positions, respectively. From a brief impression, DEA appears to have been well represented in the UK Research Assessment Exercise of 2008 also. Other popular OR methodologies are scheduling and simulation. On the other hand, strategy, supply chain management, defence, health care and government are also applications that JORS has presented in special issues and which are in relatively high positions in the list of the most researched OR applications. Other popular applications areas of OR are in transportation, production/manufacturing, machine scheduling and inventory.
Over 40% of the examined articles have two authors and approximately one fifth are single authored, with a further 25% having three authors. There are no discernible trends in terms of single-authored and collaborative papers over the decade. In terms of the geographical location of the contributors, the largest number of authors were located in the UK and the US. The US has a comparatively large Operational Research/Management Science (OR/MS) community, and thus one might have expected a much larger presence of US authors. One reason for this is that excellent OR/MS journals are published in the US and the American academics may be targeting the North Atlantic OR/MS journals rather than the European ones. Yet, another reason may be the dissimilar missions of the OR/MS journals published in the UK and the US, and notably the different flavours of OR/MS that is researched and practised in the UK. The EPSRC review of research status of OR in the UK (CitationEPSRC, 2004) draws attention to this difference, and we quote ‘interacting with the client in a collaborative venture to define and structure issues and move towards a solution’…. perhaps more reflective of OR/MS in the UK, in comparison with, say, the US or SE Asia, where Operational Research concentrates more on the solution phase of an intervention. It is in this type of working that perhaps UK OR/MS has distinguished itself ‘and is perhaps a reason for the UK's particular success in tackling messy “wicked” problems’ (CitationWilliams, 2008).
Clearly, in comparison with representation from the academia, a very small proportion of the authors were from industry. This has been a consistent trend for many years and was discussed in a series of viewpoints published in JORS (CitationWilliams, 1999 and preceding viewpoints). Some underlying reasons for this may be a lack of time for practitioners to write up their work, a lack of motivation for practitioners to publish work in a journal such as JORS, or a lack of familiarity with the conventions and requirements of an academic publication. The decline of ‘large group’ OR highlighted by CitationFildes and Ranyard (1997, Citation1999, Citation2000) may also have contributed. The culture of converting internal reports into publishable papers, encouraged in many large OR groups, may have declined because of the pressures on ‘small’ commercial OR groups. To reverse this trend, the JORS editors throughout recent decades have sought to elicit an ever increasing number of ‘good’ papers from practitioners, without as much success as they would like. However, the representation of case-oriented papers in JORS issues seems to have increased over the last 4 years in line with the wishes of the editors, who had wanted to increase the dominance of real-world and practical (while still being academically sound and innovative) advances in OR. This increase appears to be larger than the corresponding increase of theoretical papers (which still represents the majority of JORS papers).
A larger number of contributions were from UK universities rather than universities from other countries, with the largest number of contributors and publications associated with the Universities of Southampton and Warwick. Situated outside of the UK, the National Chiao Tung University and the City University of Hong Kong were also dominant institutions in terms of the number of contributions. In terms of practitioners, Defence Science and Technology Laboratories (DSTL), the Department of Health in the UK, CSIRO and IBM were some of the most representative organisations. Approximately 42% of the authors were affiliated to departments of Business and Management, followed at a distance by departments of Engineering and dedicated OR departments.
Our findings suggest that the most productive authors in terms of the number of papers published in the past 10 years were Laporte, G. (22 papers); Thomas, L.C. (12 papers), Kim Y.D. (10 papers); Berman, O., Lim, A. and Mingers, J. (9 papers each). CitationRanyard (2001) lists the 11 most prolific authors from 1981 to 1999. These include Christer, A.H., Goyal, S.K., Laporte, G., Williams, T.M. (now the JORS co-editor), Beasely, J.E., etc., with their number of contributions ranging from 16 to 10 over these 19 years. While comparing our findings, in relation to the productivity of authors, with those of Ranyard we notice that only Laporte, G. appears in both the lists. From this comparison two comments can be made—(a) it is only to be expected that from 1981 to 2009 the list of productive authors would include new names since this period spans nearly three decades; (b) the number of papers per author has dramatically increased (more than doubled) in the last 10 years compared with the previous 20 years. This could be an indication that research in the OR field has increased in the recent years, or it could be the outcome of the ‘publish or perish’ syndrome, which has developed in the UK in response to the Universities’ Research Assessment Exercise and in other countries who are undertaking similar exercises.
Another observation that can be made with regards to Ranyard's study is that the 16 most cited articles in the period from 1981 to 1999 (papers identified using citation counts retrieved in 2001 from ISI Web of Knowledge database) lie in a range that it is only slighter higher (34–92) than the range of most cited articles in the period between 2000 and 2009 (26–85). However, we would expect this difference to be greater as the papers in the first study have had more chance to be cited, and especially those from the early 1980s with around 30 years of presence. Nonetheless, we also need to consider that as years go by there is new research in every field which substitute, to some extent, the older methodologies and findings.
Finally, if we examine the first authors of the most cited papers from 1981 to 1999 (Ranyard's study) and from 2000 to 2009 (our study), we see none in common. However, Drezner, Z. and Gupta, J.N.D. who are the authors of the 17th and 18th most cited papers in the period 1981–1999 appear in the list of the most prolific authors of this decade (see ), being at positions seven and eight, respectively. Thus although our profiling has identified some new trends in JORS, there are also many points of consistency for the journal over the last 30 years.
References
- Association of Business Schools (2009). Academic journal quality guide (version 3). In: Kelly A, Morris H, Rowlinson M and Harvey C (eds). Available online: http://www.the-abs.org.uk/files//abs_web_subject.pdf. Last accessed 28 June 2009.
- AvisonDDwivediYKFitzgeraldGPowellPThe beginnings of a new Era: Time to reflect on 17 years of the ISJInform Syst J200818152110.1111/j.1365-2575.2007.00282.x
- ClarkeRAn exploratory study of Information Systems researcher impactCommun Assoc Inform Syst2008221132
- ClarkeRA citation analysis of Australian information systems researchers: Towards a new eraCommun Assoc Inform Syst20081523556
- ClaverEGonzalezRLlopisJAn analysis of research in information systems (1981–1997)Inform Mngt2000374181195
- DwivediYKKuljisJProfiling IS research published in the European Journal of Information Systems (EJIS)Eur J Inform Syst20081767869310.1057/ejis.2008.57
- DwivediYKKiangMLalBWilliamsMDProfiling research published in the journal of electronic commerce researchJ Electron Comm Res2008927791
- DwivediYKLalBMustafeeNWilliamsMDProfiling a decade of Information Systems Frontiers' researchInform Syst Front20091118710210.1007/s10796-008-9147-7
- EPSRC (2004). Review of Research Status of Operational Research in the UK. Swindon, UK: Engineering and Physical Science Research Council/Economic and Social Research Council. Available online: http://www.epsrc.ac.uk/CMSWeb/Downloads/Other/OpResReview.pdf. Last accessed 3 July, 2009.
- ErnstATJiangHKishnamoorthyMSierDStaff scheduling and rostering: A review of applications methods and modelsEur J Opl Res200415332710.1016/S0377-2217(03)00095-X
- FildesRNikolopoulosKCroneSFSyntetosAAForecasting and operational research: A reviewJ Opl Res Soc2006591150117210.1057/palgrave.jors.2602597
- FildesRRanyardJSuccess and survival of operational research groups—A reviewJ Opl Res Soc19974833636010.1057/palgrave.jors.2600389
- FildesRRanyardJThe management of OR groups: Results of a surveyJ Opl Res Soc19995056358010.1057/palgrave.jors.2600756
- FildesRRanyardJInternal OR consulting: Effective practice in a changing environmentInterfaces2000305345010.1287/inte.30.5.34.1638
- FleischmannMBloemhof-RuwaardJMDekkerRvan der LaanEvan NunenJAEEvan WassenhoveLNQuantitative models for reverse logistics: A reviewEur J Opl Res199710311710.1016/S0377-2217(97)00230-0
- FonDHollinghurstSTempleMRoundALesterNWeightmanARobertsKCoyleEBevanGPalmerSSystematic review of the use and value of computer simulation modelling in population health and health care deliveryJ Public Health20032532533510.1093/pubmed/fdg075
- FraminanJMGuptaJNDLeistenRA review and classification of heuristics for permutation flow-shop scheduling with makespan objectiveJ Opl Res Soc2004551243125510.1057/palgrave.jors.2601784
- GalliersRDWhitleyEAPaulRJGuest editorial: The European information systems academyEur J Inform Syst20071613410.1057/palgrave.ejis.3000669
- GallivanMBenbunan-FichRAnalysing IS research productivity: An inclusive approach to global IS scholarshipEur J Inform Syst2007161365310.1057/palgrave.ejis.3000667
- GravesSCA review of production schedulingOper Res19812964667510.1287/opre.29.4.646
- HaksözÇSeshadriSSupply chain operations in the presence of a spot market: A review with discussionJ Opl Res Soc2007581412142910.1057/palgrave.jors.2602401
- HollocksBWForty years of discrete-event simulation a personal reflectionJ Opl Res Soc2006571383139910.1057/palgrave.jors.2602128
- JacksonMCBeyond problem structuring methods: Reinventing the future of OR/MSJ Opl Res Soc20065786887810.1057/palgrave.jors.2602093
- JacsoPAs we may search—Comparison of major features of the Web of Science, Scopus, and Google Scholar citation-based and citation-enhanced databasesCurr Sci20058915371547
- JunJJacobsonSSwisherJApplication of discrete-event simulation in health care clinics: A surveyJ Opl Res Soc19995010912310.1057/palgrave.jors.2600669
- PalviaPPinjaniPSibleyEHA profile of information systems research published in Information & ManagementInform Mngt2007441111
- RanyardJEditorialJ Opl Res Soc2001521310.1057/palgrave.jors.2601108
- SilverEAOperations research in inventory management: A review and critiqueOper Res19812962864510.1287/opre.29.4.628
- Simchi-LeviDFrom the EditorOper Res2008561210.1287/opre.1070.0516
- TurnerHSGovernment operational research service: Civil OR in UK central governmentJ Opl Res Soc20085914816210.1057/palgrave.jors.2602452
- WilliamsTMManagement Science in Practice2008
- WilliamsTMViewpoint—More on case study papersJ Opl Res Soc199950959610.1057/palgrave.jors.2600691
- WilliamsTMWilsonJMEditorialJ Opl Res Soc200253110.1057/palgrave.jors.2601311
- WilliamsTMWilsonJPiddMEditorial: The next 50 years of ORJ Opl Res Soc20055647948210.1057/palgrave.jors.2601977