Abstract
From its foundation, operational research (OR) has made many substantial contributions to practical forecasting in organizations. Equally, researchers in other disciplines have influenced forecasting practice. Since the last survey articles in JORS, forecasting has developed as a discipline with its own journals. While the effect of this increased specialization has been a narrowing of the scope of OR's interest in forecasting, research from an OR perspective remains vigorous. OR has been more receptive than other disciplines to the specialist research published in the forecasting journals, capitalizing on some of their key findings. In this paper, we identify the particular topics of OR interest over the past 25 years. After a brief summary of the current research in forecasting methods, we examine those topic areas that have grabbed the attention of OR researchers: computationally intensive methods and applications in operations and marketing. Applications in operations have proved particularly important, including the management of inventories and the effects of sharing forecast information across the supply chain. The second area of application is marketing, including customer relationship management using data mining and computer-intensive methods. The paper concludes by arguing that the unique contribution that OR can continue to make to forecasting is through developing models that link the effectiveness of new forecasting methods to the organizational context in which the models will be applied. The benefits of examining the system rather than its separate components are likely to be substantial.
Introduction
OR has made many contributions to forecasting research and practice. But the last 25 years have seen the rapid growth of specialist forecasting research. The aim of this paper is to review the distinctive opportunities that still remain available to operational research (OR) and in so doing, suggest where OR's particular contribution can best lie. As late as the start of the 1980s it was possible to survey all quantitative forecasting research and two review papers were published in JORS, aiming at an OR audience (CitationFildes, 1979, Citation1985). The first focussed on extrapolative methods that only use the past history of the time series to forecast ahead. The previous decade had seen a rapid development of these new methods, most noticeably, from statistics, Box and Jenkins’ development of Autoregressive Integrated Moving Average (ARIMA) models (CitationBox et al, 1994), and from engineering, state-space models (CitationHarvey, 1984), and CitationHarrison and Stevens’ (1971) Bayesian multi-state Kalman filtering models. These new methods were added to an existing stable of exponential smoothing alternatives developed from an OR perspective, in particular CitationBrown's many contributions (1963) and adaptive smoothing (CitationTrigg and Leach, 1967). After considering how such methods should be evaluated, CitationFildes (1979) argued that OR's contribution could be best understood through questions as to which method is most cost-effective and acceptable to users, by how much, and in what context. Only tentative answers were then available.
The second paper (CitationFildes, 1985) developed various principles of causal econometric modelling in contrast to standard OR practice. Such models are based on the explicit construction of a system of equations describing the economic or market system under consideration. OR cannot claim to have made any of the fundamental advances in time series econometrics over its long history, which started with attempts in the 1920s to forecast agricultural prices. The early 1980s was a period of rapid developments in econometrics and by 1985 the econometric literature was voluminous. New theories of econometric model building, such as an increased emphasis on regression model dynamics, were gaining currency (prompted in part by the arguments of Box and Jenkins). What was the evidence of improving accuracy resulting from these innovations in econometrics, CitationFildes (1985) asked? His answer was that these newer ideas, propounded most vigorously by Hendry (CitationGilbert, 1986) under the heading ‘general-to-specific’ modelling, seemed to be delivering improved accuracy beyond that available from extrapolative modelling, though the winning ratio was less than what econometricians might have liked. OR was primarily a user of such methods in applications such as CitationBunn and Seigal's (1983) analysis of the effects of TV scheduling on electricity demand; but as Fildes pointed out (in Table 2, 1985), many of the published applications seemed inadequate, failing to take into account basic modelling principles. The failure of OR to follow its own modelling building principles (as found for eg in CitationPidd, 2003) was mirrored by the failure of econometricians (at least as exemplified by their text books) to lay down operational rules and principles. Thus, the evaluation of an econometric model compared to some simple benchmark extrapolative alternative was itself complex and overly subjective, highlighting the need for agreed criteria for comparing methods and forecasts.
The last 25 years have seen rapid developments in forecasting research across a broad range of topics as well as the institutionalization of many of its aspects. These include (i) the founding of the International Institute of Forecasters with the objective ‘to unify the field and to bridge the gap between theory and practice’; (ii) the successful publication of two forecasting journals (International Journal of Forecasting and Journal of Forecasting) as well as journals with a more methodological focus such as Journal of Business & Economic Statistics; (iii) an annual conference devoted to forecasting; (iv) four Nobel prizes for research in forecasting and related areas; and (v) practitioner-oriented activities including the founding of a journal, Foresight, and professional conferences run by software companies and commercial suppliers. In addition, summaries of much of this research have recently been published to commemorate the founding of the International Institute of Forecasting (see International Journal of Forecasting, 22:3). In order to draw lessons for OR from this growth in forecasting research, we will therefore consider those aspects of forecasting that have most relevance to OR applications.
In examining forecasting and OR, we have drawn the boundaries widely to include all forms of predictive modelling emerging since the last review: these include time-series-based quantitative methods (of course) but also areas where primarily cross-sectional data are used, often leading to a categorical prediction to provide a forecast of future events through classification. Judgemental approaches have also been included. Thus, it is the objective of the method or approach, rather than the characteristics of the past data used to produce the forecast, that, for us, defines a forecasting problem. A survey of forecasting articles and their citations has helped us here. We have examined articles published in the journals Computers & OR, Decision Sciences, Decision Support Systems, European Journal of Operational Research, Interfaces, International Journal of Production Economics, JORS, Management Science, Marketing Science, Omega, and Operations Research to highlight those areas that have proved of most interest to the OR community.
A Note on Keywording: A pool of possible articles, published in the years 1985–2006, were identified using the Thomsons's Citation Indices through searching on the keywords ‘forecast* OR predict*’ (the * representing a wildcard). This gives more weight to more recent publications due to increasing coverage and more fuller abstracting. We then eliminated articles outside our chosen broad scope and keyworded the remainder. This is not an exact science, despite the multiple checks employed! Almost all forecasting articles have fallen within the chosen range of the keywords. The resulting data bases have been placed on the International Institute of Forecasters web site for anyone interested in checking. An application focussed article is only given a method keyword if it includes some elements of methodological novelty in the application. One effect of this is that new methods such as neural nets are more often keyworded. The resulting frequency of discussion of the topics are ranked in and compared where possible with publications in the forecasting journals.
Table 1 Forecasting topics published in OR journals: 1985–2006
demonstrates quite a different list of concerns in the examined OR journals when compared to articles published in the forecasting journals (see also Tables 2 and 3 in CitationFildes, 2006), although the years examined differ. The first contrast we see is the application areas of supply chain planning, marketing models and customer relationship management are much more prevalent. There is little evidence of substantial methodological interests in the established areas of univariate and multivariate modelling, except where computationally intensive methods (including, for eg, neural nets) have been used. In the forecasting journals in contrast, econometrics has proved most influential across the whole field of business, economics and management (CitationFildes, 2006). Organizational aspects of forecasting, including information systems issues, have gained only limited attention in both sets of journals, despite their prima facie importance to practice (and our perspective in this review is that forecasting research above all should aim to improve practice).
We can examine where the OR community's contribution has been most influential by looking at those references in our selection of core journals that have been frequently cited. Focussing on the 21 articles with at least 50 citations published in the OR journals (compared to 137 published elsewhere in the forecasting and business and management journals), 10 were published in Management Science, with six in Marketing Science and one in Interfaces. The results are shown in . (If the definition of OR was expanded, two articles in Fuzzy Sets and Systems could also be included, an area which sets its own standards without reference to others! See the often cited CitationKim et al (1996), for a gently critical assessment.)
Table 2 Most cited forecasting articles published between 1985 and 2006
While it takes some time to accumulate 50 citations, all but one of the frequently cited articles were published at least 10 years ago. The Management Science articles primarily discussed combining methods, including the role of judgement. Two articles, CitationGardner and McKenzie (1985) and CitationCollopy and Armstrong (1992), proposed new extrapolative forecasting methods as we discuss in the section on Extrapolative methods. Three of these highly cited articles (CitationSalchenberger et al, 1992; CitationTam and Kiang, 1992; CitationWilson and Sharda, 1994) provided early introductions to the application of a computer-intensive method, new to the OR community (neural networks), to bankruptcy prediction.
The only recent high citation articles concern the effects of uncertainty on the supply chain (CitationChen et al, 2000, with more than 100 citations, and CitationCachon and Lariviere, 2001, with 50). This has encouraged a growth area of related articles, as we will discuss in the sub-section 2.1.4. The Marketing Science references are also applications oriented; to brand choice, to service provision, and to customer relationship marketing, all only indirectly concerned with forecasting. The Interfaces article is concerned with forecasting practice.
JORS has seen less citation success with no single article making the cut-off. Its two most cited papers are concerned with ‘evaluation’: CitationYoon et al's paper (1993) comparing discriminant analysis and neural nets (on cross-sectional data) and CitationFildes’ (1985) paper on causal modelling. Other areas of interest have been extensions to trend curve modelling (CitationHarvey, 1984) with its potential application in the new product forecast area, a paper on combining (CitationBordley, 1982) and CitationJohnston and Boylan's (1996) influential renewal of interest in intermittent demand.
In summary, as we show at greater length in the following sections, there have been relatively few influential methodological developments made in the OR journals with just two papers contributing to extrapolative forecasting and nothing in econometrics or computer-intensive methods. Nor have there been many overlapping interests with the forecasting journals and a de facto segmentation has emerged. Instead, specific models, developed for applications in operations and marketing, have generated the greatest interest (as well as the discussion of neural nets as they apply to bankruptcy prediction).
As in the earlier survey papers, our focus here is on accuracy and the potential for valuable improvements, not just theoretical niceties. Some have suggested that the aim of producing valuable forecasts is not achievable. This indicates an ignorance of research developments and the lack of a necessary apprenticeship in examining organizational data. In looking at OR's problem domain, we aim to show that accuracy improvements can be made. But in organizational forecasting these potential gains are not always available to practising forecasters; like any other management innovation, there are barriers to the adoption of better practices.
The remainder of this paper is organized in three sections. By drawing on recent survey papers, in Section 1 we focus on four core approaches of forecasting: (i) extrapolation; (ii) causal and multivariate methods; (iii) computer-intensive methods; and (iv) judgemental forecasting, followed by a discussion of issues related to measuring accuracy and the forecast error distribution. In , in what is inevitably a subjective view, we concentrate on the two applications areas where OR's contribution has been most significant: (i) operations, and (ii) marketing models, including customer relationship management (CRM) and credit risk. Our justification is that these have generated the most academic research (as measured through citations).
Forecasting to support operations is the application area where OR first contributed, and it remains important, with research yielding new results through both improved methods and organizational processes. In the second of our highlighted areas, marketing, there is a wide range of forecasting issues to face as part of market planning (CitationArmstrong et al, 1987). Econometric models that incorporate marketing instruments such as promotional campaigns or retail display have long been available but seldom implemented. New product models also have a long history, going back to CitationBass's article in Management Science (1969), and remain a vigorous area of research. Finally, CRM and credit risk models have seen the greatest changes with new computer-intensive methods being advanced and quickly finding application. The section closes with a discussion on the role of computers and information system (IS), the means by which all organizational forecasting is delivered and therefore a potentially constraining factor on progress. CitationFildes’ (1979) speculation that ‘major developments could be expected in computer package design’ has turned out to be false: it still remains a limiting factor.
We have not paid much attention to the specialist area of finance for while there has been considerable interest both in the OR and forecasting journals, the area is so large with its own specialist journals (which seldom cite the OR journals) that we mention only those few papers that have gathered much citation attention, the papers that have aimed at introducing the computer-intensive method of neural nets to the OR community.
In the final section of the paper, we evaluate OR's contribution to forecasting, arguing that while there will always be competition with the forecasting journals to publish excellent methodological research, OR's primary distinction is likely to arise at the interface between novel forecasting methods and the requirements of particular areas of application. A bit to our surprise on re-reading the 1979 survey paper it was a prediction made at that time – perhaps somewhat prematurely!
1. 25 years of forecasting research
1.1. Extrapolative methods
The 1970s saw the development of new methods of forecasting, and these generated considerable excitement in the OR community. CitationHarrison and Stevens’ Bayesian Forecasting, first aired in the Society's journal (1971) and partially implemented in CitationBeer's (1975) online economic planning system in Chile, vied with Jenkins’ espousal of his and Box's interpretation of autoregressive modelling, the ARIMA methodology (1970, third edition 1994). A further alternative was the state-space approach of CitationMehra (1979), later more widely publicized by CitationHarvey (1984). These, together with Harrison and Stevens’ Bayesian alternative, could be operationalized through time-share computer systems, while widely available NAG software delivered methods for ARIMA identification and estimation. The Forecasting Study Group of the Society hosted many large meetings to introduce OR practitioners to the new developments. Perhaps, we wondered, the uncertainties of forecasting could finally be overcome. The practitioner's role was to choose between the alternatives and that required a rigorous methodology for evaluation. Here, building on earlier work by CitationNewbold and Granger (1974), CitationFildes (1979) offered some advice, while CitationMakridakis and Hibon (1979) compared some 13 core extrapolative forecasting methods with the objective of reconciling the earlier evidence. From Newbold and Granger onward, such comparisons generated considerable interest and controversy with the success of a method conflated with the prestige of its developer. What better way to help practitioners choose and to stimulate academic debate when launching the International Institute of Forecasters and a new forecasting journal (J. Forecasting), than to conduct a ‘forecasting competition’ where these new methods could be carefully compared to earlier, usually simpler, methods such as exponential smoothing? The M-Competition (CitationMakridakis et al, 1982) included Bayesian forecasting and ARIMA modelling, as well as many variants. The results were disappointing to many and led to criticisms but, as CitationFildes and Makridakis (1995) showed, these results have resisted attempts to dismantle the core conclusions: on average simpler smoothing methods apparently performed better than these new, more complex approaches.
The last 25 years have produced fewer new extrapolative methods (leaving aside those we classify as ‘computer-intensive’ discussed in Section 1.3). Following in Brown's footsteps of pragmatic, easily implemented model building, Gardner's variant of exponential smoothing (CitationGardner and McKenzie, 1985) has proved the most empirically accurate new method and has gained substantial academic attention. Here the trend is damped with a forecast function, Ŷt(k) for the k-step ahead forecast of Yt made in period t, of: with
and
et is the one-step ahead forecast error, α and γ are the regular smoothing parameters, φ is the damping smoothing parameter and 0⩽φ⩽1. For φ=1 this is equivalent to Holt's model, while for φ=0 this gives simple smoothing. It is easily extended to include seasonality. Gardner's damped trend smoothing has proved remarkably effective in the various forecasting competitions that have followed on from the M-Competition and could reasonably claim to provide a benchmark forecasting method for all others to beat. Unfortunately, few commercial software packages yet include it. Smoothing methods have seen further innovations, including CitationTaylor's (2003) multiplicative damped model leading to 15 variants of exponential smoothing. All the issues surrounding exponential smoothing are ably reviewed in CitationGardner (2006).
Let us represent a time series as This is equivalent to simple exponential smoothing (with trend=0) and was developed by CitationHarrison and Stevens (1971) into multi-state Bayesian Forecasting.
A recent innovation, a new variant based on an alternative form, which has certain attractive theoretical features, is the so-called single source of error model (CitationOrd et al, 1997; CitationHyndman et al, 2002), For damped trend smoothing this is given by where φ is the damping factor, and as before, l represents the level and b the trend. Here the error terms, in the observation equation and the state equations for the level and trend, are proportionate, that is, εt, αεt, βεt. For φ=0 this is equivalent to simple smoothing, (1) above, and with φ=1, this gives Holt's linear trend. (However, due to initialization and alternative methods of parameter estimation the actual results will usually differ.) The formulation permits the explicit calculation of prediction intervals (CitationKoehler et al, 2001), thereby removing a long-standing criticism of so-called ad hoc smoothing methods. Empirical performance is naturally similar to that derived from conventional smoothing formulations. What has in fact been achieved is a unified statistical framework in which all the variants of exponential smoothing are embedded (CitationHyndman et al, 2008).
The second innovation in extrapolative methods arising from within the OR literature is rule-based forecasting (CitationCollopy and Armstrong, 1992). Its basis was developed from protocols derived from expert forecasters. However, its empirical performance is generally worse than a damped trend smoothing benchmark (see CitationMakridakis and Hibon, 2000; CitationGardner, 2006). An interesting innovation is that it can be developed to incorporate ‘fuzzy priors’ on the trend (CitationArmstrong and Collopy, 1993).
The other area of substantial activity has been in non-linear modelling (for a summary see Section 6 of CitationDe Gooijer and Hyndman, 2006). There are two distinct approaches: the first is from a statistical tradition where the emphasis is on stochastic specification and optimal (statistical) estimation, and the second is from a computer science paradigm where structured algorithms are developed to minimise some (usually squared error) loss function. We discuss non-linear statistical models only briefly here. In the OR literature, in contrast to the forecasting journals, there have been few applications of the many non-linear statistical models apart from finance where such models have been applied to a time-varying model error term; the primary research interest has been in computer-intensive non-linear methods. (No standard terminology exists to classify a wide variety of non-linear models, some of which incorporate an explicit statistical structure while others are defined algorithmically. ‘Fuzzy set’ approaches have been included here.) As we discuss in Section 1.3, these have been primarily applied to cross-sectional classification problems such as consumer credit risk (see the discussion in the following section); there have been only a limited number of applications to time series with conflicting results (see eg, CitationMakridakis and Hibon (2000); CitationLiao and Fildes (2005), the former negative, the latter positive).
Because of the failure to establish a single dominant class of extrapolative methods (despite the claims made on behalf of both the ARIMA class and the state-space class), research into combining diverse methods has remained a major interest area, as and show. While CitationBates and Granger's (1969) ORQ article, also referred to in Granger's Nobel citation, was not the first to examine the topic of combining, it continues to remain influential with 325 citations. The core question has concerned the choice of weights to attach to the methods being combined, but despite many suggestions, no new variants have convincingly beaten the ‘equal weights’ method. However, there has been more success in such ‘hybrid’ methods in data mining (see Section 1.3). A variant of combining, method selection (CitationFildes, 1989), which aims to predict the best method for a data series, has received little research attention despite its prevalence in practice.
The final area in which progress continues to be made is in estimating seasonality. Often seasonal estimates are noisy and yet their accuracy is usually a major determinant of forecast accuracy itself. In the situation where there are many data series sharing similar seasonal components, better estimates of seasonality can be obtained by shrinking the estimates towards the mean. Examples can be found in CitationBunn and Vassilopoulos (1999), CitationDekker et al (2004) and CitationMiller and Williams (2004). Recently, CitationChen and Boylan (2007) derived guidelines for when such shrinking should prove helpful.
1.2. Causal and multivariate methods econometric methods
The most influential forecasting articles published in the last 25 years have come from new developments in econometrics (see Tables 4b and A2 in CitationFildes, 2006). OR has had no involvement in these methodological developments: an increased emphasis on incorporating dynamics into econometric models (CitationEngle and Granger, 1987) and modelling and forecasting heteroscedastic (non-constant time dependent) error variances (CitationEngle, 1982), the two topics that led to Engle and Granger's shared Nobel prize. The latter topic is discussed in Section 1.5. The issue of modelling non-stationary (trending) time series, however, remains a serious problem for any OR analyst with forecasting responsibilities attempting to include causal factors in their model.
A time series non-stationary in the mean is where the data trend, or more generally, have a time-dependent mean, a situation common in finance and when forecasting demand. If another time series Xt also trends it is all too easy to infer a spurious relationship with the output time series, Yt, if standard regression methods are used and the model is estimated.
Box and Jenkins were well aware of this in their approach to modelling of multivariate models and this led to automatic differencing of both input and output: with the above model estimated, often assuming β0=0. But as CitationHendry and Mizon (1978) wittily noted, such automatic differencing was equivalent to placing two untested-for constraints, λ=1 and β1=−β2, in the model:
The details of how such models should be estimated when both Yt and Xt potentially trend are beyond the space constraints of this survey article, but see for example CitationDiebold (2006). The important point is that tests are available for whether the series trends, and also whether there exist coefficients such that despite Y and X being non-stationary, the combination, Yt−(β0+β1Xt) is stationary, that is, with constant mean and second moments. Such series are called co-integrated. Unit-root tests aim to identify whether a series trends, and co-integration tests whether the above difference is stationary. These tests should be carried out prior to model specification, since the empirical results summarized in CitationAllen and Fildes (2005) suggest that such pre-testing improves subsequent forecasting accuracy. Automatic differencing, as in Equation(5)
above, seems to damage accuracy, with effects in longer term forecasting that can be substantial.
The best approach to building econometric models, as CitationAllen and Fildes (2001, Citation2005) show, relies on establishing a general unconstrained model (GUM) to test whether various parameter constraints hold (such as those leading to a model in first differences as in Equation(5) above), but still leaving the constrained parsimonious model compatible with the data. This will lead to the simplest model that is data compatible. As CitationFildes (1985) pointed out in a critique of OR model building, the first and probably most important task is to specify a suitably general GUM, equivalent to the system specification stage of model building. The principles of model building laid down there continue to hold; the initial model specification is the most crucial, followed by various simplification (model specification) strategies, and model diagnostic testing. There are many tests, and the applied modeller is reliant on good software to carry out these tests and encourage good statistical practices. (There seems to be an unwarranted assumption in parts of the OR community that Microsoft Excel® is sufficient—it is wholly inadequate.) Data-driven modelling (without reference to strong theoretical arguments for the model structure and the variables to include) that searches for relationships among the large set of available variables has proved of little value in time series. Principles for simplifying the initial GUM and testing the resulting model are laid out in CitationAllen and Fildes (2001), CitationClements and Hendry (1998) and CitationCampos et al (2005).
1.3. Computer-intensive methods
Unforeseen 25 years ago, computer-intensive methods have proved a fertile research area drawing strength from statistics, machine learning and computational intelligence. Their primary area of application in OR has been to data mining (DM) using disparate multivariate data types and large data sets for predictive classification in the areas of CRM and direct marketing as well as customer acquisition. One particularly important applications has been to credit risk and bankruptcy prediction with three articles in the top five of (see Section 2.2.3). They have also been used in time-series modelling, both extrapolative and causal.
Computer-intensive data mining methods have only recently begun to attract substantial interest in the OR community, with special issues in JORS (CitationCrook et al, 2001) and Computers & OR (CitationOlafsson, 2006) and an increasing number of DM tracks and special sessions at IFORS, INFORMS and EURO conferences. Since the notion of finding useful patterns from data for prediction has long been a statistical endeavour, statistical methods frequently provide the intellectual glue underlying DM applications (CitationHand, 1998). A number of survey articles have attempted to define the field and its relationship to other areas, in particular how DM differs from statistics (CitationChatfield, 1995; CitationHand, 1998). CitationBreiman (2001a) as well as CitationJain et al (2000) reviewed traditional ‘algorithmic’ versus ‘statistical learning’ methods. In a contrasting perspective, CitationChen et al (1996) give a survey of DM techniques from an informatics and database perspective.
As CitationOlafsson (2006) argued, the OR community has made substantial contributions to the design of DM algorithms, with early contributions on the use of mathematical programming for classification (CitationMangasarian, 1965). CitationPadmanabhan and Tuzhilin (2003) have provided a comprehensive overview of further opportunities for the use of optimization in DM for CRM. In addition, optimization methods from OR have been successfully employed to support DM methods, in particular for data and variable selection (CitationMeiri and Zahavi, 2006; CitationYang and Olafsson, 2006) and variable pre-processing through linear programming (CitationBryson and Joseph, 2001) or simulated annealing (CitationDebuse and Rayward-Smith, 1999).
Other issues arising in data pre-processing and model evaluation prove to be important (CitationCrone et al, 2006), but have mostly been ignored within the OR community.
The DM community has primarily developed independently without any significant contributions from the OR or statistical forecasting communities. A full review of the methods it has developed is outside the scope of this paper, but for an overview see the textbook by CitationTan et al (2005). Below we summarize three core DM methods that have proved their worth and have been (partially) adopted by the OR community.
Artificial neural networks (ANN) are a class of non-linear, semi-parametric methods originally motivated by an analogy with biological nervous systems. They have attracted unabated interest since CitationRumelhart and McClelland (1986) provided a popular solution for the non-linear programming problem arising in their estimation. ANN are frequently employed in a wide range of DM applications (CitationSmith and Gupta, 2000) following their introduction to the OR community by CitationSharda (1994). Zhang has provided prominent reviews of applications in regression and classification from a business forecasting and OR perspective (CitationZhang et al, 1998; CitationZhang, 2000).
More recently, researchers at AT&T Bell Laboratories developed the method of support vector machines (SVM) based upon statistical learning theory (CitationVapnik and Chervonenkis, 1979; CitationVapnik, 2000). Using quadratic optimization it delivers non-linear classification (CitationBoser et al, 1992; CitationScholkopf et al, 1997), as well as non-parametric (support vector) regression (CitationSmola and Schölkopf, 2004). In both cases the methodological advances and contributions to the development of the methods, and more controversially their application in predictive tasks, were made outside the OR and forecasting domains, despite OR's expertise in non-linear optimization and applications. Only recently has CitationYajima (2005) extended the parameterization of SVM towards linear programming, making one of the few contributions to the further development of the methods.
Decision tree (DT) classification and regression algorithms using recursive splitting rules are also part of the established panoply of DM methods, with major contributions by CitationQuinlan (1979, Citation1993), from a machine learning perspective, and CitationBreiman (1984) from statistics. CitationMurthy (1998) provides a comparative overview of DT in an application context.
Enabled by the abundance of computational power, ensemble methods that combine individual classification and regression methods through Boosting (CitationFreund and Schapire, 1997), Bagging or Random Forest proposed by CitationBreiman (1996, Citation2001b), have received enormous attention in the DM community due to substantial gains in predictive accuracy. Essentially these methods develop multiple models and predictions based on random or weighted sub-samples of the data and then combine the results through averaging (regression) or voting (classification). Although this reflects findings on combining methods in forecasting (see above), there has been little or no interaction between the two fields.
Early work in predictive DM did not address the complex circumstances in which the methods are applied. Recent advances have shown that different stages of the DM process are affected by the decision problem. For example, CitationProvost and Fawcett (2001) have demonstrated the effectiveness of cost-sensitive learning for methods if the misclassification costs are asymmetric (eg giving a loan to a subsequently defaulting customer costs more than rejecting a profitable customer). CitationChawla et al (2002) have shown how accuracy in decisions with imbalanced class distributions (where in a classification decision the ‘goods’ typically outweigh the ‘bads/defaulters’ in the sample) can be increased by oversampling the important minority class. Such benefit-based considerations may guide many decisions along the DM process. CitationCohn et al (1994, Citation1996) have demonstrated how selective sampling of observations instead of ‘learning from (all) examples’ can enhance the predictive accuracy of a classification method at the same time as lowering computational costs. CitationZheng and Padmanabhan (2006) have recently extended this idea of ‘active learning’ to the cost-effective acquisition of additional data to enhance classification performance. So far, only a few OR contributions have linked asymmetric costs or imbalanced data sets routinely found in OR applications to the methods and processes of DM (CitationViaene and Dedene, 2005; CitationJanssens et al, 2006; CitationPendharkar and Nanda, 2006).
1.4. Judgement in forecasting
A key development in forecasting research over the past 25 years has been an increased understanding of the role of judgement. In OR the focus of the research has primarily been on combining judgement with formal methods, the subject of two of the highly cited references in . Research has shown that formal methods of obtaining a judgemental forecast (sometimes aggregating a collection of individual forecasts) can improve on ad hoc approaches based on committee opinion or survey. Principles for improving individual judgemental forecasts have been laid down by CitationHarvey (2001) and CitationMacGregor (2001). Methods include Delphi, a modified and anonimised committee forecast (CitationRowe and Wright, 2001), and intentions-to-buy surveys, which, with modifications, can prove predictive of future sales (CitationMorwitz, 2001; Murthy, 2007). Even when quantitative methods have been used to produce the forecasts, judgement will typically make a contribution, from the selection of the formal method to employ and the selection of variables to include, to a final adjustment of the model's predictions.
CitationLawrence et al (2006) survey the many issues that are involved in incorporating judgement effectively. The results from the extensive research they report overturn the accepted earlier wisdom of the undesirability of incorporating judgement. Where substantive information is available to the judge (but not to the model), judgement will typically improve forecast accuracy. While judges’ forecasts will almost inevitably suffer from ‘heuristics and biases’, they can often add value to the model-based forecast. For example, CitationBlattberg and Hoch (1990) argued that forecast improvements could be derived using a simple heuristic of 50% model + 50% man (ie judge) when producing market forecasts, while CitationFildes et al (2008) show that such a simple model has only limited generality and can be substantially improved on in some circumstances.
However, judges often misinterpret the cues in their environment, including spurious effects, mis-weighting causal variables, etc. This has led to the counter-intuitive conclusion that models of the judge's forecasts often outperform the judge and that in fact, psychological bootstrap models of the judgemental forecasts will often outperform the judges’ raw forecasts (CitationArmstrong, 2001a). The key question arising from this apparently contradictory evidence remains to establish in what circumstances models work best, and when and how judgement can be improved to ensure it is effective in enhancing model-based forecasts. Research in the development of such decision support systems is as yet limited but we discuss its potential for OR in.
1.5. Evaluating point forecasts and estimating forecast uncertainty
Implicitly or explicitly, when choosing a forecasting method (or model) the forecaster is required to estimate the accuracy of its predictions based on the observed k-step ahead errors, et,k=Yt+k−Ŷt(k), where Ŷt(k) is the k periods ahead forecast of Yt+k made from forecast origin t. The last 25 years have seen substantial research on this issue. The first key distinction to draw is between in-sample errors, which result when a model has been estimated from the same data set, and out-of-sample errors, which result when a model, estimated on the in-sample data is evaluated on data not used in the model's construction. Our aim is to estimate future forecast errors and our best estimates will derive from the past out-of-sample errors (CitationFildes and Makridakis, 1995).
Often a practical requirement within an organization is to provide a ‘one figure’ summary error measure. CitationHyndman and Koehler (2006) give a recent summary of alternative measures. Defining the basic requirements of a good error measure is still a controversial issue. Standard measures such as root mean squared error (RMSE) or mean absolute percentage error (MAPE)=(1/n)∑t|et,k/Yt+k|, the most popular in practice (CitationFildes and Goodwin, 2007), have come under fire (see CitationArmstrong and Collopy (1992) and CitationFildes (1992) together with the discussion). Neither are robust measures in that outliers (a large error in the former, a low value of actual in the latter) can all too easily dominate the calculation. For MAPE, actuals of zero destroy the calculation. Trimmed means (or even medians) and relative error measures (where the error from one method is compared with the error from an alternative) overcome these problems. CitationHyndman and Koehler (2006) also provide an evaluation and some new suggestions aimed at overcoming some of the above weaknesses. In addition, the error measure should be calculated out-of-sample for the managerially relevant lead time by moving the forecast origin to repeat the error calculation (ie not arbitrarily averaged over lead times, CitationFildes, 1992). Few commercial software products meet these needs and some use measures that do not directly measure forecast accuracy at all, for example when the absolute error is defined relative to the forecast =|et,k/Ŷt(k)|.
Establishing an appropriate measure of forecast error remains an important practical problem for company forecasting, with its link to selecting a ‘best’ method and organizational target setting. It is also important in key planning calculations such as safety stocks and service levels. Ideally there should be a direct link to profitability but little research has drawn a convincing link, despite the commercial need (for an inventory control example, see CitationGardner, 1990; and the discussion in Foresight, 7, 2007). In some applications, poor accuracy performance (relative to some benchmark) can still translate into financial benefits (CitationLeitch and Tanner, 1991). From observations of company practice, surveys, and the examination of various commercial packages, we have little confidence that appropriate and organizationally relevant error measures are being used.
If a prediction interval is required that estimates the probability that a future actual observation lies within a specified range (usually with the point forecast at its centre), for linear regression, the calculations are available in Excel and all statistical software. More generally, for most model-based forecasts, including ARIMA and many state-space models, an explicit formula can be found which, together with a normality assumption, delivers the required prediction interval. These intervals are all conditional on the model being correct, itself an implausible assumption.
The adequacy of these theoretical formulae has proved suspect when their predictions of quantiles are compared to observed errors (CitationChatfield, 2001). For example, with an 80% prediction interval approximately 10% of out-of-sample observed errors should fall within each tail. Computer-bootstrapping methods offer a non-parametric alternative that can be used for complex non-linear models (see CitationChatfield (2001) for a brief overview; for an autoregressive example, see CitationClements and Taylor, 2001). Where data are plentiful, empirical estimates of the quantiles, based on the observed error distribution, are likely to be more accurate.
In applications, the future value of the forecast error standard deviation or a particular quantile may be needed if it is not assumed constant (the regular assumption). Engle's work on ARCH (autoregressive conditionally heteroscedastic) models of a time varying error variance offers one approach with the basic model of the error term (in a time-series or regression framework) as normal with conditional variance depending on the past error: which has led to many applications and extensions. However, the success of these models compared with empirical alternatives has proved limited (CitationPoon and Granger, 2003), whether in improving point forecasts (always unlikely) or measures of risk.
An alternative approach to estimating uncertainty is through forecasting the quantiles of the error distribution directly. CitationTaylor's (2007) exponentially smoothed approach is shown to apply to supermarket stock keeping units (SKU) sales in order to support stock control decisions. But empirical comparisons of different methods of estimating error distributions and quantiles are few and are potentially important in applications areas beyond finance as CitationTaylor's (2007) study shows.
Density forecasts estimate the entire future probability distribution of the variable being forecast and are a current ‘hot topic’ in forecasting research. Typically the raw data that provide the estimated density are a series of buckets breaking down and covering the expected range of outcomes together with the corresponding forecasted probability. A survey is provided by CitationTay and Wallis (2000) in the Journal of Forecasting together with extensions in the same issue (19:4). CitationTaylor and Buizza (2006) present an interesting application to pricing weather derivatives (a financial instrument to protect against weather risk so the extreme outcomes are important).
2. OR applications in forecasting
2.1. Forecasting for operations
OR's approach to forecasting for operations was established in the early work of CitationBrown (1963) where the link to production planning, service levels and inventory was fleshed out. The early OR journals published a number of major contributions with this focus covering a range of application areas. The approaches were pragmatic, seeking to find methods that delivered service–inventory cost improvements. Exponential smoothing with variants such as adaptive smoothing (CitationTrigg and Leach, 1967) was the result. As CitationFildes (1979) argued, at that time there were two strands of distinct research, OR's ad hoc smoothing methods and the statistical model-based methods such as Box and Jenkins. In applications, the smoothing methods dominated and still do today, embedded in the software that delivers hundreds or even thousands of forecasts monthly, or more often than that (CitationSanders and Manrodt, 1994; CitationFildes and Goodwin, 2007). In an extreme case, some retail application will typically have at least 30k SKUs to forecast daily, and these must be produced at store level for hundreds of stores. Similarly, airlines as part of their yield management system need to forecast daily for many routes. The question is then how to identify a suitable automatic forecasting system that can deal with many data series. This problem of method choice has become known as a ‘forecasting competition’ (Section 2.1.1).
A particular operational problem of method selection first laid out in ORQ by CitationCroston (1972) that faces both the retailer and the spare parts supplier is one of intermittent demand—that is, when demand is spasmodic with many periods experiencing zero demand (Section 2.1.2).
However, there are many influences on demand beyond the time-series history. While including such drivers in the forecasting system is achievable (see the next sub-section on our discussion on demand, market share models and marketing effects), in general companies seem to have chosen the route of modifying a basic smoothing forecast, using managerial judgement to take into account events likely to disturb baseline sales (Section 2.1.3).
The manufacturer (with fewer products) faces different problems from the retailer in that it usually has only indirect knowledge of the final market demand. The danger is that fluctuations in retail sales get amplified at the manufacturer's level, the so-called bullwhip effect (CitationLee et al, 1997a, Citation1997b). Accurate forecasts are therefore of benefit to both the retailer and the upstream manufacturers to ensure service levels and smooth supply chain operations. The consulting and software industry have developed an approach: ‘Collaborative Planning, Forecasting and Replenishment’ (CPFR) that aims to share information between parties, with a view to sharing benefits. Now academic research is trying to catch up, examining where the benefits might arise (Section 2.1.4).
2.1.1. Method selection and forecasting competitions
Early in OR's interest in forecasting, the practical question surfaced as to which of the different forecasting methods was best in practice. The conference organized by the Society's Forecasting Study Group (CitationBramson et al, 1972) witnessed a presentation by CitationReid (1972) on how to choose between different extrapolative forecasting methods. Like all subsequent competitions, it applied a variety of forecasting methods to a large number of data series and compared the resulting aggregate accuracy. This question has remained at the forefront of forecasting research because of both its practical and theoretical importance. It is practically important because organizations often have to face the fact that their current forecasting procedures are incurring too large errors (and too high costs). They also may have to replace their software for reasons such as the need to shift to a new enterprise-wide information and resource planning (ERP) system. They therefore have to benchmark their current forecasting accuracy, applied usually to many time series, when choosing a new method (embedded in new software). It is a theoretically important issue because researchers with a new method have often argued that their method ‘must’ outperform existing methods due to some favourable feature or other, for example neural nets because of the theorem that shows their capability of approximating any given function to any desired degree of accuracy. However, theoretical superiority (also demonstrated in the case of ARIMA versus Exponential Smoothing methods) is not always reflected in empirical accuracy. If the results are at variance with the theory then explanations must be sought.
The literature on these so-called forecasting competitions is voluminous and is summarized in CitationFildes and Ord (2002). While in CitationFildes (1979) it was possible to hope for an unequivocal best method of quantitative forecasting, the empirical results that have accumulated since then are diverse. However, certain patterns can be discerned as CitationFildes et al (1998) argue:
Simple model specifications will often outperform complex alternatives.
Damped trend smoothing is on average the most accurate extrapolative forecasting method over heterogeneous data (CitationMakridakis and Hibon, 2000).
More general methods will not typically outperform constrained alternatives.
Combining forecasts generally leads to improved accuracy.
Methods tailored to the specific characteristics of the time series under analysis will outperform benchmark methods (CitationFildes et al, 1998).
Causal methods, where available, will typically (but not inevitably) outperform extrapolative methods (CitationAllen and Fildes, 2001), and some causal methods are better than others.
When causal models are compared to extrapolative models, where the exogenous variables are predictable, the differences in accuracy can be large. CitationFildes et al (1997) demonstrate this in an examination of one-day-ahead forecasts of electricity and water demand, both of which depend on temperature. Generally causal models, including key drivers such as price promotion variables, are preferable to extrapolation (CitationBrodie et al, 2001). CitationAllen and Fildes (2001) present the consolidated evidence, but it should be noted that the benefits where the drivers have to be forecast are neither consistent nor overwhelming. In situations such as electricity load forecasting, there is a single key variable to be forecast and key drivers such as temperature and the television schedule are relatively predictable over short lead times. Here the benefits are clearer.
2.1.2. Intermittent demand
Intermittent demand appears at random with some time periods showing no demand at all. Demand, when it occurs, is often of a highly variable size and this introduces ‘lumpiness’. This pattern is characteristic of demand for service parts inventories, retail store sales and capital goods and is difficult to predict. Most work on intermittent demand forecasting is based on CitationCroston's (1972) influential ORQ article, which for many years was neglected but has seen more than 30 citations in the last 4 years. Croston showed the inappropriateness of using single exponential smoothing (SES) for intermittent demand and proposed forecasting such demands by estimating demand sizes (when demand occurs) and inter-demand intervals separately. Demand was assumed to occur as a Bernoulli process and his estimator is as follows: where pt′ is the exponentially smoothed inter-demand interval, updated only if demand occurs in period t−1 and zt′ is the exponentially smoothed (or moving average) size of demand, updated only if demand occurs in period t−1.
The method was claimed to be unbiased, however CitationSyntetos and Boylan (2001) undermined this conclusion. CitationSnyder et al (2002) and CitationShenstone and Hyndman (2005) have pointed out the inconsistency between Croston's model (that assumes stationarity) and his method (that relies upon SES estimates). More recently, CitationBoylan and Syntetos (2003), CitationSyntetos and Boylan (2005) and CitationShale et al (2006) presented correction factors to overcome the bias associated with Croston's approach.
Despite the theoretical superiority of Croston's method, only modest benefits have been recorded in the literature when it was compared with simpler forecasting techniques (CitationWillemain et al, 1994). (Standard accuracy measures such as MAPE are inadequate in this context because of the zero denominator, CitationSyntetos and Boylan, 2001.) Some empirical evidence has even suggested losses in performance (CitationSani and Kingsman, 1997). This led researchers to examine the conditions under which Croston's method performs better than SES, based on a classification scheme for the demand data (CitationSyntetos et al, 2005; CitationBoylan et al, 2006).
Croston's method and its variants (in conjunction with an appropriate distribution) have been reported to offer tangible benefits to stockists facing intermittent demand (CitationEaves and Kingsman, 2004; CitationSyntetos and Boylan, 2006). Nevertheless, there are certainly some restrictions regarding the degree of lumpiness that may be dealt with effectively by any parametric distribution. When SKUs exhibit considerable lumpiness, one could argue that only non-parametric approaches may provide opportunities for further improvements in this area. CitationWillemain et al (2004) developed a patented non-parametric forecasting method for intermittent demand data. The researchers claimed significant improvements in forecasting accuracy achieved by using their approach over SES and Croston's method, but CitationGardner and Koehler (2005) remain sceptical.
Service parts are typically characterized by intermittent demand patterns with direct relevance to maintenance management. In such a context, causal methods have also been shown to have a potentially important role (CitationGhobbar and Friend, 2002, Citation2003).
Research on intermittent demand has developed rapidly in recent years with new results implemented into software products because of their practical importance. The key issues remaining in this area relate to (i) the further development of robust operational definitions of intermittent demand for forecasting and stock control purposes and (ii) a better modelling of the underlying demand characteristics for the purpose of proposing more powerful estimators useful in stock control.
2.1.3. Events and the role of judgement
Most operational forecasting problems require forecasting of many data series at highly disaggregate SKU level. Whatever the position in the supply chain, the forecaster faces many market complexities. For example, a brewer's sales of a lager will be affected by the promotional activity of the retailers, the product's everyday price and competitor activity as well as uncontrollable aspects such as temperature, seasonality and events such as the World Cup. While, in principle, market models (see Section 2.2.2) could be developed to incorporate at least some of these factors, the typical approach is to use a simple extrapolative model to forecast the base line sales, which is then combined with expert market information to produce the final forecast.
In contrast to the small relative performance differences of extrapolative models, the adjusted forecasts can reduce forecast error substantially (down 10 percentage points from 40% MAPE). But they can also make matters worse (CitationFildes et al, 2008). The question therefore arises as to how this compound forecast of extrapolation and judgement can be improved. Essentially the expert judgements of market intelligence are mis-weighted, for example, they may suffer from optimism bias. To improve forecasting accuracy the statistical forecast and the judgemental adjustment need to be combined more effectively through a forecasting support system, which we discuss in Section 2.3.
2.1.4. Demand uncertainty in the supply chain: collaborative forecasting and the bullwhip effect
Much early OR in operations was concerned with developing optimal planning tools for manufacturing, such as lot sizing rules that took into account features of the manufacturing process to improve on the well-established EOQ. However, early research (eg CitationDe Bodt and Van Wassenhove, 1983) showed that what was optimal with perfect information was far from optimal in conditions of uncertainty. Despite the practical and theoretical importance of the finding, the incorporation of uncertainty into supply-chain planning has remained an area not much researched until 1999. In a Web of Science® search, five articles were found in 1998 rising to 101 in 2006. (The search used the keywords ‘(supply chain) AND (uncertainty OR forecast*)’.) One feature first identified by CitationForrester (1961) has received considerable attention recently: the amplification of retail demand variability up the supply chain. CitationLee et al (1997a, Citation1997b) describe the key reasons for this potentially costly effect: (i) the lack of information that the manufacturer has concerning consumer demand; (ii) production lead-times; (iii) batch ordering and trade allowances; and (iv) inadequacies in the manufacturer's forecasts. Essentially, the problem arises because the manufacturer's forecasting model of the retailer's orders is mis-specified. Even if downstream demand information available to the retailer is shared with the manufacturer, lead time effects amplify variance, but the availability of this demand data lessens the upstream demand variance, a result explained by CitationChen et al (2000) in an influential recent paper. However, the result is unsurprising. More information and shorter lead times lead to lower variance. More recent papers consider a variety of mathematical models of collaborative planning and forecasting arrangements: sharing inventory and demand information (CitationAviv, 2002), vendor managed inventories (CitationYu et al, 2002), and, by using simulation approach, an examination of the effects of forecasting model selection (CitationZhao et al, 2002).
The simplifications required to produce tractable mathematical models are not justifiable when contrasted with collaboration arrangements in practice (CitationSmaros, 2007). The advantage of using simulation is that the system can be modelled more realistically without the need for simplifying assumptions. It remains a challenge to those researching the area to provide sufficiently general conclusions, as it is clear that the quantitative results depend on experimental factors such as the cost structure, ordering rules and supply chain configuration, while the general results are largely obvious.
Why then does this area matter? First, the bullwhip effect is alive and damaging (CitationLee et al, 2000). Second, organizations regard forecasting accuracy as important to profitability and service, so they spend large sums of money on software to improve forecasting accuracy (often despite limited performance of the software, see Section 2.3). Estimating the value of improved forecasting accuracy is therefore an important element in the argument, and its value depends on the manufacturing or service configuration as well as the accuracy of the forecasting models, the demand patterns themselves and the decision rules employed. The notion of sharing information is theoretically attractive, as the research has shown, but the question of how valuable it is to share has not been adequately addressed. CitationLee et al (2000), CitationAviv (2001) and CitationZhao et al (2002) all report substantial savings (20% +) from information sharing. But the benefits reported depend upon the often implausible assumptions made regarding the supply chain structure, and lack any empirical foundation.
While information sharing as a response to bullwhip behaviour has been attracting more academic interest, its counterpart in practice, Collaborative Planning, Forecasting and Replenishment (CPFR), has also gained strength, attracting 255k Google hits (12/04/07). But CFPR remains the terrain of practitioners recommending its benefits with no observable relationship to its theoretical counterpart in the research literature. The case-based benefits found by CitationSmaros (2007), while positive, are much more nebulous and her survey of other research failed to establish any firm positive evidence. There is therefore an opportunity for a combination of case-based research building on Smaros’ limited study and methodological advances focussed on answering the practical question of what circumstances and what form of collaboration it is worthwhile pursuing.
2.2. Marketing applications
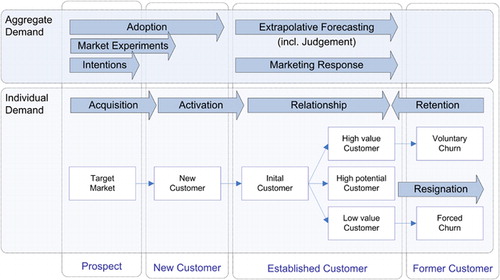
The last 25 years have seen a substantial growth in company databases of customer demand. At the same time there has been considerable growth in marketing activity, both in the number of new products and services launched, and in promotional activity. The associated forecasting problems are many (see CitationArmstrong et al (1987) for an overview) and include market response models for aggregate brand sales, market share and competitive behaviour such as competitor pricing. In addition, interest in predictive models of individual behaviour has increased rapidly. relates the prediction of aggregate demand in adoption, marketing response modelling, and extrapolative forecasting to the prediction of individual customer demand: from customer acquisition and activation towards the active management of the customer relationship with the organization, including the retention of profitable and removal of non-profitable customers. All activities along an individual customer's lifecycle are summarized as Customer Relationship Management (CRM).
Figure 1 Illustration of individual and aggregate demand prediction in a customer lifecycle, based on CitationBerry and Linenoff (2004) and CitationOlafsson et al (2008).
Applications focus on models of demand at different levels of aggregation, for different types of products in different stages of the life cycle. These problems have generated considerable research aimed at producing better forecasts, and, from within the OR community, Marketing Science has served as the predominant publications outlet. There are two distinct problem areas: first, new product (or service) models, discussed in Section 2.2.1 where there is little data, though market experiments or consumer trial data may be available. This has been an active research area since Bass's original article in Management Science (1969) on new product adoption patterns, and early work on choice (conjoint) models of individual consumer behaviour (CitationGreen et al, 2001) based on intentions survey data.
The second problem area (Section 2.2.2) is where there is an established market with substantial data available, even down to data on individual consumer behaviour. Aggregate econometric models of sales response down to store-level product sales are discussed in CitationHanssens et al (2001). When disaggregate data on individual consumer decisions and new computer-intensive techniques of data mining are available, another set of marketing problems becomes amenable to model building and to which the OR community has contributed: CRM, in particular how to identify, attract, exploit and retain profitable (potential) consumers (Section 2.2.3). As and show, the evaluation and application of these methods has generated considerable research interest.
2.2.1. New-product models
It is a cliché of marketing that most new products fail. This suggests the high value to researching the development and evaluation of new-product forecasting models. Such models would depend on the nature of the product and its purchasers (industrial or consumer, purchase frequency, etc). But the academic research is limited and there is no evidence of model-based approaches being widely adopted. Instead, a common approach by experts is the use of analogies, where sales of a similar product are used informally to estimate period-by-period sales and final penetration levels (CitationThomas, 2006). Alternatively, intention surveys of potential customers can be used when no directly relevant data history is available. Choice models, based on intentions, are now used extensively to forecast first purchase sales of new products. Such intentions can be assessed through the use of simulated purchase environments to give a more realistic representation of the environment a consumer faces; see for example CitationUrban et al (1990). (These simulated purchase environments are often web-based.) However, we omit a fuller discussion of these models because, as CitationWittink and Bergestuen (2001) point out, they are seldom validated within a forecasting context, despite this being their ultimate purpose.
Diffusion models
Diffusion models apply to the adoption of a new, often high-technology, infrequently purchased product where repeat sales are not (initially) important. CitationBass (1969) developed one of OR's most successful forecasting methods when he proposed what has become known as the Bass model of new product adoption.
If N(t) is the total number being adopted by period t (individuals or units), then where p and q are the diffusion parameters determining the speed and shape of what turns out to be an S-shaped adoption curve and M is the market potential, that is, N(t)→M as t→∞.
The solution to this differential equation is a logistic model, which, once estimated, can be used to forecast the adoption path of the product, service or new technology. Many univariate alternatives (summarized in CitationMeade and Islam, 2006) have been proposed, including the Gompertz curve (which has the same S-shaped form as the logistic), as well as CitationHarvey's (1984) and CitationMeade's (1985) contributions in JORS, all of which have shown comparative empirical success. But there is apparently no best function and again, combining may be the best approach (CitationMeade and Islam, 1998). CitationShore and Benson-Karhi (2007) are more optimistic that selection can be productive. They propose a general modelling approach in which many of the standard S-shaped curves are embedded. Using an extended data set from CitationMeade and Islam (1998), they show that their new method generally produces more accurate forecasts.
The popular Bass model of this phenomenon has underlying it the notion of a consumer influenced by others with direct experience of the product. This early characterization of the market has stimulated many novel models, applicable to different problem areas including new movie attendance (CitationSawhney and Eliashberg, 1996; CitationNeelamegham and Chintagunta, 1999).
Models have also been developed to better capture the complexities of the market place. These may disaggregate to individual adopters, segment the total market, and include marketing and exogenous variables. They can also be extended to include competing replacement technologies. Current research has focussed on attempts to estimate the market potential.
A problem hidden in the early formulation of the first adoption models is how to estimate the parameters. Estimation with larger data sets is via maximum likelihood or non-linear least squares (NLS). The influential Marketing Science paper of CitationVan den Bulte and Lilien (1997) established bias in the parameter estimates and concluded that an accurate estimate of the diffusion path and ‘ultimate market size … is asking too much of the data’. CitationMeade and Islam (2006) seem to concur. Since these models are usually designed to forecast the early stages of the life cycle, only limited data are available (a feature ignored in much of the research). Methods include using estimates based on analogous (already established) products, and the meta-analysis by CitationSultan et al (1990), who examine 213 applications, provides useful material. CitationLilien and Rangaswamy's book (2004) offers a database and software.
The empirical evidence of the effectiveness of these models, particularly their ability to include marketing variables, is weak. Nevertheless, they are used in practice, for example in telecoms markets (CitationFildes, 2002), not least because of their face validity. OR has made the major contributions in the area, from the early Bass publication to the latest attempts to integrate information across products and countries (CitationTalukdar et al, 2002). However, it is only in the most recent research led by Islam and Meade that there has been a clear focus on the practice-based problems facing those who wish to forecast the diffusion of new products or technologies. Overall, the research lacks a clearly articulated perspective on how these models are to be used. Outstanding issues include evidence on their ex ante validation to show their practical effectiveness, in particular of market potential estimates and models including marketing instruments.
Test market models
For consumer packaged goods where both first purchase and repeat purchase affect success, test market models have been developed by CitationFader and Hardie (2001). They are similar in form to the diffusion models in that there is an underlying model of the probability of the consumer waiting t weeks before first purchasing the product.
A test-market model attempts to use the data generated by the limited regional launch of a product to decide whether to fully launch the product, to redesign aspects of it, or to stop further development. While the evidence on comparative accuracy is slight, CitationFader and Hardie's (2001) work is noticeable for its attention to forecasting accuracy applied to the particular problem marketers face when launching a new packaged product. They have shown such models to be effective, and accuracy is usually improved by including the marketing variables.
2.2.2. Demand, market share models and marketing effects
At the operational level of short-term forecasts by SKU, the forecasting system is usually a combination of simple statistical models overlaid with judgement (as we have described). However, the growth of Electronic Point of Sales (EPOS) data from retailers has encouraged the development of the new field of marketing analytics, which includes decision support systems to provide recommendations on selecting marketing instruments such as price and promotional price, as well as the corresponding forecasts. While some early work was published in general OR journals, influential research in the area has been published primarily in the marketing journals. Although the last few years have seen several publications in the area, notably CitationHanssens et al (2001), researchers have not in the main responded to its practical importance. The basic tool used in developing these models is the causal linear and non-linear regression models. CitationHanssens et al (2001) describe both the models and the econometrics needed to estimate the relationship, as well as the empirical evidence on aspects of marketing decision making. The basic model is of the form: where i is the ith brand (or SKU) in a category of closely related products, j is the jth store, and t is the time.
The dependent variable may be sales or market share and there is potentially a large number of explanatory variables. When lags are included, this leads to complex models, particularly at SKU-store level with competition between similar SKUs (eg 6 packs versus 12 packs). If successfully estimated, such models deliver forecasts, price and cross-price elasticities, and the problem then becomes one of developing optimal pricing and price-promotion campaigns through a ‘marketing management support system’. CitationDivakar et al (2005) provided a recent example of the soft drinks market aimed at producing ‘accurate forecasts’ and ‘diagnostics for price and promotion planning’ at product level for different distribution channels. In addition, the model-based approach was seen as overcoming the drink manufacturer's problem prior to the modelling exercise, of multiple inconsistent forecasts generated by different users. The retail forecasts from scanner data were then transformed into a wholesale forecast by a weighted average of current and next week's predicted sales. Price, competitive price, feature, display and temperature all proved significant.
Issues addressed in recent research are the level of aggregation across SKUs, stores and time, with current research focussing on more disaggregate models. With the increased parameterization comes additional complexity (eg heterogeneity across stores), so more advanced econometric techniques have been developed to provide convincing estimates, including Bayesian methods (CitationRossi and Allenby, 2003). In CitationDivakar et al (2005), however, OLS produced the most accurate forecasts when compared to Bayesian estimates and a simultaneous system model of the two market leaders, Pepsi and Coke.
Forecasting promotional effects is the focus of much interest for both retailers and manufacturers, with promotional prices elasticity estimates of 10+ for some BOGOFs (buy-one-get-one-free), for example in lager. Promotional effects depend on the retail details, including individual store influences. A standard approach for those firms that have developed the required data base is to attempt to identify the ‘last like promotion’ in the historical database and then ‘allocate proportionately to each store’ (CitationCooper et al, 1999). A model-based alternative is to estimate baseline sales (using exponential smoothing or similar) on non-promoted data. This leads to a two-stage forecasting model, which first extrapolates the baseline sales and then adjusts for future promotions. This same approach has been applied to temperature effects. Since promotions are often regarded as unique, judgmental market adjustments may then be superimposed on the model-based forecasts. CitationCooper et al (1999) argued that such an approach was less satisfactory than modelling the promotion histories themselves, again with a regression model that included all the features of the promotion in the retail setting.
The evidence is mixed as to the adoption of these ideas, with few studies that demonstrate the impact on the firm (CitationWierenga et al, 1999). CitationBucklin and Gupta (1999) paint a more optimistic picture, based on interviews with a small number of US marketing executives interested in packaged goods. As far as these executives were concerned, key features such as their own-price elasticities were easily estimated and available to them in their companies, with stable results obtainable when OLS (rather than more advanced methods) was applied to equations such as that above. CitationBemmaor and Franses (2005) disagree, arguing that marketing executives see models such as the sales-response model above as a ‘black box’. CitationMontgomery (2005) summarized the retail evidence as the ‘market is ready … although widespread adoption has not happened yet’. However, the software market continues to develop, for example with SAP including an optimal pricing module. Our own impressionistic evidence from company-based projects in the UK is that certain companies at certain times have a far-sighted manager who supports the development of a support system to aid in forecasting, pricing and promotion evaluation. CitationDivakar et al (2005) make the same point from their Pepsi perspective. But such innovations only gain a temporary hold, and are undermined once the executive moves on or the firm is reorganized. For example, CitationCooper et al (1999) in a personal communication in 2006 commented that the company that developed his promotion forecasting method went out of business and the system was dropped.
For consumer goods the data are now available and the software is in place to develop causal market response models. Adoption in companies remains limited by a lack of company expertise and missing champions to sponsor the innovation. Evidence of improved accuracy is lacking and the link between the operational-disaggregate SKU forecasts of the previous section and the corresponding market response forecasts has not been explored. For both manufacturers and retailers, there remains a need for simple operational models that include key marketing instruments and that are downwardly compatible in the product hierarchy (from category to brand to SKU). While the intellectual framework has been effectively laid down (as the references above show), the practical questions examining the benefits in terms of forecast accuracy and price promotion planning and the level of complexity valuable in modelling the problem remain under-researched.
2.2.3. Customer relationship management and data mining
While in the last section, we discussed the contribution made to forecasting aggregate market demand, forecasting methods drawing on both standard statistical and the newer data mining approaches have been used to make disaggregate forecasts of individual units, be they consumers, households or firms. The rapid expansion of data storage and computational capacity has enabled the collection of large customer-centric, cross-sectional databases. On an aggregate level, these databases facilitate decision support through established market-response models for forecasting. On the level of individual customer transactions, the size of the data sets, the number and the heterogeneous scaling of attributes have made the analysis using conventional statistical methods impractical or even infeasible because of computer constraints. In this context, DM applies statistical and machine learning algorithms for discovering valid, novel and potentially useful predictive information from large data sets in unstructured problems (CitationFayyad et al, 1996).
Despite the fact that applications are primarily based on multivariate, cross-sectional data, they may also constitute forecasting problems, if the definition of the dependent variable includes activities over the forecast horizon (eg to forecast the likelihood of the future default of new credit applicants within the first 12 months). Where the models are to be applied over a period of years, changing personal, economic and behavioural circumstances of the consumer are potentially important, for example in forecasting the likelihood of customer attrition by switching suppliers where recent behaviour is important. This will require either a periodic re-estimation of the static model or incorporating changing circumstances through explanatory economic indicators that capture populations with drift (CitationThomas, 2000). Hence these cross-sectional methods complement existing forecasting applications and extend predictive applications to an individual customer level. (They can then be aggregated up to give population predictions that incorporate the changing exogenous variables.)
Within CRM and credit risk, models have been developed that examine the acquisition, the management of the ongoing relationship with and the retention of profitable customers. The understanding that acquiring new customers is more costly than exploiting and retaining existing ones—embodied in the concept of estimating customer lifetime value (LTV)—is reflected in the focus of OR publications on applications that increase the value of established customers through analytical CRM and direct marketing. CitationOnn and Mercer (1998) estimate the expected LTV of customers in order to determine direct marketing activities, while CitationRosset et al (2003) estimate the effect of marketing activities on the LTV itself.
Given the abundance of data on existing customers (in contrast to new ones) numerous applications focus on enhancing the predictive classification accuracy of class membership in conventional cross-selling and up-selling tasks of additional products to existing customers. CitationCrone et al (2006) evaluate various classifiers for cross-selling through optimized direct mailings. In addition to conventional classification tasks, newer publications extend data mining methods towards dynamic decision-making, for example predicting the change in spending potential of newly acquired customers from the changing purchase information (CitationBaesens et al, 2004) and the effects of direct marketing activity based upon observations of sequential purchases (CitationKaefer et al, 2005).
In customer retention, the prediction of customer churn or attrition of profitable customers has received most attention, in the insurance (CitationSmith et al, 2000), financial (CitationVan den Poel and Lariviere, 2004) and retail industries (CitationBuckinx and van den Poel, 2005). There have been fewer studies on applications in earlier phases of the customer lifecycle, which predict the future response of new prospects to marketing activities in order to facilitate customer targeting. In an often cited study, CitationBult and Wansbeek (1995) take a statistical model-based approach, while more recently CitationKim et al (2005) use neural networks.
Surprisingly few publications in OR have attempted to review how DM could effectively be applied in various applications in order to facilitate a knowledge transfer into the OR domain. CitationBose and Mahapatra (2001) provide a review of DM applications in business, and CitationShaw et al (2001) in marketing. The OR community has primarily concentrated on applications to credit risk, for example the special issue of JORS (CitationCrook et al, 2001) is particularly related to consumers. Other areas of application with similar characteristics include bankruptcy prediction (see the highly cited papers by CitationSalchenberger et al, 1992; CitationTam and Kiang, 1992, and more recently, CitationZhang et al, 1999).
The typical modelling exercise takes an eclectic approach to specifying the features to include in the model, thereby including a wide range of variables, which may be irrelevant or provide duplicate measures. The target variable is most often binary (eg will an applicant repay or not?/a customer reply or not?). While step-wise regression was once the industry standard method, the models will typically now include possibly non-linear effects (eg age on credit-worthiness). If linear methods are to be used, non-linearities can be approximated by breaking down the variable in question using dummy variable categories. Alternative modelling methods include statistical approaches such as discriminant analysis and logit (now perhaps the most popular approach), and, increasingly, computational-intensive approaches such as neural networks and support vector machines, linear programming and expert systems. A good review of alternatives is given in CitationThomas et al (2002).
Comparisons between the different methods have been carried out for a limited range of applications, so while individual case studies sometimes demonstrate that one method or another provides substantial benefits, the findings are not robust with regard either to the sample size or to the number of explanatory variables included in the modelling. However, for many applications, seemingly different modelling approaches from basic step-wise regression to neural nets and support vector machines deliver similar results, apparently due to the flat likelihood effect (CitationLovie and Lovie, 1986). When CitationBaesens et al (2003) examined eight data sets and a variety of methods, they found little overall difference, although neural nets and support vector machines won out. But there is little difference from the long established logistic regression and linear discriminant analysis. However, small improvements may be valuable in particular applications.
Despite the growing number of OR publications on applications, their scope remains limited (in contrast to publications on DM methods). Perhaps because of lack of access to realistically sized databases, perhaps due to the limited scalability of methods and experimental design, or perhaps because the issue was not thought important, few studies have examined the benefits of procedures and methods across a wide range of data sets (despite established best practices in forecasting on how methods should be compared). CitationCrone et al (2006) review publications in business DM and find a strong emphasis on evaluating and tuning multiple classification algorithms on a single data set, CitationBaesens et al (2003) being an exception. The computational effort in comparing methods across multiple empirical data sets is certainly substantial, consequently many authors use the same ‘toy data sets’ from public repositories (such as the UCI Machine Learning Repository), which include too few observations and too few variables compared to those found in practice. Statistical results depend on sample size and the dimensionality of the data set while the organizational benefits are likely to be affected by the field of application. As in forecasting, the limitations of method evaluations on toy-datasets to derive best practices have been identified within DM (CitationKeogh and Kasetty, 2003), with an increasing emphasis on ‘meta-learning’ (CitationSmith-Miles, 2008). The particular challenges for OR researchers are to incorporate the problem area characteristics into the search for model-based solutions and analyse the conditions under which they perform well, rather than focus on marginal improvements and hybridization of ‘novel’ DM methods.
2.3. The role of computer and IS developments
2.3.1. IT, IS and forecasting support systems
The earlier review paper (CitationFildes, 1979) expected major developments in computer package design—the critical limiting factor at the time. The IT revolution has apparently impacted on aspects of forecasting, although Makridakis, one of the field's founders, still regards it as having the greatest potential for future breakthroughs (CitationFildes and Nikolopoulos, 2006). The synergy between the two fields has seen developments described both in the sections on marketing and CRM, and in particular in enabling the development of computer-intensive methods. However, innovations in computer platforms can now be tailored to specific algorithms, and electrical circuits and computer hardware can be redesigned to solve certain mathematical problems faster. The potential effect is to remove the computational constraint.
Computer-intensive operations and market forecasting are needed in real time. Casual observation supports the idea that algorithms which are more demanding of data and computation are rarely considered in practice, because of the processing needs when applying them to a large number of products, perhaps daily within a limited time window. Thus computationally intensive methods such as support vector machines and even neural networks have seen as yet only limited application in practice. Some multivariate applications are likewise constrained, although the demands are equally likely to arise from the data requirements. Real-time data acquisition and processing in areas as diverse as stock-price trading, electricity load forecasting (CitationHippert et al, 2001), weather forecasting or water resource management do, however, use computer power intensively in their forecasting and could be applied more widely.
What has been achieved through greater computer power is the evaluation through forecasting competitions of a wide range of forecasting methods, including computer-intensive methods. A search of the OR journals reveals several studies comparing neural networks with other methods. The majority of studies involve the development of computer intensive methods able to model and forecast a single time series. However, there are only a small number of studies where computing power has been used to tackle large problems, either on cross-sectional data (with applications in CRM, see previous section) or in time series (eg, CitationLiao and Fildes (2005), who examined various specifications of ANN compared to benchmarks, and CitationTerasvirta et al (2005), who compared ANN with non-linear statistical models). But such papers present offline analyses that have yet to find their way into practice. Within the OR/MS literature surveyed here, there are no studies that have examined the use of computing power to solve or re-specify organizational forecasting problems. For example, real-time data on road traffic could be used to forecast arrival times and revise delivery schedules. Instead there is a continuing reliance on ad hoc solutions to overcome outdated perceptions of computer constraints, for example a damaging failure to select optimal smoothing parameters in operations (CitationFildes et al, 1998) or a limitation to using only 3 years of the total data available for forecasting.
2.3.2. Forecasting support systems
In many areas of forecasting, organizational forecasting routines are embedded in a broader information system or enterprise resources planning system (ERP), with recent extensions to advanced planning systems (APS) for production and distribution. Such systems usually include only basic forecasting functions. There is therefore an incentive to research effective developments in software systems aimed to support the forecasting function, the so-called forecasting support systems (FSS) and its integration into ERPs. As we noted in Section 2.1.3 the complexity of many organizations’ forecasting activities compels forecasters to develop heuristics in order to combine model-based forecasts with managerial judgement. However, despite the apparent interest of the journal Decision Support Systems, this field is under-researched with little effort focussed on the specific problems of forecasting systems (CitationFildes et al, 2006). Although many commercial systems have been developed in the last 20 years, no normative specifications for such software have been established. An evaluation of some current software products, based on Armstrong's framework of 139 forecasting principles, highlighted that only 20% of the suggested features were included in currently available forecasting software, with no single program including all 20% (CitationArmstrong, 2001b, CitationTashman and Hoover, 2001). While research-based software embodies the latest econometric ideas, commercial FSSs have atrophied, with even such benchmark methods as damped trend excluded from most systems. A current survey of forecasting software and limitations is given by CitationKüsters et al (2006) which is quite damning in its conclusions. The practical implications are important for the OR practitioner, demonstrating a need to ensure the organization's software is benchmarked against best practice. For some software we examined (CitationFildes et al, 2008) the statistical forecasts available in the company FSS proved worse than a naïve random walk!
In most operational applications, the (usually inadequate) statistical forecasts are combined with judgement (CitationFildes and Goodwin, 2007). The theme of how when and how such combinations are best carried out has been a theme of two of the most highly cited articles (CitationLawrence et al, 1986; CitationBunn and Wright, 1991) and yet software is not designed with this task in mind (CitationFildes et al, 2006). Various ideas on how complex causal factors interpreted in an organizational setting can be integrated into the FSS are being explored (see CitationLee et al, 2007) but they have yet to be implemented into commercial software. Thus, the question of how to design FSSs to improve forecast accuracy and how to overcome the barriers to successful implementation are critical to affecting change in organizations.
3. Conclusion: what is OR's contribution to forecasting?
Over the last 25 years, OR has continued to contribute to forecasting research and forecasting practice, despite the increasing prominence of the specialist forecasting journals. It has been most effective when the forecasting methods proposed have been closely linked to the area of application. In this survey of where research has been most influential, three areas have proved fertile to new ideas: intermittent demand, sales response modelling and computer-intensive methods applied to direct marketing and credit risk appraisal. All closely mirror practical problems the organizations face and have therefore seen some success in implementation. A fourth topic, the bullwhip effect and the benefits of information sharing, has provided a valuable opportunity to academic modellers, but its results so far have had no spin-off for forecasters, either academics or practitioners, in part because few of the researchers show any signs of having spent any time in field work.
Better models of intermittent demand and sales response have gained some implementation through improved software products. In credit risk and direct-marketing applications, while many new methods have been proposed, there is little consensus as to how best to model a given data set. Here the research has been limited by the lack of availability of realistically large data sets and most researchers have contented themselves with overly limited ‘competitions’ between methods. In contrast to the time-series competitions, the robustness of the research conclusions over a variety of data sets has not been established, making practical progress slow. But new small improvements in the models can result in substantial profit gains so there is strong corporate motivation to experiment.
Practitioners continue to believe forecasting accuracy is important to their organizations (CitationFildes and Goodwin, 2007). Research into forecasting practice has convincingly demonstrated that forecasting support systems that combine statistical or econometric models with expert judgement offer the best route forward to achieve major improvements in accuracy. But the OR literature has little to say about how such systems and organizational processes should be designed and implemented. It remains the case that many companies continue to operate archaic implementations of exponential smoothing. Thus, the discrepancy between espoused beliefs in the benefits of improved forecasting and organizational behaviour offers another research opportunity with the potential to improve performance.
The bright new dawn of the early 1980s, when there seemed to be some prospect for identifying a ‘best’ forecasting method, has led to a rather more mundane present, where each model-based gain is hard won. The major research opportunities for forecasting and OR will arise in models linking novel sources of information (such as is generated through a EPOS data or a collaborative forecasting relationship). While it is a presumptuous claim that no statistical innovations are likely to produce any major improvements in accuracy, the evidence from the last 25 years supports this. Even such Nobel prize-winning innovations as cointegration modelling and ARCH have not led to major pay-offs. This suggests that forecast model building is most likely to be successful when it is viewed in a wider system context, where constraints (such as service availability in call centre forecasting), interactions (between supplier and retailer) and market plans (between account manager, retailer and manufacturer) all affect the final forecast. As a consequence of adopting a wider system approach, forecasting performance should not only be assessed by standard error measures but linked to organizational performance measures. For example, instead of modelling credit default the focus can be shifted to combined decision and forecasting models to maximize profitability (CitationFinlay, 2008). Similarly, when forecasting for operations, the effect of error on customer service levels and stock holdings is affected by the MRP system in place. This has recently gained increased attention from a production planning perspective where what is optimal in one situation is far from optimal in another but the forecasting consequences of analysing the combined system remain neglected.
The final research area we highlight is that of model selection. As we have argued, there is considerable scope for improvements in demand forecasting based on the development of appropriate demand classifications rules/method selection protocols. In this case, the ‘horses for courses’ approach could lead to significant operational benefits; it is interesting indeed that this area has not attracted much attention despite Reid introducing this question to the Society in 1971.
In short, there remain major research opportunities in forecasting though they require a shift in perspective away from traditional statistical analysis. For the practitioner, there is still much to be gained by adopting ‘best practice’ though the barriers to implementation remain substantial.
References
- AllenPGFildesREconometric forecastingPrinciples of Forecasting2001303362
- AllenPGFildesRLevels, differences and ECMs—Principles for improved econometric forecastingOxford Bull Econ Statist20056788190410.1111/j.1468-0084.2005.00144.x
- ArmstrongJSJudgmental bootstrapping: Inferring experts' rules for forecastingPrinciples of Forecasting: A Handbook for Researchers and Practitioners2001
- ArmstrongJSStandards and practices for forecastingPrinciples of Forecasting: A Handbook for Researchers and Practitioners2001679732
- ArmstrongJSCollopyFError measures for generalizing about forecasting methods—Empirical comparisonsInt J Forecasting19928698010.1016/0169-2070(92)90008-W
- ArmstrongJSCollopyFCausal forces—Structuring knowledge for time-series extrapolationJ Forecasting199312210311510.1002/for.3980120205
- ArmstrongJSBrodieRJMcIntyreSHForecasting methods for marketing—Review of empirical researchInt J Forecasting1987335537610.1016/0169-2070(87)90029-X
- AvivYThe effect of collaborative forecasting on supply chain performanceMngt Sci2001471326134310.1287/mnsc.47.10.1326.10260
- AvivYGaining benefits from joint forecasting and replenishment processes: The case of auto-correlated demandManufa Service Opns Mngt20024557410.1287/msom.4.1.55.285
- BaesensBVan GestelTViaeneSStepanovaMSuykensJVanthienenJBenchmarking state-of-the-art classification algorithms for credit scoringJ Opl Res Soc20035462763510.1057/palgrave.jors.2601545
- BaesensBVerstraetenGVan den PoelDEgmont-PetersenMVan KenhovePVanthienenJBayesian network classifiers for identifying the slope of the customer lifecycle of long-life customersEur J Opl Res200415650852310.1016/S0377-2217(03)00043-2
- BassFMA new product growth model for consumer durablesMngt Sci19691521522710.1287/mnsc.15.5.215
- BatesJMGrangerCWJCombination of forecastsOpl Res Quart196920445146810.1057/jors.1969.103
- BeerSPlatform for Change1975
- BemmaorACFransesPHThe diffusion of marketing science in the practitioners' community: Opening the black boxAppl Stochastic Models Buss Indust2005214–528930110.1002/asmb.553
- BerryMJRLinoffGSData Mining Techniques for Marketing, Sales and Customer Support2004
- BlattbergRCHochSJDatabase models and managerial intuition—50 percent model + 50 percent managerMngt Sci19903688789910.1287/mnsc.36.8.887
- BordleyRFThe combination of forecasts—A Bayesian approachJ Opl Res Soc19823317117410.1057/jors.1982.29
- BoseIMahapatraRKBusiness data mining—A machine learning perspectiveInform Manage-Amster20013921122510.1016/S0378-7206(01)00091-X
- Boser BE, Guyon IM and Vapnik V (1992). A training algorithm for optimal margin classifiers.Paper presented at the 5th Annual ACM Workshop on COLT, Pittsburgh, PA.
- BoxGEPJenkinsGMReinselGCTime Series Analysis: Forecasting & Control1994
- Boylan JE and Syntetos AA (2003). Intermittent demand forecasting: Size-interval methods based on average and smoothing. Proceedings of the International Conference on Quantitative Methods in Industry and Commerce, Athens, Greece.
- Boylan JE, Syntetos AA and Karakostas GC (2006). Classification for forecasting and stock-control: A case-study. J Opl Res Soc, advance online publication, 18 October 2006, doi: 10.1057/palgrave.jors.2602312.
- Bramson MJ, Helps IG and Watson-Gandy JACC (eds). (1972). Forecasting in action. Operational Research Society and Society for Long Range Planning.
- BreimanLClassification and Regression Trees1984
- BreimanLBagging predictorsMach Learn199624123140
- BreimanLStatistical modeling: The two culturesStatist Sci20011619921510.1214/ss/1009213726
- BreimanLRandom forestsMach Learn20014553210.1023/A:1010933404324
- BrodieRDanaherPJKumarVLeeflangPSHEconometric models for forecasting market sharePrinciples of Forecasting: A Handbook for Researchers and Practitioners2001
- BrownRGSmoothing Forecasting and Prediction of Discrete Time Series1963
- BrysonNJosephAOptimal techniques for class-dependent attribute discretizationJ Opl Res Soc2001521130114310.1057/palgrave.jors.2601174
- BuckinxWvan den PoelDCustomer base analysis: Partial defection of behaviourally loyal clients in a non-contractual FMCG retail settingEur J Opl Res200516425226810.1016/j.ejor.2003.12.010
- BucklinREGuptaSCommercial use of UPC scanner data: Industry and academic perspectivesMarket Sci199918324727310.1287/mksc.18.3.247
- BultJRWansbeekTOptimal selection for direct mailMarket Sci19951437839410.1287/mksc.14.4.378
- BunnDWSeigalJPForecasting the effects of television programming upon electricity loadsJ Opl Res Soc1983341172510.1057/jors.1983.3
- BunnDWVassilopoulosAIComparison of seasonal estimation methods in multi-item short-term forecastingInt J Forecasting19991543144310.1016/S0169-2070(99)00005-9
- BunnDWWrightGInteraction of judgmental and statistical forecasting methods—issues and analysisMngt Sci199137550151810.1287/mnsc.37.5.501
- CachonGPLariviereMAContracting to assure supply: How to share demand forecasts in a supply chainMngt Sci200147562964610.1287/mnsc.47.5.629.10486
- Campos J, Ericsson NR and Hendry DF . (2005). General-to-specific modeling: An overview and selected bibliography (No. 838). Board of Governors of the Federal Reserve System.
- ChatfieldCModel uncertainty, data mining and statistical inferenceJ R Stat Soc Ser A—Stat Soc199515841946610.2307/2983440
- ChatfieldCPrediction intervals for time-series forecastingPrinciples of Forecasting2001
- ChawlaNVBowyerKWHallLOKegelmeyerWPSMOTE: Synthetic minority over-sampling techniqueJ Artif Intell Res200216321357
- ChenFDreznerZRyanJKSimchi-LeviDQuantifying the bullwhip effect in a simple supply chain: The impact of forecasting, lead times, and informationMngt Sci20004643644310.1287/mnsc.46.3.436.12069
- ChenHBoylanJEUse of individual and group seasonal indices in subaggregate demand forecastingJ Opl Res Soc200758121660167110.1057/palgrave.jors.2602310
- ChenMSHanJWYuPSData mining: An overview from a database perspectiveIEEE Trans Knowl Data Eng1996886688310.1109/69.553155
- ClementsMPHendryDFForecasting Economic Time Series1998
- ClementsMPTaylorNBootstrapping prediction intervals for autoregressive modelsInt J Forecasting20011724726710.1016/S0169-2070(00)00079-0
- CohnDAtlasLLadnerRImproving generalization with active learningMach Learn1994152201221
- CohnDGhahramaniZJordanMIActive learning with statistical modelsJ Artif Intell Res19964129145
- CollopyFArmstrongJSRule-based forecasting—Development and validation of an expert systems—approach to combining time-series extrapolationsMngt Sci199238101394141410.1287/mnsc.38.10.1394
- CooperLGBaronPLevyWSwisherMGogosPPromoCast (TM): A new forecasting method for promotion planningMarket Sci19991830131610.1287/mksc.18.3.301
- CroneSFLessmannSStahlbockRThe impact of preprocessing on data mining: An evaluation of classifier sensitivity in direct marketingEur J Opl Res200617378180010.1016/j.ejor.2005.07.023
- CrookJNEdelmanDBThomasLCSpecial issue: Credit scoring and data mining—Editorial overviewJ Opl Res Soc20015297297310.1057/palgrave.jors.2601234
- CrostonJDForecasting and stock control for intermittent demandOpl Res Quart19722328930310.1057/jors.1972.50
- De BodtMAVan WassenhoveLCost increases due to demand uncertainty in MRP lot sizingDecis Sci19831434536110.1111/j.1540-5915.1983.tb00190.x
- DebuseJCWRayward-SmithVJDiscretisation of continuous commercial database features for a simulated annealing data mining algorithmAppl Intell19991128529510.1023/A:1008339026836
- De GooijerJGHyndmanRJ25 years of time series forecastingInt J Forecasting20062244347310.1016/j.ijforecast.2006.01.001
- DekkerMvan DonselaarKOuwehandPHow to use aggregation and combined forecasting to improve seasonal demand forecastsInt J Product Econ20049015116710.1016/j.ijpe.2004.02.004
- DieboldFXElements of Forecasting2006
- DivakarSRatchfordBTShankarVCHAN4CAST: A multichannel, multiregion sales forecasting model and decision support system for consumer packaged goodsMarket Sci20052433435010.1287/mksc.1050.0135
- EavesAHCKingsmanBGForecasting for the ordering and stock-holding of spare partsJ Opl Res Soc20045543143710.1057/palgrave.jors.2601697
- EngleRFAutoregressive conditional heteroscedasticity with estimates of the variance of United-Kingdom inflationEconometrica198250987100710.2307/1912773
- EngleRFGrangerCWJCointegration and error correction—Representation, estimation and testingEconometrica19875525127610.2307/1913236
- FaderPSHardieBGSForecasting trial sales of new consumer packaged goodsPrinciples of Forecasting: A Handbook for Researchers and Practitioners2001
- FayyadUPiatetsky-ShapiroGSmythPFrom data mining to knowledge discovery in databasesAI Mag1996173754
- FildesRQuantitative forecasting—The state of the art: Extrapolative modelsJ Opl Res Soc197930691710
- FildesRQuantitative forecasting—The state of the art: Econometric modelsJ Opl Res Soc198536549580
- FildesREvaluation of aggregate and individual forecast method selection-rulesMngt Sci1989351056106510.1287/mnsc.35.9.1056
- FildesRThe evaluation of extrapolative forecasting methodsInt J Forecasting19928819810.1016/0169-2070(92)90009-X
- FildesRBeyond forecasting competitionsInt J Forecasting2001174556560
- FildesRTelecommunications demand forecasting—A reviewInt J Forecasting20021848952210.1016/S0169-2070(02)00064-X
- FildesRThe forecasting journals and their contribution to forecasting research: Citation analysis and expert opinionInt J Forecasting20062241543210.1016/j.ijforecast.2006.03.002
- FildesRGoodwinPAgainst your better judgment? How organizations can improve their use of management judgment in forecastingInterfaces20073757057610.1287/inte.1070.0309
- FildesRMakridakisSThe impact of empirical accuracy studies on time-series analysis and forecastingInt Statist Rev19956328930810.2307/1403481
- FildesRNikolopoulosKSpyros Makridakis: An interview with the International Journal of ForecastingInt J Forecasting20062262563610.1016/j.ijforecast.2006.04.008
- FildesROrdJKForecasting competitions: Their role in improving forecasting practice and researchA Companion to Economic Forecasting2002
- FildesRRandallAStubbsPOne day ahead demand forecasting in the utility industries: Two case studiesJ Opl Res Soc199748152410.1057/palgrave.jors.2600320
- FildesRHibonMMakridakisSMeadeNGeneralising about univariate forecasting methods: Further empirical evidenceInt J Forecasting19981433935810.1016/S0169-2070(98)00009-0
- FildesRGoodwinPLawrenceMThe design features of forecasting support systems and their effectivenessDecis Support Syst20064235136110.1016/j.dss.2005.01.003
- Fildes R, Goodwin P, Lawrence M and Nikolopoulos K (2008). Effective forecasting and judgmental adjustments: an empirical evaluation and strategies for improvement in supply-chain planning. Int J Forecasting 24, forthcoming.
- FinlaySTowards profitability: A utility approach to the credit scoring problemJ Opel Res Soc200859792193110.1057/palgrave.jors.2602394
- ForresterJIndustrial Dynamics1961
- FreundYSchapireREA decision-theoretic generalization of on-line learning and an application to boostingJ Comput System Sci19975511513910.1006/jcss.1997.1504
- GardnerESEvaluating forecast performance in an inventory control systemMngt Sci19903649049910.1287/mnsc.36.4.490
- GardnerESExponential smoothing: The state of the art—Part IIInt J Forecasting20062263766610.1016/j.ijforecast.2006.03.005
- GardnerESDiaz-SaizJExponential smoothing in the telecommunications dataInt J Forecasting200824117017410.1016/j.ijforecast.2007.05.002
- GardnerESKoehlerABComments on a patented bootstrapping method for forecasting intermittent demandInt J Forecasting20052161761810.1016/j.ijforecast.2005.04.021
- GardnerESMcKenzieEForecasting trends in time-seriesMngt Sci1985311237124610.1287/mnsc.31.10.1237
- GhobbarAAFriendCHSources of intermittent demand for aircraft spare parts within airline operationsJ Air Transport Mngt2002822123110.1016/S0969-6997(01)00054-0
- GhobbarAAFriendCHEvaluation of forecasting methods for intermittent parts demand in the field of aviation: A predictive modelComput Opns Res2003302097201410.1016/S0305-0548(02)00125-9
- GilbertCLProfessor Hendry's econometric methodologyOxford Bull Econom Statist198648328330710.1111/j.1468-0084.1986.mp48003007.x
- GreenPEKriegerAMWindYThirty years of conjoint analysis: Reflections and prospectsInterfaces2001313S56S7310.1287/inte.31.3s.56.9676
- HandDJData mining: Statistics and more?Am Statist199852112118
- HanssensDMParsonsLJSchultzRLMarket Response Models: Econometric and Time Series Analysis2001
- HarrisonPJStevensCFA Bayesian approach to short-term forecastiadf888ngOpl Res Quart19712234136210.1057/jors.1971.78
- HarveyACA unified view of statistical forecasting proceduresJ Forecasting1984324527510.1002/for.3980030302
- HarveyNImproving judgment in forecastingPrinciples of Forecasting20015980
- HendryDFMizonGESerial-correlation as a convenient simplification, not a nuisance—Comment on a study of demand for money by Bank of EnglandEconom J197888351549563
- HippertHSPedreiraCESouzaRCNeural networks for short-term load forecasting: A review and evaluationIEEE Trans Power Syst2001161445510.1109/59.910780
- HyndmanRJKoehlerABAnother look at measures of forecast accuracyInt J Forecasting20062267968810.1016/j.ijforecast.2006.03.001
- HyndmanRJKoehlerABSnyderRDGroseSA state space framework for automatic forecasting using exponential smoothing methodsInt J Forecasting200218343945410.1016/S0169-2070(01)00110-8
- HyndmanRJKoehlerABOrdJKSnyderRDForecasting with Exponential Smoothing: The State Space Approach2008
- JainAKDuinRPWMaoJCStatistical pattern recognition: A reviewIEEE Trans Pattern Anal20002243710.1109/34.824819
- JanssensDBrijsTVanhoofKWetsGEvaluating the performance of cost-based discretization versus entropy- and error-based discretizationComput Opns Res200633113107312310.1016/j.cor.2005.01.022
- JohnstonFRBoylanJEForecasting for items with intermittent demandJ Opl Res Soc19964711312110.1057/jors.1996.10
- KaeferFHeilmanCMRamenofskySDA neural network application to consumer classification to improve the timing of direct marketing activitiesComput Opns Res2005322595261510.1016/j.cor.2004.06.021
- KeoghEJKasettySOn the need for time series data mining benchmarks: A survey and empirical demonstrationData Min Knowl Discov20037434937110.1023/A:1024988512476
- KimKJMoskowitzHKoksalanMFuzzy versus statistical linear regressionEur J Opl Res199692241743410.1016/0377-2217(94)00352-1
- KimYStreetWNRussellGJMenczerFCustomer targeting: A neural network approach guided by genetic algorithmsMngt Sci20055126427610.1287/mnsc.1040.0296
- KoehlerABSnyderRDOrdJKForecasting models and prediction intervals for the multiplicative Holt-Winters methodInt J Forecasting20011726928610.1016/S0169-2070(01)00081-4
- KüstersUMcCulloughBBellMForecasting software: Past, present and futureInt J Forecasting20062259961510.1016/j.ijforecast.2006.03.004
- LawrenceMJEdmundsonRHOconnorMJThe accuracy of combining judgmental and statistical forecastsMngt Sci198632121521153210.1287/mnsc.32.12.1521
- LawrenceMGoodwinPO'ConnorMOnkalDJudgmental forecasting: A review of progress over the last 25 yearsInt J Forecasting20062249351810.1016/j.ijforecast.2006.03.007
- LeeHPadmanabhanVWhangSInformation distortion in supply chain: The Bullwhip effectMngt Sci19974354655910.1287/mnsc.43.4.546
- LeeHPadmanabhanVWhangSThe bullwhip effect in supply chainsSloan Mngt Rev199738393102
- LeeHSoKCTangCSThe value of information sharing in a two-level supply chainMngt Sci20004662664310.1287/mnsc.46.5.626.12047
- LeeWYGoodwinPFildesRNikolopoulosKLawrenceMProviding support for the use of analogies in demand forecasting tasksInt J Forecasting200723337739010.1016/j.ijforecast.2007.02.006
- LeitchGTannerJEEconomic-forecast evaluation—Profits versus the conventional error measuresAmer Econom Rev1991813580590
- LiaoKPFildesRThe accuracy of a procedural approach to specifying feedforward neural networks for forecastingComput Opns Res2005322151216910.1016/j.cor.2004.02.006
- LilienGLRangaswamyAMarketing Engineering2004
- LovieADLoviePThe flat maximum effect and linear scoring models for predictionJ Forecasting1986515916810.1002/for.3980050303
- MacGregorDDecomposition for judgemental forecasting and estimationPrinciples of Forecasting2001107123
- MakridakisSHibonMAccuracy of forecasting—Empirical investigationJ R Statist Soc (A)197914297145
- MakridakisSHibonMThe M3-competition: Results, conclusions and implicationsInt J Forecasting20001645147610.1016/S0169-2070(00)00057-1
- MakridakisSAndersenACarboneRFildesRHibonMLewandowskiRThe accuracy of extrapolation (time-series) methods—Results of a forecasting competitionJ Forecasting1982111115310.1002/for.3980010202
- MangasarianOLLinear and nonlinear separation of patterns by linear programmingOpns Res19651344445210.1287/opre.13.3.444
- MeadeNForecasting using growth curves—An adaptive approachJ Opl Res Soc19853611031115
- MeadeNEvidence for the selection of forecasting methodsJ Forecasting200019651553510.1002/1099-131X(200011)19:6<515::AID-FOR754>3.0.CO;2-7
- MeadeNIslamTTechnological forecasting—Model selection, model stability, and combining modelsMngt Sci1998441115113010.1287/mnsc.44.8.1115
- MeadeNIslamTModelling and forecasting the diffusion of innovation—A 25-year reviewInt J Forecasting20062251954510.1016/j.ijforecast.2006.01.005
- MehraRKKalman filters and their applications to forecastingForecasting1979
- MeiriRZahaviJUsing simulated annealing to optimize the feature selection problem in marketing applicationsEur J Opl Res200617184285810.1016/j.ejor.2004.09.010
- MillerDMWilliamsDDamping seasonal factors: Shrinkage estimators for the X-12-ARIMA programInt J Forecasting20042052954910.1016/j.ijforecast.2004.03.002
- MontgomeryALThe implementation challenge of pricing decision support systems for retail managersApplied Stochastic Models Bus Indust2005214–536737810.1002/asmb.572
- MorwitzVGMethods for forecasting with intentions dataPrinciples of Forecasting20013356
- MorwitzVGSteckelJHGuptaAWhen do purchase intentions predict sales?Int J Forecasting200723334736410.1016/j.ijforecast.2007.05.015
- MurthySKAutomatic construction of decision trees from data: A multi-disciplinary surveyData Min Knowl Disc1998234538910.1023/A:1009744630224
- NeelameghamRChintaguntaPA Bayesian model to forecast new product performance in domestic and international marketsMarket Sci19991811513610.1287/mksc.18.2.115
- NewboldPGrangerCWJExperience with forecasting univariate time series and the combination of forecastsJ R Statist Soc (A)1974137131164
- OlafssonSIntroduction to operations research and data miningComput Opns Res2006333067306910.1016/j.cor.2005.01.019
- OlafssonSLiXWuSOperations research and data miningEur J Opl Res200818731429144810.1016/j.ejor.2006.09.023
- OnnKPMercerAThe direct marketing of insuranceEur J Opl Res199810954154910.1016/S0377-2217(98)00024-1
- OrdJKKoehlerABSnyderRDEstimation and prediction for a class of dynamic nonlinear statistical modelsJ Amer Statist Assoc1997924401621162910.1080/01621459.1997.10473684
- PadmanabhanBTuzhilinAOn the use of optimization for data mining: Theoretical interactions and eCRM opportunitiesMngt Sci2003491327134310.1287/mnsc.49.10.1327.17310
- PendharkarPNandaSA misclassification cost-minimizing evolutionary-neural classification approachNav Res Log200653543244710.1002/nav.20154
- PiddMTools for Thinking2003
- PoonSHGrangerCWJForecasting volatility in financial markets: A reviewJ Econom Literature20034147853910.1257/.41.2.478
- ProvostFFawcettTRobust classification for imprecise environmentsMach Learn200142320323110.1023/A:1007601015854
- QuinlanJRDiscovering Rules by induction from large collection of examplesExpert Systems in the Micro-electronic Age1979
- QuinlanJRC45: Programs for Machine Learning1993
- Reid DJ (1972). A comparison of forecasting techniques on economic time series. In: Bramson M.J., Helps I.G. and Watson-Gandy J.A.C.C. (eds). Forecasting in Action. Operational Research Society and the Society for Long Range Planning.
- RossetSNeumannEEickUVatnikNCustomer lifetime value models for decision supportData Min Knowl Disc20037332133910.1023/A:1024036305874
- RossiPEAllenbyGMBayesian statistics and marketingMarket Sci20032230432810.1287/mksc.22.3.304.17739
- RoweGWrightGExpert opinion in forecasting: The role of the Delphi techniquePrinciples of Forecasting2001
- RumelhartDEMcClellandJLUniversity of California San Diego. PDP Research Group. Parallel Distributed Processing: Explorations in the Microstructure of Cognition1986
- SalchenbergerLMCinarEMLashNANeural networks—A new tool for predicting thrift failuresDecis Sci199223489991610.1111/j.1540-5915.1992.tb00425.x
- SandersNRManrodtKBForecasting practices in United-States corporations—Survey resultsInterfaces19942429210010.1287/inte.24.2.92
- SaniBKingsmanBGSelecting the best periodic inventory control and demand forecasting methods for low demand itemsJ Opl Res Soc19974870071310.1057/palgrave.jors.2600418
- SawhneyMSEliashbergJA parsimonious model for forecasting gross box-office revenues of motion picturesMarket Sci19961511313110.1287/mksc.15.2.113
- ScholkopfBSungKKBurgesCJCGirosiFNiyogiPPoggioTVapnikVComparing support vector machines with Gaussian kernels to radial basis function classifiersIEEE Trans Signal Process1997452758276510.1109/78.650102
- ShaleEABoylanJEJohnstonFRForecasting for intermittent demand: The estimation of an unbiased averageJ Opl Res Soc20065758859210.1057/palgrave.jors.2602031
- ShardaRNeural networks for the MS/OR analyst—An application bibliographyInterfaces19942411613010.1287/inte.24.2.116
- ShawMJSubramaniamCTanGWWelgeMEKnowledge management and data mining for marketingDecis Support Syst20013112713710.1016/S0167-9236(00)00123-8
- ShenstoneLHyndmanRJStochastic models underlying Croston's method for intermittent demand forecastingJ Forecasting20052438940210.1002/for.963
- ShoreHBenson-KarhiDForecasting S-shaped diffusion processes via response modelling methodologyJ Opl Res Soc200758672072810.1057/palgrave.jors.2602187
- SmarosJForecasting collaboration in the European grocery sector: Observations from a case studyJ Opns Mngt200725702716
- SmithKAGuptaJNDNeural networks in business: Techniques and applications for the operations researcherComput Opns Res2000271023104410.1016/S0305-0548(99)00141-0
- SmithKAWillisRJBrooksMAn analysis of customer retention and insurance claim patterns using data mining: A case studyJ Opns Res Soc20005153254110.1057/palgrave.jors.2600941
- Smith-Miles KA (2008). Cross-disciplinary perspectives on meta-learning for algorithm selection. ACM Comput Surveys 40, forthcoming.
- SmolaAJSchölkopfBA tutorial on support vector regressionStatist Comput20041419922210.1023/B:STCO.0000035301.49549.88
- SnyderRDKoehlerABOrdJKForecasting for inventory control with exponential smoothingInt J Forecasting20021851810.1016/S0169-2070(01)00109-1
- SultanFFarleyJULehmannDRA meta-analysis of applications of diffusion-modelsJ Market Res1990271707710.2307/3172552
- SyntetosAABoylanJEOn the bias on intermittent demand estimatesInt J Product Econ20017145746610.1016/S0925-5273(00)00143-2
- SyntetosAABoylanJEThe accuracy of intermittent demand estimatesInt J Forecasting20052130331410.1016/j.ijforecast.2004.10.001
- SyntetosAABoylanJEOn the stock-control performance of intermittent demand estimatorsInt J Product Econ2006103364710.1016/j.ijpe.2005.04.004
- SyntetosAABoylanJECrostonJDOn the categorisation of demand patternsJ Opl Res Soc20055649550310.1057/palgrave.jors.2601841
- TalukdarDSudhirKAinslieAInvestigating new product diffusion across products and countriesMarket Sci2002219711410.1287/mksc.21.1.97.161
- TamKYKiangMYManagerial applications of neural networks—The case of bank failure predictionsMngt Sci19923892694710.1287/mnsc.38.7.926
- TanPNSteinbachMKumarVIntroduction to Data Mining2005
- Tashman LJ and Hoover J (2001). Diffusion of forecasting principles through software. In: Armstrong JS (ed) Principles of Forecasting: A handbook for researchers and practitioners. Kluwer: Norwell, MA, pp. 651–676.
- TayASWallisKFDensity forecasting: A surveyJ Forecasting200019423525410.1002/1099-131X(200007)19:4<235::AID-FOR772>3.0.CO;2-L
- TaylorJWExponential smoothing with a damped multiplicative trendInt J Forecasting20031971572510.1016/S0169-2070(03)00003-7
- TaylorJWForecasting daily supermarket sales using exponentially weighted quantile regressionEur J Opl Res2007178115416710.1016/j.ejor.2006.02.006
- TaylorJWBuizzaRDensity forecasting for weather derivative pricingInt J Forecasting2006221294210.1016/j.ijforecast.2005.05.004
- TerasvirtaTvan DijkDMedeirosMCLinear models, smooth transition autoregressions, and neural networks for forecasting macroeconomic time series: A re-examinationInt J Forecasting20052175577410.1016/j.ijforecast.2005.04.010
- ThomasLCA survey of credit and behavioural scoring: Forecasting financial risk of lending to consumersInt J Forecasting20001614917210.1016/S0169-2070(00)00034-0
- Thomas JW (2006). New Product sales forecasting. http://www.decisionanalyst.com/publ_art/SalesForecasting.asp, accessed 12 April 2007.
- ThomasLCCrookJNEdelmanDBCredit Scoring and its Applications2002
- TriggDWLeachAGExponential smoothing with an adaptive response rateOpl Res Quart196718535910.1057/jors.1967.5
- UrbanGLHauserJRRobertsJHPrelaunch forecasting of new automobilesMan Sci19903640142110.1287/mnsc.36.4.401
- Van den BulteCLilienGLBias and systematic change in the parameter estimates of macro-level diffusion modelsMarket Sci19971633835310.1287/mksc.16.4.338
- Van den PoelDLariviereBCustomer attrition analysis for financial services using proportional hazard modelsEur J Opl Res200415719621710.1016/S0377-2217(03)00069-9
- VapnikVNThe Nature of Statistical Learning Theory2000
- VapnikVNChervonenkisAIATheorie der Zeichenerkennung1979
- ViaeneSDedeneGCost-sensitive learning and decision making revisitedEur J Opl Res2005166121222010.1016/j.ejor.2004.03.031
- WierengaBVan BruggenGHStaelinRThe success of marketing management support systemsMarket Sci19991819620710.1287/mksc.18.3.196
- WillemainTRSmartCNShockorJHDesautelsPAForecasting intermittent demand in manufacturing—A comparative evaluation of Croston's methodInt J Forecasting19941052953810.1016/0169-2070(94)90021-3
- WillemainTRSmartCNSchwarzHFA new approach to forecasting intermittent demand for service parts inventoriesInt J Forecasting20042037538710.1016/S0169-2070(03)00013-X
- WilsonRLShardaRBankruptcy prediction using neural networksDecis Support Syst199411554555710.1016/0167-9236(94)90024-8
- WittinkDRBergestuenTForecasting with conjoint analysisPrinciples of Forecasting2001147170
- YajimaYLinear programming approaches for multicategory support vector machinesEur J Opl Res200516251453110.1016/j.ejor.2003.09.021
- YangJYOlafssonSOptimization-based feature selection with adaptive instance samplingComput Opns Res2006333088310610.1016/j.cor.2005.01.021
- YoonYOSwalesGMargavioTMA comparison of discriminant analysis versus artificial neural networksJ Opl Res Soc199344516010.1057/jors.1993.6
- YuZYanHChengTModelling the benefits of information sharing-based partnerships in a two-level supply chainJ Opl Res Soc20025343644610.1057/palgrave.jors.2601255
- ZhangGQNeural networks for classification: A surveyIEEE Trans Systems Man Cybernet Part C—Appl Rev20003045146210.1109/5326.897072
- ZhangGPatuwoBEHuMYForecasting with artificial neural networks: The state of the artInt J Forecasting199814356210.1016/S0169-2070(97)00044-7
- ZhangGQHuMYPatuwoBEIndroDCArtificial neural networks in bankruptcy prediction: General framework and cross-validation analysisEur J Opl Res1999116163210.1016/S0377-2217(98)00051-4
- ZhangGQPNeural networks for classification: A surveyIEEE Trans Systems Man Cybernet Part C—Appl Rev200030445146210.1109/5326.897072
- ZhaoXXieJLeungJThe impact of forecasting model selection on the value of information sharing in a supply chainEur J Opl Res200214232134410.1016/S0377-2217(01)00300-9
- ZhengZGPadmanabhanBSelectively acquiring customer information: A new data acquisition problem and an active learning-based solutionMngt Sci200652569771210.1287/mnsc.1050.0488