
 ?Mathematical formulae have been encoded as MathML and are displayed in this HTML version using MathJax in order to improve their display. Uncheck the box to turn MathJax off. This feature requires Javascript. Click on a formula to zoom.
Abstract
This paper describes the current state of natural language processing (NLP) as it applies to corporate reporting. We document dramatic increases in the quantity of verbal content that is an integral part of company reporting packages, as well as the evolution of text analytic approaches being employed to analyse this content. We provide intuitive descriptions of the leading analytic approaches applied in the academic accounting and finance literatures. This discussion includes key word searches and counts, attribute dictionaries, naïve Bayesian classification, cosine similarity, and latent Dirichlet allocation. We also discuss how increasing interest in NLP processing of the corporate reporting package could and should influence financial reporting regulation and note that textual analysis is currently more of an afterthought, if it is even considered. Opportunities for improving the usefulness of NLP processing are discussed, as well as possible impediments.
1. Introduction
Financial accountants and economists have traditionally relied on quantitative metrics derived from financial statements as a basis for decision making. There is nevertheless increasing recognition that financial statement metrics provide limited insights, either because they do not allow one to infer nuances that may be contained in verbal discussions of financial performance, or because key aspects of organizational performance and value are not reflected in financial statement results in a timely manner. The qualitative (language) content that accompanies periodic financial statements therefore forms an integral component of the information set that financial market participants use for valuation, monitoring, and stewardship.
Consider, for example, the annual report. Are investors content to simply review the financial statements (balance sheet, income statement, statement of shareholders’ equity, and statement of cash flows) and the accompanying footnote disclosures? This seems unlikely. Rather, given that the vast majority of the content is textual, it seems more plausible that users also review accompanying qualitative disclosures so that, at a minimum, they can better understand management’s interpretation of results. While users may in fact process qualitative (unstructured) data in this manner on an individual firm basis, there is increasing interest in converting qualitative content into structured data so that users can employ analytic techniques designed to systematically process large amounts of text. The desire to systematically evaluate unstructured content, coupled with advances in computing power and increasingly sophisticated natural language processing (NLP) methods, has led to an explosion in the number of academic studies and financial market applications that exploit financial text resources.
Elliot (Citation1998) forecasted that the importance of unstructured data for financial decision making would far outweigh its structured counterpart by the end of the twentieth century. Consistent with this forecast, the last two decades have witnessed rapid expansion in the volume of unstructured data available to financial market participants. Examples include: narrative elements of firms’ periodic reporting package; corporate press releases; webpage content; analyst reports; social media posts by a variety of corporate stakeholders including corporate insiders, investors, customers, suppliers, pressure groups and politicians; media commentary; and speeches by policymakers, regulators and politicians. This expansion in the volume of unstructured data creates opportunities and challenges for financial market participants and academic researchers alike. Our goal in this paper is to assess how the scope for automated processing of qualitative data is impacting current research and practice in financial reporting and shaping future agendas. Although we offer our views on methodologies that seem the most promising, our aim is to encourage debate within the finance and accounting communities, rather than promote a particular vision of how best to proceed.
We begin by illustrating how international corporate reporting developments involve the provision of increasing amounts of unstructured data. Examples include reporting on strategy and business models (European Commission Citation2017), key performance indicators and alternative performance measures [European Securities Market Association (ESMA) Citation2015], value creation and capitals [International Integrated Reporting Council (IIRC) Citation2013], supply chains in high-risk areas [Organisation for Economic Cooperation and Development (OECD) Citation2017], emissions and environmental impact [Global Reporting Initiative (GRI) standards], employees, society, and human rights (United Nations Citation2017), and bribery and corruption (OECD Citation2017). Reflecting this general reporting trend, we document significant growth in the size and complexity of U.K. annual report narratives. For example, the median annual report increased from 14,954 to 33,193 words (122%) over the 14-year period from 2003 to 2016 for a sample of 19,426 PDF annual reports published by 3252 firms listed on the London Stock Exchange. The rate of growth is similar to that reported by Dyer et al. (Citation2017) for 10-K filings by U.S. registrants. Increases are evident for both the financial statements component of U.K. reports (particularly following the mandatory adoption of International Financial Reporting Standards) and the narratives component, where the number of items reported in the median table of contents increased by 50% over this period.
We highlight two generic benefits of applying NLP methods to analyze outputs from the corporate reporting process. The first generic benefit is the ability to process large volumes of content at relatively low cost, thereby helping to mitigate concerns about information overload as the quantum of disclosures increase to reflect preparers’ wider social responsibilities. The second generic benefit is the ability of NLP methods to detect latent features in the data that even the closest manual analysis may struggle to identify. We discuss these two properties of NLP in the context of academic research and financial reporting regulation in Sections 4 and 5, respectively. Critically, however, we stress how the increasing adoption of NLP methods does not render manual analysis redundant. Rather, we argue that effective analysis of unstructured corporate disclosures requires a combination of manual and automated approaches.
The growth in unstructured data presents a challenge and an opportunity for capital markets research in financial reporting where the spotlight has traditionally focused on financial statement data and other quantitative outputs, despite the veracity of Elliot’s (Citation1998) prediction. Only recently have top-tier journals in accounting and finance started to embrace research agendas that systematically examine the properties of financial text and their capital market implications.Footnote1 Extant papers have relied on relatively unsophisticated methods such as word counts, with journals and authors appearing unaware of developments in the NLP literature. This may stem from the view that textual analysis is an impenetrable ‘black box.’ We disagree with this perspective and note that sophisticated text analytic approaches utilize established methods such as maximum likelihood estimation. In our view, the primary barriers to wider adoption reflect concerns over familiarity, accessibility, and replication. Increased familiarity can only be achieved by demonstrating the ability of these approaches to provide new insights, their ability to address problems in novel ways, and the possibility of studying issues that cannot be addressed using standard quantitative datasets. Given easy access to open source access applications on platforms like Python and R, as well as commercial platforms like SAS, MATLAB and the WRDS SEC Analytics platform, researcher access is not a significant constraint. The most significant obstacle to wider adoption is replicability. The only way to systematically address this concern is for researchers to report the procedures used to develop a corpus with sufficient granularity. This includes, for example, explaining how graphic files are stripped, how stop words are eliminated, how numbers are treated, and how (and why) stemming is applied.Footnote2
More recent work has started to employ mainstream NLP techniques including cosine similarity to measure document similarity, supervised machine learning to identify document content, and unsupervised learning methods to identify topic structure in individual documents and across a wider corpus. Collectively, these approaches have helped shed light on important associations between unstructured data and corporate actions. The words selected by managers and the language used by media to report on firms have been shown to correlate with future stock returns, earnings, and even future fraudulent activities of management. Clearly, financial market participants incorporate more than just quantitative data in their decision models, but as the accounting and finance literature seeks to harness the full potential of the NLP toolkit, researchers must proceed with caution to ensure methods are applied transparently to study economically important questions.
The proliferation of unstructured information represents a major challenge for financial market participants, many of whom are concerned about overlooking relevant information (Financial Reporting Council Lab Citation2015). Such is the volume of available data and the frequency with which it is updated that comprehensive manual scrutiny of all potentially relevant content by human experts is already bordering on the impossible. Not surprisingly, therefore, practitioners and information users are looking increasingly towards technological solutions to assist with the task of analyzing unstructured data and harnessing the opportunities that big data applications provide. We explore how changes in the way users access and process information impacts various aspects of corporate reporting and communication including the nature of the disclosure problem as defined by the International Accounting Standards Board (IASB) in its Disclosure Initiative (IASB Citation2017), the definition of materiality, and the implications for standards governing the form and structure of corporate disclosures. We highlight the paradox that while the increasing volume of unstructured data intensifies the demand for technical processing solutions, it also reduces viability because ever-more sophisticated techniques are required to combat the lack of standardization in reporting formats.
A key policy-relevant theme to emerge from our analysis is that it is becoming increasingly hard for policymakers and regulators to justify divorcing debate about content from matters of presentation. This is because the form in which data are presented and stored fundamentally affects their usefulness in settings where increasing reliance is placed on automated processing. We also believe that structured data requirements can improve the content of verbal discussions because they limit managerial discretion and implicitly force the discussions to address issues that are important to users. We review the structural barriers that restrict the opportunities to process unstructured corporate disclosures automatically and offer suggestions for making corporate disclosures more amenable to automated processing.
2. The corporate reporting landscape
2.1. The growth in unstructured data
The IASB advances the notion of the corporate reporting package. The reporting package: comprises one or more documents published at approximately the same time as the entity’s financial statements; communicates the entity’s results to users of its financial statements; and is publicly available on the company’s website or in its regulatory filings (IASB Citation2017: para 4.23). This definition includes press releases, earnings announcements, investor presentations and regulatory filings, and is therefore broader than the mandated financial statements and associated commentary. A large fraction of the content involves text (or verbal communication transcribed into text in the case of conference calls and management presentations), much of which also incorporates quantitative information (Siano and Wysocki Citation2018). These data are classified as unstructured because the elements are not amenable to rapid automated retrieval in a consistent manner across entities and over time.
The annual report and accounts form the centerpiece of the corporate reporting package consists largely of unstructured content. International Financial Reporting Standards involve high levels of unstructured financial statement data (Morunga and Bradbury Citation2012, El-Haj et al. Citation2019b). Auditor commentary on key audit matters is also increasing in jurisdictions such as the U.K. and U.S. (Gutierrez et al. Citation2018). Beyond the financial statements and audit report, expansion of the reporting model to incorporate a broader stakeholder perspective is leading to further growth in the volume of unstructured data. provides a (non-exhaustive) summary of key international reporting initiatives issued since 2010 relating to aspects other than the financial statements. The majority of these disclosure developments involve unstructured narrative commentary. This trend is compounded by reporting developments at the country- and market-level.Footnote3
Table 1. Examples of international reporting initiatives relating to aspects of the financial reporting package other than the financial statements involving a significant element of unstructured (text-based) content.
2.2. Case study: U.K. annual reports
Dyer et al. (Citation2017) document dramatic growth over the last two decades in the size and content of annual reports filed on Form 10-K by U.S. securities market registrants. While informative, the standardized nature of the 10-K reporting template means that the analysis is not necessarily representative of changes in other regimes where annual reporting is less standardized, more stakeholder-oriented, and influenced to a larger degree by international reporting guidelines. The U.K. provides a good example of a setting where: core reporting requirements include a broader set of corporate themes than the 10-K; requirements of supranational bodies shape reporting outcomes to a larger degree; and preparers enjoy almost unlimited discretion over the inclusion of non-mandated content. U.K. annual reports therefore provide a useful alternative barometer with which to measure changes in the volume and scope of corporate reporting.
document growth in unstructured data for a sample of 19,542 U.K. annual reports published between 2003 and 2016 by 3252 firms listed on the London Stock Exchange (LSE) main market and Alternative Investment Market (AIM). Annual sample sizes range from a low of 1074 reports in 2003 to a high of 1659 reports in 2007. Panels A and B in report median page count and median word count, respectively, for the following three series: the entire annual report; the narratives component of the annual report; the financial statements component.Footnote4 A monotonic upward trend is evident for all three series. The number of pages in the median report increased by 57% from 47 pages in 2003 to 74 pages in 2016, while total word count increased by 122% from 14,954 words in 2003 to 33,193 words in 2016. Significant growth in unstructured content is evident in both the narratives and financial statements components, although the catalysts differ. Most of the increase in financial statements content occurs between 2006 and 2008, corresponding to mandatory IFRS adoption by LSE Main Market and AIM firms (El-Haj et al. Citation2019a). In contrast, growth in the narratives component is more linear and reflects continuous development in stakeholder reporting. presents equivalent statistics for four common elements of the narrative component: the chair’s letter, management commentary, governance statement, and remuneration report. A significant increase in the textual content is evident for all sections other than the chair’s letter, with performance commentary displaying the most pronounced growth at 131%.
Figure 1. Median annual report length for a sample of 19,542 U.K. annual reports published between 2003 and 2016 by 3252 firms listed on the London Stock Exchange (LSE) main market and Alternative Investment Market (AIM). Annual sample sizes range from a low of 1074 reports in 2003 to a high of 1659 reports in 2007. Panel A: Page count; Panel B: Word count. Notes: U.K. annual reports are decomposed into the Narratives and Financials components according to the approach described in El-Haj et al. (Citation2019a). The Financials component of the annual report includes the primary financial statements, accompanying notes, the auditor’s report, the statement of directors’ responsibilities, and generic shareholder information including financial calendar and form of proxy, The Narratives component of the annual report includes all remaining sections including the chair’s letter to shareholder, management commentary, report of directors, governance statement, remuneration report, principal risk and uncertainties, and other stakeholder disclosures such as environmental and social responsibility commentary. Annual report text is retrieved and processed using the software tool developed by El-Haj et al. (Citation2019a).
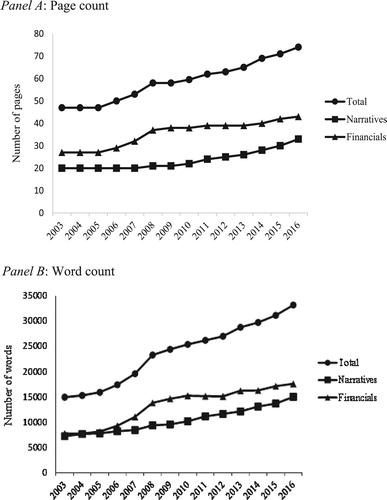
Figure 2. Median length of enduring annual report sections for a sample of 19,542 U.K. annual reports published between 2003 and 2016 by 3252 firms listed on the London Stock Exchange (LSE) main market and Alternative Investment Market (AIM). Annual sample sizes range from a low of 1074 reports in 2003 to a high of 1659 reports in 2007. Panel A: Page count; Panel B: Word count. Notes: U.K. annual report content is retrieved, classified and processed using the software tool developed by El-Haj et al. (Citation2019a).
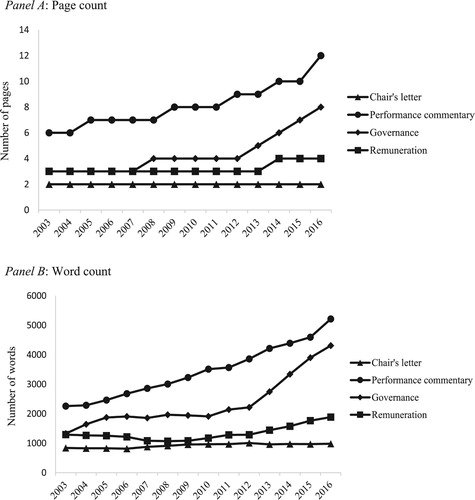
Figure 3. Number of narrative sections listed in table of contents of the median annual report for sample of 19,542 U.K. annual reports published between 2003 and 2016 by 3252 firms listed on the London Stock Exchange (LSE) main market and Alternative Investment Market (AIM). Annual sample sizes range from a low of 1074 reports in 2003 to a high of 1659 reports in 2007. Notes: The table of contents in U.K. annual reports is retrieved and processed using the software tool developed by El-Haj et al. (Citation2019a).
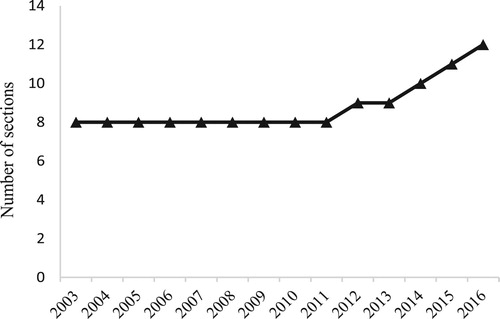
Significant growth in the unstructured text is accompanied by substantial complexity in both content and the way it is presented. reports a 50% increase in the number of separate sections highlighted in the median annual report table of contents. Assuming the number of sections proxies for the range of distinct high-level topics discussed, these results demonstrate the increasing scope of disclosures in firms’ reporting package. Increasing scope in coverage is underpinned by substantial presentational complexity. First, untabulated results suggest increasing fragmentation of the reporting package as management carve out elements of non-financial information as separate documents (e.g. corporate and social responsibility reports). Second, the nomenclature used to describe similar core report components varies dramatically across firms and time. For example, our sample contains over 20 distinct names for the chair’s letter to shareholders and over 50 different headers for management commentary. This lack of standardization impedes the comparability of unstructured data ().
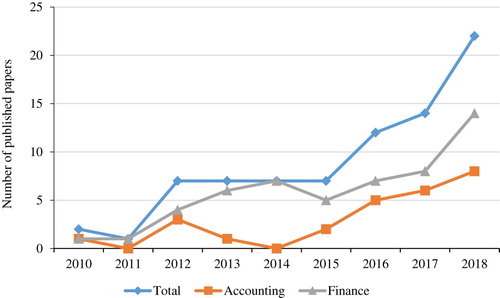
Figure 4. Text-based articles published in The Accounting Review, Journal of Accounting Research, Journal of Accounting and Economics, Journal of Finance, Journal of Financial Economics, and Review of Financial Studies during the period 2010-2018.
3. The benefits of NLP
Academics and practitioners are united in the belief that structured quantitative data are insufficient for economic decision-making (KPMG Citation2014, p. 4, Lev and Gu Citation2016). Corresponding growth in the volume and perceived relevance of unstructured textual content in the reporting package creates a demand for efficient and effective processing methods from researchers and financial market participants alike. We highlight two generic processing benefits that NLP methods offer users of the corporate reporting package. The first benefit is the ability to process large volumes of content at relatively low cost. The second benefit is the ability to detect latent features in the data. We discuss these two general contributions in further detail below, followed in Sections 4 and 5 by an assessment of their impact on (and implications for) financial reporting research and regulation.
Before outlining each generic NLP contribution in more detail, we offer two general observations on the use of automated processing techniques to analyse the reporting package. Our first observation is that while automated methods provide significant opportunities for researchers and practitioners, in neither case do we see NLP replacing detailed manual analysis, not least because the development of machine learning applications often relies on extensive manual analysis to train and validate models (El-Haj et al. Citation2019b). Instead, we believe that effective approaches to analyzing unstructured financial reporting data will continue to involve a combination of manual and automated methods, with the relative weights attached to each approach varying according to the particular research question or decision setting.
Our second observation relates to the inherent paradox of using NLP methods to analyze unstructured components in the corporate reporting package. While rapid growth in unstructured content increases demand for NLP solutions to assist with analyzing reporting outcomes, the same trend increases the cost and reduces the viability of developing fine-grained NLP solutions. Realizing the full benefits of NLP is conditional on low cost, reliable access to financial text on a large scale. An emerging challenge for financial reporting regulators is how to ensure demands for firms to report more unstructured content results in disclosures that are also capable of being processed automatically and at low cost. We return to this theme in Section 5 when we discuss the implications of NLP for accounting regulation, and in Section 6 where we review the impediments to further progress.
3.1. Generic benefits of NLP: Addressing overload concerns
Section 2 highlights the dramatic growth in unstructured corporate data. Despite continuing concern over the size of the reporting package (FRC Citation2011, Citation2015), growing pressure for corporate accountability suggests that further expansion of the aggregate reporting package is the most likely direction of travel. The proliferation of information represents a major challenge for users in the form of information overload. Users are naturally concerned about the risk of overlooking relevant information (FRC Lab Citation2015) and the quantum of data is at such a level that the feasibility of analyzing it in a timely fashion using only manual methods is questionable.
Holding the volume of data constant, the corporate reporting package is also fragmented by its nature (IASB Citation2017); and the fragmentation problem is growing as preparers and regulators explore ways of shrinking the annual report while simultaneously providing accountability to a widening stakeholder group. One solution involves removing non-mandatory content from the annual report and placing it in a separate document or on a website, with signposting in the annual report to the location of the supplementary content (FRC Citation2014, FRC Lab Citation2014, IASB Citation2017).Footnote5 Fragmentation compounds the overload problem for a human reader because tracking information across multiple reporting channels and evaluating the consistency of content and messaging is challenging. Consider, for example, the Management, Discussion, and Analysis section of a 10-K report. Filers are permitted to supply this information through the proxy statement, provided the 10-K includes a statement that it is incorporating the information from the proxy statement by reference. The simple act of directing readers to another document likely renders these important discussions less transparent.
NLP offers a way to alleviate problems of disclosure overload. Automated retrieval and analysis of text allows financial report users to process much larger volumes of data than is possible via manual reading. At the simplest level, NLP methods can be used to filter content relevant to a particular decision problem. The filtering process can involve varying levels of complexity ranging from a naïve keyword search, to named entity recognition (NER) methods, to more advanced retrieval tasks targeting specific sections in an unstructured document (El Haj et al. Citation2019a). An extension to this simple filtering approach is a decision support system that ‘red flags’ specific cases for further analysis. In both applications, NLP technology is supplemented by further manual scrutiny by domain experts. The initial automated step adds value by concentrating scarce manual resources on the most relevant disclosures and firms. The approach is relevant for academic researchers and financial market practitioners alike. In practice, for example, the Securities and Exchange Commission (SEC) in the U.S. applies a text-based risk assessment system to Tips, Complaints, and Referrals (TCRs) with the aim of efficiently identifying cases that are more likely to result in successful litigation. The SEC has also used NLP methods to extract data from registration statements to assess how emerging growth companies avail themselves of JOBS Act provisions (Bauguess Citation2016). In research, Li (Citation2010a) uses an algorithm to extract forward-looking sentences from the Management Discussion and Analysis (MD&A) section of 10-K filings for subsequent manual coding. More generally, Li (Citation2010b), highlights how NLP methods help to improve generalizability and expand the set of research questions that can be feasibly addressed.
3.2. Generic benefits of NLP: Identifying latent features
A fundamental objective of NLP and data science methods more generally is the detection of patterns in large datasets that are not evident to human readers operating at the individual firm or document level. At the heart of the methodology is the recognition that statistical analysis of a large corpus can identify primitive characteristics in the data that are not observable when studying small parts of the corpus in isolation. Such approaches have been applied successfully in the NLP and corpus linguistics fields to detect diverse features including early onset of degenerative brain diseases such as dementia and Alzheimer’s (Le et al. Citation2011) and adults masquerading as children in online chatrooms (Rashid et al. Citation2013).
Li (Citation2010b) highlights the potential of NLP for identifying latent features in unstructured financial reporting data. Examples from the extant accounting literature include: detecting financial reporting irregularities from conference call dialogue (Larcker and Zakolyukina Citation2012) and annual report commentary (Goel et al. Citation2010, Purda and Skillicorn Citation2015, Brown et al. Citation2017); identifying inconsistencies in reporting style across documents issued by the same entity (Davis and Tama-Sweet Citation2012, Dikolli et al. Citation2017); identifying managerial obfuscation in conference calls (Bushee et al. Citation2018); and measuring CEO personality traits using conference call dialogue (Gow et al. Citation2016).
NLP methods for detecting latent features have also been successfully employed by financial market professionals. For example, the SEC employs a range of techniques including text similarity and topic modeling to identify common features emphasized by tippees in TCRs that correlate with fraudulent corporate activity. Meanwhile, portfolio managers are using unsupervised artificial intelligence systems to build text-based models that predict stock returns over short windows (Balakrishnan et al. Citation2010, Lee et al. Citation2014). Commercial products are also emerging that evaluate corporate communications, news wire feeds, and web article aggregators on a range of dimensions including relevance and sentiment (e.g. RavenPack and Calcbench https://www.calcbench.com).
4. Financial reporting research
There are a number of excellent survey papers that discuss the use of text analytics in the accounting literature. Li (Citation2010b) describes some of the manual approaches used by researchers and surveys the academic literature in the context of the research questions being asked. Kearney and Liu (Citation2014) provide a more recent survey of methods and literature with a focus on textual sentiment. Das (Citation2013) provides an overview of different methodologies and seeks to help researchers that are unfamiliar with textual analysis to familiarize themselves with some of the available software that has been developed using the R programming language. Loughran and McDonald (Citation2016) survey methodological approaches under the general heading of ‘bag-of-words’ techniques. El-Haj et al. (Citation2019b) critique extant research analyzing unstructured financial reporting content. They conclude current work risks overstating the incremental contribution of NLP approaches relative to manual analysis.
Closer inspection of papers employing textual analysis methods published in leading accounting and finance journals over the period 2010 to 2018 reveals the application of a variety of analytic techniques to determine whether textual attributes are correlated with firm fundamentals.Footnote6 Typical of areas that explore new methodologies, we find that published papers overwhelmingly rely on simple approaches such as keyword searches (17), word counts (29), and dictionaries that measure specific attributes such as tone (17), and readability scores like the FOG index (7). Only 12 papers embrace more powerful techniques like cosine similarity, naïve Bayes classification, and topic modeling approaches (e.g. latent Dirichlet allocation).
Due to the widespread adoption of different methodologies, particularly those that are relatively unsophisticated, some of our discussion overlaps that contained in existing surveys. We not only discuss these methods but provide intuitive descriptions of some of the more sophisticated methodologies that have not been surveyed elsewhere. Our paper does not attempt to be comprehensive in its coverage. Similar to existing surveys, we focus on quantitative methodologies that have proven to be the most popular in accounting and finance.
We are not the first to emphasize that sophistication for sophistication’s sake can be counterproductive. The same is true for overreliance on simplistic methods that are incapable of addressing document nuance. It is important to keep in mind that one size does not fit all and that the choice of methodology depends on the nature of the problem being examined. We believe that methodologies should be employed in settings that are most appropriate and that there is room for all. Different techniques do not compete with one another, but should be viewed as a set of tools that are available to the researcher depending on the specific research question. Just because one understands how to use a specific methodology, it does not imply that it should be used to answer every relevant question.
The methods we focus on attempt to distill meaning from the message. It may be surprising that, given the inherent nuance conveyed through verbal expression, all of the widely used techniques rely on the critical assumption of independence to reduce the extraordinary dimensionality of a document. In this context, independence implies that the order, and thus direct context, of a word is unimportant. Methods where word sequence is ignored are typically labeled as ‘bag-of-words’ techniques. Many of these are based on collapsing a document into a term-document matrix consisting of rows of words and columns of word counts. Given the extensive set of available methodological tools, tabulating word counts appears to be a baby step in the science of applying textual analysis.
The critical question is whether important incremental information can be extracted by more deeply parsing documents for contextual meaning (Loughran and McDonald Citation2016). This is essentially a signal-to-noise tradeoff, where contextual nuance is the signal and the increasing imprecision of deep parsing is the noise.
4.1. Key word searches and word counts
Text analytic methodologies typically start by parsing a set of documents into word counts. Less sophisticated approaches rely on a dictionary comprised of all of the words contained in the corpus to then perform keyword searches, while others combine keyword searches with word counts to measure the intensity of specific attributes. For example, Hoberg and Moon (Citation2017) identify keywords related to offshore activities in 10-K filings to determine whether their frequencies are related to operational hedging. Loughran et al. (Citation2009) consider the frequency of the word ‘ethic’ along with the phrases ‘corporate responsibility,’ ‘social responsibility,’ and ‘socially responsible’ in 10-K filings to determine if these counts are associated with ‘sin’ stocks, corporate governance measures, and class action lawsuits.
4.2. Attribute dictionaries
One of the most popular applications of word counts is the use of key word dictionaries that are associated with specific attributes. There are a number of dictionaries that are commonly used in natural language processing applications such as the Harvard-IV, Jockers-Rinker, and Loughran-McDonald (LM Citation2011). In particular, LM have created a number of dictionaries that classify words into specific categories that include tone, uncertainty, litigious, or weak modal.
The application of dictionary-based textual analysis is straightforward. Consider, for example, the assessment of a document’s tone. One first counts the number of positive or negative words based on a specific dictionary and then typically scales the counts to create word proportions. Documents with a relatively high frequency of positive words are considered optimistic and likewise those with a relatively high percentage of negative words are labeled pessimistic. A commonly used measure of tone is the difference between the scaled positive and negative tone words.
A limitation of the dictionary-based approach is that general purpose dictionaries tend to misclassify words that may have one context in general settings but a different context in specific settings. For example, words like ‘liability’ and ‘depreciation’ are common financial terms that would be viewed as having a neutral tone in the context of a 10-K filing, but would be generally associated with negative tone elsewhere. The possible misclassification of document attributes motivated LM to develop a number of finance-specific dictionaries that are calibrated to the research question. This concern is broadly applicable and should be a consideration as researchers considering applying dictionaries in other settings.
Recent work by Grossetti et al. (Citation2019) provides a set of ‘best practices’ when using dictionary-based approaches They show that the methods used to construct a dedicated dictionary may lead to a loss of wider textual meaning thus, creating a need to clearly summarize how different dictionaries identify different words as key determinants of narrative tone. They argue that a set of careful diagnostics can be used to help identify the effects of opaque value judgments applied to build dedicated dictionaries.
The primary advantages of this approach are that the results are easy to interpret and it is replicable. A drawback is that results are conditional on the dictionary being used and there can be a tendency to overclaim a non-finding. While a significant finding indicates an unambiguous association between a corpus and tone, a non-finding cannot be used to conclude that the attribute does not matter.Footnote7
4.3. Naïve Bayes classification
Naïve Bayes classification (NBC) is an important technique that has seen wide application in accounting and finance that falls under the category of supervised learning models. Supervised learning models are so-named because they require manual ‘training’ and ‘testing’ before they can be implemented.
The goal of NBC is to use Bayes’ rule to measure how likely the words in a corpus of documents convey a specific attribute. The first step is to convert the corpus into a document-term matrix. (A document-term matrix is a matrix where the elements correspond to word frequencies and documents are designated by rows and words by columns.)
The next step is to develop the training and testing data. This involves manually classifying the unit of measure (sentence, paragraph, or document) into categories. For example, Li (Citation2010a) manually classifies 30,000 randomly selected sentences into four tone categories (positive, neutral, negative, and uncertain) and twelve content categories.Footnote8
The next step is to select a sample of manually classified documents (the ‘training’ sample) and calculate the frequency that the words contained in the corpus vocabulary are associated with documents that have positive and negative tone. Intuitively, documents with negative tone use more negative words. The classification rule is then constructed by calculating the average frequency that the vocabulary words appear in training documents that have a specific attribute.
The validity of the algorithm must then be tested. The first step is to calculate the within-sample classification error rate. Despite being downward biased, this is a useful diagnostic tool. Its main attribute is to provide the researcher with an initial assessment of how well the classification algorithm can be expected to perform. If the error rate is unacceptably high, it may indicate that the training model was not carefully constructed.
The researcher further evaluates model validity using out-of-sample data by calculating the likelihood that the ‘test’ documents have either positive or negative tone. To determine the tone of a test document, the researcher calculates the likelihood that it has both positive and negative tone. The classifier then determines the document’s tone by selecting the attribute that has the highest likelihood.
To calculate the likelihood a test document has positive tone, each word is multiplied by the average frequency it appears in training documents with positive tone. These individual frequencies are then multiplied together (under the independence assumption) to calculate the likelihood that the test document has positive tone. The process is repeated under the assumption the test document has negative tone.
There are a number of approaches for implementing tests of model validity. In addition to the implicit 50–50 split described above, another approach divides the sample into training and testing subsamples where N% is assigned to the training sample and (100 − N)% is reserved for testing. In this N-fold cross-validation test, the data is randomly partitioned into N equal parts. N experiments are performed and in each experiment one part is taken as the testing data while the remaining (N − 1) parts are used for training. At the end, the results over the N experiments are averaged.
One of the main limitations associated with NBC is that the building of training and testing data sets is costly and time consuming. The ultimate success of the model also depends on the care that the researcher uses to classify the training and testing data because careless classification may result in unacceptably high false classification rates.Footnote9
4.4. Cosine similarity approaches
Cosine similarity is a standard metric that is used to compare document similarity (See Sebastiani (Citation2002)). Given two documents that have been converted into word distribution vectors, the cosine similarity between documents m and n is calculated as their inner product, i.e.
where Dm and Dn are word distribution vectors.
The word distribution vector sums to one, and each element indicates the relative frequency of the given word in document d. We recommend that researchers normalize word vectors to have unit length because
has the desirable property that it only correlates modestly with document length.
Mathematically, cosine similarity is the cosine of the angle between documents m and n. Since the elements of the word distribution vectors are non-negative, the cosine similarity lies between 0 and 1. This makes easy to interpret, as two documents with no overlap have a cosine similarity of zero, whereas two identical documents have a cosine similarity of 1.
If one mean-adjusts , it is equal to a Pearson correlation coefficient. This prompts Loughran and McDonald (Citation2016) to conclude that ‘there seems little reason in business disciplines to use this measure instead of the simple correlation.’ Given the simplicity of calculating a dot product and its widespread use in natural language processing applications, it is difficult to understand why the use of standard terminology is confusing.
Hoberg and Lewis (Citation2017) show that is possible to extend the cosine similarity framework to create a measure of document similarity relative to a specific attribute. Examples of attributes could be accounting fraud, earnings guidance, or initial public offering underpricing. And the relevant documents that comprise the associated corpus could include Management Discussion and Analysis sections from company 10-K filings, conference call transcripts, and offering prospectuses.
The idea is to calculate a measure of Attribute Similarity () that determines whether the Abnormal Discussion (
) contained in a specific document is similar to the abnormal discussions of documents that share a common attribute.
focuses on abnormal discussion to control for possible spurious similarity that could be attributable to common discussion among comparable documents, such as boiler plate. For example, if documents released by companies in the same industry discuss common themes, it can cause cosine similarity scores to be high even though the documents themselves may not contain significant incremental information.
Once the researcher has identified the treatment attribute, say accounting fraud, the next step is to compute the abnormal discussion for each document d () by netting a specific word distribution vector
against an average word distribution vector derived from a set of control documents (
), i.e.
The control documents are designed to address document commonality that is independent of the discussion attribute. For example, the documents contained in could be those released by firms in the same industry.Footnote10 The resulting vector sums to zero, as
and
each sum to one.
One can then create a measure of document similarity relative to a specific treatment attribute () by identifying a set of documents that have been treated and calculate the average abnormal discussion vector (
). The average abnormal discussion vector for a specific attribute has a document specific subscript because
is excluded from the calculation of
to avoid mechanistic correlation.
We then define an attribute similarity score () as the cosine similarity between
and
as follows:
4.5. Topic models
One of the most exciting developments in text analytics has been the growing use of topic modeling and in particular Latent Dirichlet Allocation (LDA), in accounting and finance. Most of the attention to date has focused on whether verbal discussions in 10-K filings, most notably the Management Discussion and Analysis (M&DA) section, contain incremental information beyond that contained in the basic financial statements and accompanying footnotes.
LDA is a generative statistical model that identifies verbal topics from a corpus of text documents (See Blei et al. (Citation2003)). The generative-nature of LDA is a key advantage because it is a statistical approach that does not require researcher pre-judgment and is replicable. In this sense, it differs from supervised learning approaches, like naïve Bayes estimation, that require the researcher to train models so that they are able to classify documents by specific attributes.
LDA uses a likelihood approach to discover clusters of text, namely ‘topics’ that frequently appear in a corpus. This approach assumes that the document generation process arises from an underlying topic distribution rather than a distribution over individual words. A particular topic can be characterized as a distribution over a common vocabulary of words where the relative probability weight assigned to each word indicates its relative importance to that topic.
For a given topic, we refer to the weights assigned to specific words as Topic Word Weights (TWW). A topic is thus a word vector where each TWW indicates that word’s relative importance. For example, the words ‘oil’ and ‘electricity’ might be important to topics associated with Natural Resources and Manufacturing, but one might expect oil to receive a higher weighting than electricity in the Natural Resources topic. The opposite might be true for the Manufacturing topic.
Each document is then represented as a weighted average of different topics. We refer to the weights applied to each topic within a specific document as a Document Topic Weight (DTW).
A limitation of LDA is that the optimal number of topics is unknown a priori. This is problematic because different specifications will likely lead to different interpretations of the corpus. Since researchers using LDA must pre-specify the number of topics, selecting an insufficient number of topics may result in a model that is too coarse to be useful in uncovering the underlying structures that are being discussed in the corpus. An excessive number of topics could result in uninformative or possibly redundant topics.
5. Financial reporting regulation
This section assesses the implications for accounting regulators of the increasing trend to process unstructured data in the financial reporting package using NLP methods. We use the IASB Discussion Paper Disclosure Initiative – Principles of Disclosure (IASB Citation2017) as an organizing framework for our discussion, with a particular focus on the following three aspects: the definition of financial reporting users, the nature of the disclosure problem as defined by the IASB, and the properties of effective communication. We examine the implications of NLP for each aspect with the aim of illustrating how technology changes the traditional approach to thinking about disclosure. By way of context, we note that no reference is made to NLP methods or technology more generally throughout the entire 107-page Discussion Paper, suggesting that regulators may be blind to the opportunities and could be blindsided by the consequences that widespread adoption of such technology can have on financial reporting.
5.1. The definition of users
The IASB currently defines users of the reporting package along a single dimension reflecting the information needs associated with their contractual relation with the entity (IASB Citation2018a).Footnote11 However, increasing interest in NLP approaches suggests a second, cross-cutting dimension that reflects users’ approach to retrieving and processing data. Consistent with this view, the IASB (Citation2018b, Item G, para. 26) acknowledges the need to distinguish between traditional and digitally sophisticated users. Traditional users adopt a manual reading strategy and typically view documents as a linear narrative or a key reference source. Digitally sophisticated users operate on a larger scale, with the aim of extracting and processing content automatically to realize the generic benefits of NLP outlined in Section 3.Footnote12
The distinction between users based on their approach to processing financial data foregrounds debate over the format and delivery of the financial reporting package, and in particular whether it is possible to satisfy both groups’ information needs through a single reporting model. The emerging view is that digitally sophisticated users require a different approach to preparing and delivering financial information that emphasizes the ability to access content flexibly and at low cost. While IASB staff argue that advances in technology are unlikely to eliminate the need to access information contained in financial statements through traditional sources such as paper or PDF (at least in the near term), they acknowledge that these formats may not continue as the predominant means of providing and reporting financial information (IASB Citation2018b, para. 25). The role, format and future of the annual report is at the center of this debate. Aside from notable exceptions such as the U.S., Canada and Australia, annual reports are normally designed and distributed with a traditional user in mind. While discretion over content and the order in which that content is presented enables management to tailor the reporting narrative to the unique aspects of their entity and approach to value creation, the highly unstructured nature of the resulting report severely constrains the opportunities to apply NLP methods. These problems are compounded when the annual report is distributed in PDF format.
5.2. The disclosure problem
The IASB (Citation2017, 13, para 1.5) characterizes the disclosure problem as a function of (a) insufficient relevant information, (b) too much irrelevant information, and (c) inefficient communication of the information provided. The use of NLP methods has important implications for the disclosure problem as defined by the IASB. For example, the problem of too much irrelevant information may be less of an issue in the context of automated analysis because information overload is less of a concern for NLP applications (IASB Citation2018b, Item 11G, para 15).Footnote13 Indeed, the filtering role of NLP highlighted in Section 3 may offer a more effective and efficient way of addressing this aspect of the disclosure problem than is possible through regulation (at least for digitally sophisticated users).
Provision of (ir)relevant information is central to the IASB’s perspective on the disclosure problem. This view implicitly assumes that the relevance threshold can be objectively determined ex ante by stakeholder groups including preparers and users. However, the potential for NLP to detect latent features in unstructured data raises serious questions about this ex ante view of relevance. Consistent with this concern, FEE (Citation2015, p. 29) argues that management are not necessarily best placed to make judgements about what is and is not relevant to stakeholders. For example, management repeatedly argue that the cost of complying with the SEC’s XBRL mandate is excessively burdensome despite the fact that out-of-pocket costs are relatively modest. Big data NLP methods simply take this logic a step further, with relevance ultimately being determined by algorithms and statistical analysis rather than the priors of regulators, preparers and users. The same argument holds for the debate over materiality.Footnote14 Moreover, the filtering role of NLP also suggests the problem of too much irrelevant information may be easier to resolve than the problem of insufficient relevant information. We therefore believe that growing interest in NLP approaches to analyzing the financial reporting package raises questions about both the IASB’s representation of the disclosure problem in its 2017 Discussion Paper and the most appropriate ways of addressing it.
5.3. The properties of effective communication
Effective communication is defined by the IASB as being: (a) entity-specific (absence of boilerplate); (b) simple and direct (absence of technical jargon); (c) organized in a way that highlights important matters; (d) linked to other relevant information to highlight relations and improve navigation; (e) free from unnecessary duplication; presented in a way that optimizes cross-sectional and temporal comparability; and (f) presented in an appropriate format (IASB Citation2017, para 2.6).
NLP has several implications for the issue of effective communication. First, NLP methods offer a (partial) means of overcoming certain features of ineffective communication. For example, NLP tools can be designed to identify and filter-out boilerplate disclosure, translate technical jargon, highlight links between relevant information (either within the same document or across different documents), and identify key reporting themes. Further, these solutions are equally relevant for digitally sophisticated users (as part of a big data methodology) and traditional users (as part of a decision support system designed to assist manual analysis).
Accordingly, NLP can help to enhance the effectiveness of financial communication and thereby (partially) resolve the disclosure problem.
A critical part of the reporting challenge with unstructured data is that it is traditionally viewed as static, hence regulators’ concerns about organization, duplication, signposting and cross-referencing, and comparability. This static perspective on narrative commentary contrasts with financial statement data, where reformulation is commonplace. Examples include alternative performance measures and non-GAAP earnings reported by management (ESMA Citation2015), and street earnings measures defined by analysts (Young Citation2014). NLP offers the potential to fundamentally change the way decision-makers use unstructured data by introducing a dynamic dimension where users are able to reorganize and select (i.e. normalize) as-reported content conditional on the specific decision context faced.
Use of NLP methods also has implications for the definition of effective communication. Specifically, since NLP applications rely on reliable, low-cost access to source data, the focus of effective communication expands to include delivery as well as content. All else equal, information that cannot be accessed in a way that supports decision making is not useful regardless of the specific content. In an NLP setting, therefore, delivery (i.e. format, degree of standardization, file type, etc.) is as important for determining communication effectiveness as content. This view contrasts with the IASB’s stated position as revealed in the minutes from the July 2018 Board meeting where members argued that users ultimately care about useful content and as a consequence the focus of its disclosure initiative should center on content, rather than the process by which content is delivered and consumed (IASB Citation2018b, para. 27). While we are sympathetic to the IASB’s view, we believe that divorcing content from delivery is no longer appropriate because the two aspects are inherently linked where NLP applications are concerned. Instead, we believe there exists an urgent need to integrate debate about the provision of useful content with consideration of how best to deliver that content. This is particularly true for digitally sophisticated users and serves to highlight how the definition of effective communication is likely to vary depending on user group.Footnote15
6. Impediments to further progress
The last decade has witnessed significant progress applying NLP methods to the outputs of the financial reporting package, albeit from a low base. As outlined in Section 3, the majority of mainstream financial reporting research uses simple content analysis techniques such as word counts and readability measures applied to a relatively narrow range of documents comprising primarily of U.S., registrants’ EDGAR filings, conference calls, and corporate press releases. To ensure continued progress, the next phase of work for both academic researchers and financial market professionals will involve applying more sophisticated NLP methods to a wider set of mainstream textual resources. However, a series of structural impediments risk derailing progress in this second phase. We highlight six impediments relating to two core themes of data access and collaboration:
Access to text resources (repositories and metadata): In most countries, the opportunity to harness the full benefits of NLP is constrained by the absence of a comprehensive repository from which elements of the financial reporting package can be harvested and collated automatically at low cost [ideally via a reliable application programming interface (API)]. Standardized electronic filing systems similar to EDGAR are rare. Exceptions include SEDAR in Canada and DART in Singapore. Where such systems do exist, they typically capture only a subset of the corporate reporting package, making data collection and matching extremely costly. [See El-Haj et al. (Citation2019a) for a description of the process for matching U.K. PDF annual reports to financial and market data from Thomson Reuters Datastream.]
Access to text resources (inaccessible file formats): Provision of corporate reports as PDF files is standard practice in most jurisdictions. Even U.S. firms produce glossy PDF annual reports to shareholders that sit alongside their mandatory 10-K filing.Footnote16 Although there are sound reasons why firms distribute content in this format, a major downside is that the scope for automated text processing is severely inhibited. Although tagging procedures can be used to enhance the accessibility of PDF files (e.g. Atalan Citation2011), implementation is time-consuming and consistency is hard to achieve. Ultimately, the PDF file type is unfit for purpose where NLP applications are concerned.
Access to text resources (lack of standardization): Lack of standardization is a pervasive feature of corporate reporting and a major barrier to automated text processing in many institutional settings, particularly when combined with PDF file format. Management typically view the ability to flex disclosure format as an essential part of communicating their entity’s ‘own story’ effectively. While the validity of this argument is hard to dispute, we offer the following three observations in the interest of balance. First, we are not aware of any reliable evidence to indicate that firms operating in jurisdictions where standardized corporate reporting is mandatory (e.g. the U.S.) face communication challenges or competitive disadvantages that systematically harm valuations, or that markets in such settings face lower liquidity. Indeed, anecdotal evidence from (some) professional investors suggests a preference for 10-K style reporting because it helps reduce search costs. Second, it is conceivable that the positive externalities realized by the financial community from big data text applications outweigh aggregate firm-level costs of a more standardized reporting model approach. Third, increasing the degree of standardization in corporate reporting does not mean abandoning reporting discretion; it simply requires discretion to be applied within well-defined reporting constructs.
Access to text resources (diversity of media): Entities are increasingly seeking to leverage technology to enhance dissemination through nontraditional channels such as social media and video (FEE Citation2015). While such approaches offer advantages for traditional users of the reporting package, they also raise challenges for NLP applications in terms of collecting and integrating source data, and processing the resulting content.
Collaboration (interdisciplinary): Applying NLP to financial reporting output is an inherently interdisciplinary process requiring the marriage of domain expertise from financial reporting with advanced NLP skills from computational linguistics. Neither discipline is capable of delivering step-change on its own. However, structures supporting interdisciplinary collaboration are limited. Distinct academic research fields tend to evolve in parallel due to different publication and career progression norms. Where cross-fertilization does occur, it tends to be limited to sharing data and importing established methods rather than true collaborative endeavor. Opportunities for researchers to publish work at the highest level that speaks directly to multiple disciplines are extremely limited, as are formal arrangements for bringing researchers from disparate disciplines together to work on joint problems.
Collaboration (intersectoral): Developing NLP solutions to address financial reporting problems is an inherently applied process. Financial market participants are often best placed to identify opportunities where NLP can add value. They may also control proprietary data resources that form a core input into such applications. Academic researchers, on the other hand, bring cutting-edge knowledge required to address these problems. Progress therefore requires intersectoral collaboration in addition to interdisciplinary cooperation. The chasm between the professional and academic research communities in financial reporting represents a significant barrier to progress, which is reinforced by the incentive structure in financial reporting research that makes publication in international peer-reviewed journals the rational choice over more timely applied work (particularly for early-career researchers).
Overcoming these impediments requires coordinated action by a range of key stakeholders including governments, financial market regulators, preparers, users and academic researchers from various fields. The foresight and investment demonstrated by the SEC in the U.S. stands as a model for other regulators and government departments to replicate. Only through significant developments in data availability and collaborative approaches will the returns to enhanced financial reporting and transparency be realized fully in a digital age.
7. Summary and conclusions
Financial and corporate reporting involves a high degree of natural language content. Moreover, narrative disclosures sit at the heart of evolving reporting areas including governance, remuneration, risk, strategy and business models, climate, and social impact. Such is the scope and multi-channel nature of the corporate reporting package that manual processing of disclosures by domain experts is challenging when operating at the individual entity level and practically impossible when analysing a portfolio of stocks. While natural language processing (NLP) methods developed in computer science and corpus linguistics have been widely applied in areas such as medicine and education, uptake in the financial reporting domain has been surprisingly slow. At the most basic level, NLP technology helps relax human processing constraints and facilitates detection of information that might otherwise be unobservable to a manual reader operating at the individual document level. The increasing application of NLP methods to the outputs of the corporate reporting process creates opportunities and challenges for researchers and financial market professionals alike.
We reflect on the increasing adoption of NLP methods in financial reporting research and discuss the implications for financial reporting regulation of the widespread adoption of this technology. With respect to research, we note that the accounting and finance literature has been slow to adopt mainstream NLP methods, preferring instead to concentrate on research questions involving low-tech measures based on simple bag-of-words approaches, including word counts and readability scores. We highlight the small but growing body of work applying more established NLP techniques including machine learning classifiers and statistical methods for identifying topic structure at the document or corpus level. We review the key aspects of some of the more popular NLP methods applied in the accounting literature including cosine similarity measures of text, supervised classification using Naïve Bayes models, and topic modeling using latent Dirichlet allocation. We emphasize the dangers of researchers adopting a ‘black box’ approach to implementing these methods and stress the importance of transparency when describing the steps and choices involved in applying these techniques.
Increasing adoption of NLP techniques raises fundamental issues for accounting practitioners and regulators. The IASB (Citation2018b), for example, stress the need to distinguish between traditional and digitally sophisticated users of financial information. While traditional users view documents as a linear narrative or a key reference source to be scrutinized manually, digitally sophisticated users apply NLP methods to support analysis on a larger scale. The distinction is important because it highlights the difficulty of servicing users’ diverse information needs via a single reporting model and delivery format. We use the IASB’s Disclosure Initiative (IASB Citation2017) as a framework for illustrating some of these issues. We discuss how the adoption of NLP technology raises fundamental questions about the nature of the disclosure problem as portrayed by the IASB. For example, NLP methods may provide a partial solution to the problem of information overload (too much irrelevant information). Automated text processing may also change how relevant and material information are defined given that relevance is a data-driven construct in an NLP setting where a key goal involves uncovering features in the communication process that are either empirically unobservable at the individual document level or conceptually unclear. We also review how NLP methods affect the definition of effective communication. A key conclusion emerging from our discussion is that policymakers must do more to integrate debate over report content with consideration of how content is best presented because the form in which data are presented and stored fundamentally affects usefulness in a digital setting. More generally, we highlight the importance of low cost and reliable access to digital data as a key factor constraining the benefits of applying NLP methods to process outputs of the financial reporting package.
Finally, growth in automated text processing raises important questions for accounting and finance education. The value of rigorous training in digital data is already clear, with average U.K. graduate salaries in the digital sector exceeding investment banking for the first time in the 2018.Footnote17 Professional bodies’ syllabi are evolving in recognition of the skills demanded by practitioners. For example, the Institute of Chartered Accountants in England and Wales (ICAEW) revised its curriculum in 2018/19 to expand coverage of business analytics, while the Chartered Financial Analyst (CFA) Association added machine learning and artificial intelligence to its candidate body of knowledge from 2019.Footnote18 Such changes create opportunities and challenges for university programmes in accounting and finance. Opportunities include capitalizing on new growth options in an increasingly competitive marketplace, enhancing graduate employability outcomes (which in turn support national and international rankings), and promoting research-informed teaching. Challenges include inertia, a lack of accounting and finance faculty with appropriate skills, a dearth of textbook options, and how best to integrate such material with core topics such as financial reporting, auditing, and financial statement analysis.
Acknowledgements
We are grateful for comments and suggestions provided by the editors, Robert Hodgkinson and participants at the ICAEW’s 2018 PD Leake Lecture.
Additional information
Funding
Notes
1. Automated analysis of text is not new to the accounting literature. An active stream of research using automated content analysis methods has featured in leading European journals such as Accounting and Business Research, European Accounting Review, Journal of Business Finance and Accounting and British Accounting Review for several decades. See Merkl-Davies and Brennan (Citation2007) for a review of this body of work. Many of the issues addressed in this European-based stream of literature such as tone and readability are similar to the questions examined in more recent papers published in leading U.S. journals. See El-Haj, Alves, Rayson, Walker and Young [hereinafter, El-Haj et al. (Citation2019a)] for further discussion.
2. We agree with Loughran and MacDonald’s (Citation2016) recommendation that researchers need to be concerned about replicability, regardless of the methodology employed, and that a well-defined set of ‘best practices’ would be an important development. An excellent example of a ‘best practice’ with respect to corpus replicability is the 10-K and its variants data repository of Bill McDonald (https://sraf.nd.edu/data/stage-one-10-x-parse-data/). This corpus is particularly helpful because each filing document has been cleaned of extraneous text such as HTML code as well as embedded PDF and image files.
3. For example, firms with a primary listing on the London Stock Exchange (LSE) are required by law to include a strategic report in their annual report and accounts [Financial Reporting Council (FRC) Citation2014], together with detailed descriptions of risk management practices, corporate governance arrangements, and executive remuneration policies (FRC Citation2018). Larger LSE-listed firms are also encouraged by stakeholder representative bodies to comply with best guidelines in areas such as workforce reporting (Pensions and Lifetime Savings Association Citation2016).
4. We decompose the annual report into narrative and financial statement components following El-Haj et al. (Citation2019a). The financial statements component includes the primary financial statements, accompanying notes, the auditor’s report, the statement of directors’ responsibilities, and generic shareholder information including financial calendar and form of proxy, The narratives component includes all remaining sections including the chair’s letter to shareholder, management commentary, report of directors, governance statement, remuneration report, principal risk and uncertainties, and other stakeholder disclosures such as environmental and social responsibility commentary.
5. Signposting is different to cross-referencing (FRC Lab Citation2014, p. 16). Signposted information may be located either within or outside the annual report whereas cross-referenced information must be located within the annual report. An annual report component must meet its legal and regulatory requirements without reference to signposted information. Accordingly, signposting is designed to draw shareholders’ attention to complementary information that is related to a matter disclosed in a component of the annual report.
6. For the purpose of this review we define the set of leading journals as The Accounting Review, Journal of Accounting Research, Journal of Accounting and Economics, Journal of Finance, Journal of Financial Economics, and Review of Financial Studies.
7. For example, a statistically significant association related to tone and an attribute of interest is sufficient to conclude relevance, but it is not necessary. By contrast, a non-finding does not allow the researcher to draw a definitive conclusion about the association between tone and the attribute of interest. It is possible that an alternative dictionary could find a significant association.
8. The twelve content categories identified by Li (Citation2010a) are Group 1 (Revenues, Cost, Profits, Operations), Group 2 (Liquidity Investing, Financing), and Group 3 (Litigation, Employees, Regulation, Accounting, Other). These categories are not mutually exclusive. A specific sentence may be classified as belonging to more than one category.
9. Another limitation is that the ability of a model to accurately classify a corpus is based on the assumption that the underlying features in a dataset are independent – an assumption that is frequently violated in practice. The good news is that Rish (Citation2001) demonstrates that NBC tends to perform well even when the independence assumption is invalid.
10. Hoberg and Lewis (Citation2017) use industry and size to identify the set of control documents.
11. The primary users of general purpose financial reporting are present and potential investors, lenders and other creditors, who use that information to make decisions about buying, selling or holding equity or debt instruments and providing or settling loans or other forms of credit (IASB Citation2018a, F OB2). The IASB Conceptual Framework notes that other parties, including prudential and market regulators, employees, customers and suppliers, may also find general purpose financial reports useful, although they are not defined as primary users (IASB Citation2018a, F OB10 and F BC1.20-BC 1.23).
12. The extent to which regulators should actively seek to narrow the gap between digitally sophisticated and traditional investors in this area is an open question. Insofar as the costs of analysing very large corpora are, to a large extent fixed, private investors’ capacity to fully exploit the information in narrative disclosures may be limited, placing them at a disadvantage relative to institutional investors with greater resources. The same concern holds for big data applications more generally and in many respects is nothing new: institutional investors have long enjoyed advantages associated with processing capacity and access to information. We also see scope for growth in third-party providers of text analytics designed specifically to support decision making by unsophisticated investors.
13. For example, Paredes (Citation2003) discusses information overload in the context of regulatory filings.
14. The potential filtering role of NLP should not be interpreted as an invitation for management to pursue a full, unfettered disclosure policy. Bauguess (Citation2016) highlights the risks posed by big data and NLP in terms of encouraging lazy reporting and analysis. We view NLP as a means of improving aspects of financial reporting and analysis, rather than as a panacea for the disclosure problem. Technology cannot solve the disclosure problem by converting inherently poor disclosures into effective communication.
15. The distinction between effective communication viewed from the perspective of a traditional user versus a digitally sophisticated user can be illustrated through the example of infographics. A high proportion of firms use infographics in their annual report to communicate complex ideas such as business models and the value creation process in a simple and intuitive manner. While infographics are encouraged by regulators and advisors as a way of improving reporting quality for traditional users (FEE Citation2015), these features create major problems for NLP applications (particularly where they are embedded in a PDF file format) because the content and relations are hard to preserve when analyzing the data automatically. Paradoxically, therefore, digitally sophisticated users may view simple plain text as more effective communication than richer visual representations.
16. SEC rules require companies to send an annual report to shareholders prior to annual meetings involving election of boards of directors; and proxy rules require reporting companies to post their proxy materials, including their annual reports, on their company website in addition to filing their 10-K with the SEC. Some companies use their annual report filed on Form 10-K to shareholders in lieu of a separate annual report to shareholders. However, many companies produce a separate report which typically contains less detail than the 10-K but usually also includes supplementary material such as a letter to shareholders from the CEO (Dikolli et al. Citation2017), along with context for recent financial performance, infographics and photographs.
17. Based on data supplied by TARGETjobs. See https://targetjobs.co.uk/careers-advice/choosing-an-employer/320357-which-graduate-career-offers-the-best-pay for further details.
18. Details of syllabus changes made by the ICAEW are summarized at https://www.icaew.com/learning-and-development/aca/aca-employers/the-future-professional/technology-and-the-aca/big-data-and-data-analytics. Students registered for CFA exams in 2019 will study a new fintech section that includes topics such as robo advisors, big data, and artificial intelligence (see https://www.cfainstitute.org/en/about/press-releases/2018/aspiring-charterholders-to-see-next-generation-cfa-program-curriculum-in-2019).
19. Various algorithms such as variational inference or Markov Chain Monte Carlo are typically used for inference (see Jordan (Citation1998)).
Related Research Data
References
- Atalan, 2011. Making PDF Documents Accessible with Adobe Acrobat Pro. Available from: www.accede.info/en/manuals/.
- Balakrishnan, R., Qiu, X.Y., and Srinivasan, P., 2010. On the predictive ability of narrative disclosures in annual reports. European Journal of Operational Research, 202, 789–801. doi: 10.1016/j.ejor.2009.06.023
- Bauguess, S.W., 2016. Has big data made us lazy? Speech at Midwest Region Meeting, American Accounting Association (AAA), Chicago, IL. Available from: https://www.sec.gov/news/speech/bauguess-american-accounting-association-102116.html.
- Blei, D.M., Ng, A.Y., and Jordan, M.I., 2003. Latent dirichlet allocation. Journal of Machine Learning Research, 3, 993–1022.
- Brown, N., Crowley, R., and Elliott, W. B., 2017. What are you saying? Using topic to detect financial misreporting. Working paper. Available from: https://ssrn.com/abstract=2803733 or https://dx.doi.org/10.2139/ssrn.2803733.
- Bushee, B. J., Gow, I. D., and Taylor, D. J., 2018. Linguistic complexity in firm disclosures: obfuscation or information? Journal of Accounting Research, 56, 85–121. doi: 10.1111/1475-679X.12179
- Das, S.R., 2013. Text and context: language analytics in finance. Foundations and Trends in Finance, 8, 145–261. doi: 10.1561/0500000045
- Davis, A.K. and Tama-Sweet, I., 2012. Managers’ use of language across alternative disclosure outlets: earnings press releases versus MD&A. Contemporary Accounting Research, 29 (3), 804–837. doi: 10.1111/j.1911-3846.2011.01125.x
- Dikolli, S., Keusch, T., Mayew, W., and Steffen, T., 2017. Using shareholder letters to measure CEO integrity. Available from: SSRN: https://ssrn.com/abstract=2131476.
- Dyer, T., Lang, M., and Stice-Lawrence, L., 2017. The evolution of 10-K textual disclosure: evidence from latent dirichlet allocation. Journal of Accounting and Economics, 64, 221–245. doi: 10.1016/j.jacceco.2017.07.002
- Elliot, R., 1998. Accounting in the 21st century. Saxe Lectures in Accounting, 2 November 1998 Available from: https://www.baruch.cuny.edu/library/alumni/online_exhibits/digital/saxe/saxe_1998/elliott_98.htm.
- El-Haj, M., Alves, P., Rayson, P., Walker, M., and Young, S., 2019a. Retrieving, classifying and analysing narrative commentary in unstructured (glossy) annual reports published as PDF files. Accounting and Business Research, forthcoming.
- El-Haj, M., Rayson, P., Simaki, V., Walker, M., and Young, S., 2019b. Computational analysis of financial narratives: overview, critique, resources and future directions. Working paper.
- European Commission, 2017. Guidelines on non-financial reporting (methodology for reporting non-financial information (2017/C 215/01). Available from: https://eur-lex.europa.eu/legal-content/EN/TXT/PDF/?uri=CELEX:52017XC0705(01)&from=EN.
- European Securities and Markets Authority, 2015. Guidelines on the Use of Alternative Performance Measures. Available from: https://www.esma.europa.eu/system/files/2015-esma-1057_final_report_on_guidelines_on_alternative_performance_measures.pdf.
- FEE, 2015. Cogito Series. The Future of Corporate Reporting – Creating the Dynamics for Change. Brussels: FEE Federation of European Accountants.
- Financial Reporting Council, 2011. Cutting the Clutter. Combating the Clutter in Annual Reports. London: Financial Reporting Council. Available from: https://www.frc.org.uk/getattachment/8250571d-4c6d-4d0a-9aa6-ef6a19c1fab2/Cutting-clutter-report-April-20112.pdf.
- Financial Reporting Council, 2014. Guidance on the Strategic Report. London: Financial Reporting Council. Available from: https://www.frc.org.uk/Our-Work/Publications/Accounting-and-Reporting-Policy/Guidance-on-the-Strategic-Report.pdf.
- Financial Reporting Council, 2015. Clear and Concise. Developments in Narrative Reporting. London: Financial Reporting Council. Available from: https://frc.org.uk/Our-Work/Publications/Accounting-and-Reporting-Policy/Clear-Concise-Developments-in-Narrative-Reporti.aspx.
- Financial Reporting Council, 2018. UK Corporate Governance Code 2018. London: Financial Reporting Council.
- FRC Lab, 2014. Lab Insight Report. Towards Clear and Concise Reporting. London: Financial Reporting Council. Available from: https://www.frc.org.uk/getattachment/4c45a275-cdda-4af0-8676-1fafa78af3bd/FRC-Lab-Towards-Clear-Concise-Reporting.pdf.
- Financial Reporting Council Lab, 2015. Lab Project Report. Digital Present – Current Use of Digital Media in Corporate Reporting. London: Financial Reporting Council. Available from: https://www.frc.org.uk/getattachment/ae48f2db-eb9a-47e5-87f7-d60866a64ae9/Lab-digital-present-report.pdf.
- Goel, S., Gangolly, J., Faerman, S., and Uzuner, O, 2010. Can linguistic predictors detect fraudulent financial filings? Journal of Emerging Technologies in Accounting, 7, 25–46. doi: 10.2308/jeta.2010.7.1.25
- Gow, I. D., Kaplan, S., Larcker, D., and Zakolyukina, A., 2016. CEO Personality and Firm Policies. Available from: SSRN: https://ssrn.com/abstract=2805635.
- Griffiths. T. and Steyvers, M., 2004. Finding scientific topics. Proceedings of the National Academy of Sciences, 101, 5228–5235. doi: 10.1073/pnas.0307752101
- Grossetti, F., Gietzmann, M., Lewis, C., and Pündrich, G., 2019. When Less is Not Necessarily More: Losing Meaning with Dedicated Dictionaries. Unpublished Working Paper.
- Gutierrez, E.F., Minutti-Meza, M., Tatum, K.W., and Vulcheva, M., 2018. Consequences of adopting an expanded auditor’s report in the United Kingdom. Review of Accounting Studies, in press.
- Hoberg, G. and Lewis, C., 2017. Do fraudulent firms produce abnormal disclosure? Journal of Corporate Finance, 43, 58–85. doi: 10.1016/j.jcorpfin.2016.12.007
- Hoberg, G. and Moon, K., 2017. Offshore activities and financial vs operational hedging. Journal of Financial Economics, 125 (2), 217–244. doi: 10.1016/j.jfineco.2017.05.003
- International Accounting Standards Board, 2017. Disclosure Initiative – Principles of Disclosure. Discussion Paper PD/2017/1. London: IFRS Foundation.
- International Accounting Standards Board, 2018a. Conceptual Framework for Financial Reporting. London: IFRS Foundation.
- International Accounting Standards Board, 2018b. Board Minutes. July 2018. Item 11G (Technology and Digital Reporting Considerations). London: IFRS Foundation.
- The International Integrated Reporting Council, 2013. Business Model Background Paper for <IR>. International Integrated Reporting Council. International Integrated Reporting Council. Available from: https://integratedreporting.org/wp-content/uploads/2013/03/Business_Model.pdf.
- Jordan, M., 1998. Learning in Graphical Models, volume 89. Springer Science & Business Media.
- Kearney, C. and Liu, S., 2014. Textual sentiment in finance: a survey of methods and models. International Review of Financial Analysis, 33, 171–185. doi: 10.1016/j.irfa.2014.02.006
- KPMG, 2014. The KPMG Survey of Business Reporting. Available from: https://assets.kpmg.com/content/dam/kpmg/pdf/2014/06/kpmg-survey-business-reporting.pdf.
- Larcker, D. and Zokolyukina, A., 2012. Detecting deceptive discussions in conference calls. Journal of Accounting Research, 50 (2012), 495–540. doi: 10.1111/j.1475-679X.2012.00450.x
- Le, X., Lancaster, I., Hirst, G., and Jokel, R., 2011. Longitudinal detection of dementia through lexical and syntactic changes in writing: a case study of three British novelists. Literary and Linguistic Computing, 26 (4), 1–27. doi: 10.1093/llc/fqr013
- Lee, H., Surdeanu, M., MacCartney, B., and Jurafsky, D., 2014. On the importance of text analysis for stock price prediction. Proceedings of the 9th International Conference on Language Resources and Evaluation, LREC 2014. Reykjavik, Iceland. Available at: https://nlp.stanford.edu/pubs/lrec2014-stock.pdf.
- Lev, B. and Gu, F., 2016. The End of Accounting and the Path Forward for Investors and Managers. New Jersey: Wiley.
- Li, F., 2010a. The information content of forward-looking statements in corporate filings - a naive Bayesian machine learning approach. Journal of Accounting Research, 48 (5), 1049–1102. doi: 10.1111/j.1475-679X.2010.00382.x
- Li, F., 2010b. Textual analysis of corporate disclosures: a survey of the literature. Journal of Accounting Literature, 29, 143–65.
- Loughran, T. and McDonald, B., 2011. When is a liability not a liability? Textual analysis, dictionaries, and 10-Ks. Journal of Finance, 66, 35–65. doi: 10.1111/j.1540-6261.2010.01625.x
- Loughran, T. and McDonald, B., 2016. Textual analysis in accounting and finance: a survey. Journal of Accounting Research, 54 (4), 1187–1230. doi: 10.1111/1475-679X.12123
- Loughran, T., McDonald, B., and Yun, H., 2009. A wolf in sheep’s clothing: the use of ethics-related terms in 10-K reports. Journal of Business Ethics, 89, 39–49. doi: 10.1007/s10551-008-9910-1
- Merkl-Davies, D. and Brennan, N., 2007. Discretionary disclosure strategies in corporate narratives: incremental information or impression management? Social Science Electronic Publishing, 26, 116–196.
- Morunga, M. and Bradbury, M.E., 2012. The impact of IFRS on annual report length. Australasian Accounting, Business and Finance Journal, 6(5), 47–62.
- Organisation for Economic Cooperation and Development, 2017. Guidelines for Multinational Enterprises. Available from: https://www.oecd.org/daf/inv/mne/48004323.pdf?_ga=2.45268260.1897114088.1546178890-1898414720.1542015530.
- Paredes, T. A., 2003. Blinded by the Light: Information Overload and Its Consequences for Securities Regulation, 81 Wash. U. L. Q. 417.
- Pensions and Lifetime Savings Association, 2016. Understanding the Worth of the Workforce: A Stewardship Toolkit for Pension Funds. Available from: https://www.plsa.co.uk/portals/0/Documents/0591-Understanding-the-worth-of-the-workforce-a-stewardship-toolkit-for-pension-funds.pdf.
- Purda, I. and Skillicorn, D, 2015. Accounting variables, deception, and a Bag of words: assessing the tools of fraud detection.”. Contemporary Accounting Research, 32 (3), 1193–1223. doi: 10.1111/1911-3846.12089
- Rashid, A., Baron, A, Rayson, P., May-Chahal, C., Greenwood, P., and Walkerdine, J., 2013. Who am I? analyzing digital personas in cybercrime investigations. Computer, 46, 54–61. doi: 10.1109/MC.2013.68
- Rish, I, 2001. An empirical study of the naive Bayes classifier. In IJCAI 2001 Workshop on Empirical Methods in Artificial Intelligence, 3, 41–46.
- Sebastiani, F, 2002. Machine learning in automated text categorization. ACM Computing Surveys, 34 (1), 1–47. doi: 10.1145/505282.505283
- Siano, F. and Wysocki, P., 2018. The Primacy of Numbers in Financial and Accounting Disclosures: Implications for Textual Analysis Research. Working paper, available at: https://ssrn.com/abstract=3223757.
- United Nations, 2017. UN Guiding Principles Reporting Framework. Shift Project Ltd. and 2015 Mazars LLP. Available from: https://www.ungpreporting.org/wp-content/uploads/UNGPReportingFramework_2017.pdf.
- Young, S., 2014. The drivers, consequences and policy implications of non-GAAP earnings reporting. Accounting and Business Research, 44 (4), 444–465. doi: 10.1080/00014788.2014.900952
Appendices
Appendix 1. Naïve Bayes Classification (NBC)
NBC is a maximum likelihood estimate that is based on an application of Bayes’ rule. To better motivate the underlying intuition for how the classifier works, it is instructive to revisit Bayes’ rule in the context of category classification.
Suppose, for example, that we reduce a document d to a list of words, where is a vector of the frequency that words associated with the ‘vocabulary’ of I words appear in document d. This ‘bag-of-words’ approach implicitly assumes that context is unimportant and that the actual words counts are sufficient to characterize a document.
The goal of NBC is to classify the document into a specific category () from a set of J possible categories (
). The probability that
reflects category j can be defined in terms of conditional probabilities as
(A1)
(A1) and
(A2)
(A2)
Equations (A1) and (A2) can be equivalently written as the probability of attribute conditional on observing word i in document d:
(A3)
(A3)
Consider the simple case where we want to classify the tone of document into one of two categories: positive () or negative (
) having observed word
. The probability that word i is associated with a positive tone is:
(A4)
(A4) and the corresponding probability that word i has negative tone is:
(A5)
(A5) where
(A6)
(A6)
Since classification takes place at the document level, the basic decision rule is to evaluate the probability associated with observing all of the I words in document d conditional on the document’s tone:(A7)
(A7)
The representation in Equation (A6) reflects the assumption that words are generated independently and that has the same value for each word conditional on attribute
. For example, the probability that document d has positive tone is expressed as
(A8)
(A8)
A document is classified as having positive tone if:(A9)
(A9)
otherwise the document is classified as having negative tone. More generally, if there are J categories, the classification problem for document d is to identify the optimal category by solving(A10)
(A10)
A1.#Numerical example
This section illustrates the implementation of a Naïve Bayes Classifier using a simple example that involves a vocabulary of 3 words, a training set of 10 documents and a testing set of 6 documents. reports the characteristics of the training set. For example, document 1 has 83 words and is classified as having negative tone. Words 1, 2 and 3 in document 1 respectively occur with proportions of 11%, 63% and 27%.
Table A1. Likelihood table for training data.
Based on , the unconditional probability of observing a document with negative tone is 40% (4/10) and one with positive tone is 60% (6/10). We also calculate the probability of observing word i conditional on a document with negative tone as
For example, the probability of observing word 1 for documents that are classified as having negative tone in the training set is:
Replicating this calculation for all words in the corpus conditional on tone, we obtain .
Table A2. Conditional probability of observing words conditional on document tone for training data.
The next step is to calculate and
for each document in the training sample. The calculations for document 1 are:
and
The probability that document 1 has negative tone isand the probability it has positive tone is
. A simple comparison of the two estimates indicates that the document 1 is correctly classified as having negative tone. provides tone estimates for all of the documents in the training data and reports that the naïve Bayes classifier has a 90% correct classification rate in sample. Note that the naïve Bayes classifier incorrectly assesses the probability that document 4 has negative tone as only 11% even though it was determined to actually have negative tone.
Table A3. Tone estimates for training data.
Next, we evaluate how well the naïve Bayes classifier performs out-of-sample. reports the word counts for the testing data.
Table A4. Frequency table for testing data.
Using the word counts in , we calculate the analogous tone estimates reported in for the testing data. The out-of-sample tests are based on the assumption that the documents in the training data occur with the same probability as were observed in the testing data, i.e. and
). In addition, we also use the same probability of observing specific words conditional on document tone as reported in . reports that the naïve Bayes classifier has an 83% correct classification rate, indicating that the model works well out-of-sample.
Table A5. Tone estimates for testing data.
Appendix 2. Latent Dirichlet Allocation (LDA)
LDA assumes that the words in different documents are drawn from K topics. The distribution of words can then be characterized as a mixture of these topics such that the probability of observing word is:
where
is a latent variable that indicates the topic from which
was drawn.
is the probability of
in the
topic, and
is the probability that that the word is drawn from that same
topic (see Griffiths and Steyvers Citation2004).
The observable data are contained in a corpus denoted by made by D documents such that
. Each document
is a sequence of
words such that
. Conceptually, a document
is generated by drawing a topic k from the topic distribution and then word
from the word distribution conditional on topic k.
The model is formalized by assuming that for each document there is a multinomial distribution over the K topics with parameter vector
. This implies that word
in document
is selected from topic k with probability
. Intuitively, when we aggregate this probability to the corpus level, we obtain a
matrix
which represents DTWs. For each topic k there is a multinomial distribution over I words with parameter vector
such that
. By aggregating the parameter vector, we obtain a
matrix
which represents the TWWs. LDA estimation is conducted by choosing the optimal values of
and
. To make predictions about the corpus
, we assume that both
and
have Dirichlet prior distributions. The Dirichlet distribution is a natural choice because it is conjugate prior to the multinomial distribution. The output of an LDA estimation that pre-specifies K topics is represented by a
DTW matrix and a
TWW matrix.Footnote19