
 ?Mathematical formulae have been encoded as MathML and are displayed in this HTML version using MathJax in order to improve their display. Uncheck the box to turn MathJax off. This feature requires Javascript. Click on a formula to zoom.
Abstract
We examine the capital market response to the publication of annual reports shortlisted for corporate reporting awards. We find weaker capital market reactions to the publication of shortlisted annual reports compared with a matched sample of non-shortlisted annual reports, consistent with shortlisted reports containing similar or less price sensitive information relative to non-shortlisted reports. Further analysis shows that firms publishing shortlisted reports are more likely to release information to investors in a timelier manner throughout the financial year. We complement our archival empirical analysis with interview evidence from FTSE350 executives and consultants to shed light on the motives for investing in high-quality annual reports. Collectively, our results support the view that high quality annual reporting reflects superior firm-level investor communication processes and that the broader corporate reporting cycle shapes the information role of firm reporting.
1. Introduction
The annual report provides market participants with information to support investment decision-making and stewardship. While some firms adopt a compliance (tick-box) approach to annual reporting, others embrace the opportunity to provide clear, decision-useful disclosures to investors and other stakeholders (PwC Citation2007). The Financial Reporting Council (FRC) seeks to enhance the clarity and usefulness of U.K. annual reports by providing guidance designed to move firms beyond the compliance approach towards providing more innovative and useful disclosures (Deloitte Citation2013, FRC Citation2018). Our goal in this study is to examine the capital market consequences of high-quality annual report commentary.
The annual report represents a key disclosure in the corporate reporting cycle. Annual reports are a legal requirement for firms in most jurisdictions and although shareholders are the legislative focal point, a broad set of stakeholder groups use the information in these documents (Rowbottom and Lymer Citation2010).Footnote1 In the U.K., regulators shape content through guidance and broad content requirements, while granting management substantial discretion to tailor disclosure content, format, and presentation to firms’ business model and environment (El-Haj et al. Citation2020). Not surprisingly, therefore, reporting content, transparency, and presentation style vary substantially across firms and over time.
While the annual report consumes significant management time and resources to produce, research provides mixed results on its usefulness for capital market participants (Rippington and Taffler Citation1995). A popular view is that the annual report represents a stale source of information, with most content emerging throughout the firms’ reporting cycle via more timely communication channels (PwC Citation2010). From this viewpoint, the annual report is primarily a summary document that provides contextual material that aids interpretation of more timely information signals. Evidence nevertheless reveals scenarios where annual reports play an important information role (Brown and Tucker Citation2011, Drake et al. Citation2016). Despite management investing significant resources to produce the annual report, surprisingly little work examines the impact of annual report quality on capital market outcomes. We seek evidence on the capital market consequences of high-quality annual reporting. Specifically, we examine whether reports that are shortlisted for an award contain more price-sensitive information than non-shortlisted reports.
We follow prior research and use annual reporting awards to proxy for high quality reporting (Lang and Lundholm Citation1993, Citation1996, Sutley Citation1994, Healy and Palepu Citation2001, Botosan and Plumlee Citation2002, Brown and Hillegeist Citation2007, Cooper and Owen Citation2007). We combine awards from six different U.K. awarding bodies to minimise the risk that ratings reflect the idiosyncratic incentives of a particular awarding entity rather than intrinsic reporting quality. Our final sample comprises annual reports published by FTSE350 firms and shortlisted for an award between 2007 and 2019 by at least one of the following six award schemes: PriceWaterhouseCoopers (PwC) Building Public Trust Awards, Investor Relations (IR) Society Annual Awards, ICSA Hermes Transparency in Governance Awards, Communicate Magazine, Accountancy Age, and Report Watch.Footnote2
As management exercises discretion over report content, format and style, annual report quality is not randomly assigned. We adopt a matching strategy to mitigate the risk that systematic firm differences, rather than reporting quality, drive observed capital market outcomes. Specifically, we use propensity score matching to pair each shortlisted firm-year observation with a non-shortlisted firm-year observation displaying similar observable characteristics. We use this matched sample to examine the capital market reaction at both the earnings announcement date and the annual report release date because earnings are typically released before the annual report, and selected commentary from the annual report is used to contextualise firm performance in the earnings announcement press release.
Results provide a mixed picture. We find lower absolute abnormal returns and abnormal number of trades around the earnings announcement for award-shortlisted firms relative to matched non-shortlisted firms. We find no significant differences in the capital market effects of award-shortlisted relative to non-shortlisted firms around the annual report publication date. Taken together these results suggest that annual reports of award-shortlisted firms contain similar or less price sensitive information relative to non-shortlisted firms.
Our findings contrast with extant research suggesting that higher quality narrative disclosures are more informative (Baginski et al. Citation2004; Brown and Tucker Citation2011). One plausible explanation for this inconsistency is that high quality annual reports proxy for more timely and transparent reporting throughout the fiscal year, meaning shortlisted firms simply have less price-sensitive information to disclose in their annual report. We test this conjecture using a measure of disclosure timeliness from Beekes and Brown (Citation2006). Specifically, we test whether award-shortlisted firms display incrementally higher disclosure timeliness throughout the fiscal year. We find that award-shortlisted firms release price-sensitive information more promptly during the financial year relative to their non-shortlisted counterparts. Our evidence supports the view that high quality annual reports are a product of firms’ superior approach to investor communication more generally.
Since we do not find evidence of incremental informativeness in award-shortlisted annual reports and because anecdotal evidence suggests that preparing high quality annual reports is a costly endeavour, we supplement our archival empirical analysis by interviewing financial reporting consultants and FTSE350 executives to better understand the motive(s) for investing in high quality reports. Respondents indicate that annual reports primarily target potential investors and employees, and that the process of compiling the annual report is less costly for firms with a superior ongoing communication strategy.
We make three contributions to the literature. First, we place annual reports in a broader disclosure context. Our results support the view that annual report quality offers a window into the firm’s broader communication quality, and that annual report narratives provide a summary of publicly available information to help investors interpret real information signals more easily (Hines Citation1982). Practitioners have long viewed the annual report as a confirmatory document that summarises relevant prior disclosures, rather than as a source of new information (PwC Citation2010, O’Sullivan Citation2017) and our findings support this view. In this respect, we show that high quality annual report disclosure does not automatically translate into more informative reporting. For example, higher quality annual reports might provide a superior summary of previously disclosed information or provide better contextual information for interpreting future information signals. Hence, quality is not necessarily synonymous with informativeness in the context of annual reports.
Second, we contribute to the literature examining the market effects of disclosure quality. Specifically, using awards to proxy for quality we investigate the market effects of annual report quality. In so doing we address the call from both practitioners and academics (e.g. O’Sullivan Citation2017) for research examining how the quality of disclosures influence capital market participants. We find some evidence of weaker capital market reactions for award-shortlisted firms relative to non-shortlisted firms, in-line with the view that the annual report is a confirmatory document rather than a source of new information. In this respect, we provide evidence that firms disclosing high quality annual reports are more likely to release price sensitive information through more timely channels.
Third, we propose narrative reporting awards as an alternative measure of the quality of U.K. annual reports. While most extant literature examining the reporting quality of U.K. firms has either used small-sample hand-coding to define attributes of narrative reporting quality (e.g. Clatworthy and Jones Citation2001, Citation2003, Linsley and Shrives Citation2006, Abraham and Cox Citation2007, Linsley and Lawrence Citation2007) or researcher-driven interpretations of narrative reporting quality (e.g. Beattie et al. Citation2004; Anis et al. Citation2012), we use a measure that is less susceptible to researcher bias. Specifically, award criteria are publicly available and guidance on the content and style of high-quality annual report narratives is provided. Further, awards provide a parsimonious measure to score long and complex disclosures. This in turn opens new opportunities to study a cornerstone of the corporate reporting cycle.
The remainder of this study is organised as follows: Section 2 provides an overview of prior literature relating to the informativeness of the annual report and measures of reporting quality; it provides an overview of the U.K. annual reporting awards and sets out the hypotheses tested in the study; Section 3 discusses the research design; Section 4 describes the data used in the study and presents the summary statistics; Section 5 reports the findings of the study including additional analysis on timeliness of information disclosure. Section 6 discusses the results of interviews held with practitioners while Section 7 concludes.
2. Literature review and hypothesis development
2.1. Informativeness of annual report narratives
Epstein and Schneider (Citation2008) theorise that annual report narratives and accompanying audit opinion are a highly reliable source of information for investors that leads to more portfolio rebalancing than other sources of firm information. Specifically, public information disclosures give rise to increased trading volume and returns.Footnote3 Extant research provides evidence that high-quality 10-K reporting by U.S. registrants contains incremental information that affects market participant decision-making (Lang and Lundholm Citation1996, Healy and Palepu Citation2001). For example, analyst rankings of 10-K reports correlate positively with analyst forecasts and negatively with cost of capital and information asymmetry (Lang and Lundholm Citation1996, Botosan and Plumlee Citation2002, Brown and Hillegeist Citation2007). Similarly, comparability of annual financial statement information, which benefits users by reducing processing costs and increasing information availability, correlates positively with analyst forecast accuracy (De Franco et al. Citation2011); and a balanced tone in 10-K management discussion and analysis (MD&A) is associated with higher abnormal trading volume (Loughran and McDonald Citation2011). Brown and Tucker (Citation2011) document that stock prices respond to year-on-year modifications of the MD&A section in the 10-K filing but that the usefulness of this section declines over their 10-year sample period as timelier information sources emerge.
Empirical evidence of capital market reactions to U.K. annual report disclosures varies (Firth Citation1981, Rippington and Taffler Citation1995). Hussainey and Mouselli (Citation2010) find no market reaction to the quality of annual report narratives but report lower cost of capital for firms that disclose more forward-looking information. Conversely, Yekini et al. (Citation2016) find a positive association between the tone of annual report narratives for U.K. FTSE350 firms and market reactions around disclosure dates. The authors conclude that the tone of annual report narratives conveys price sensitive information. On the other hand, practitioners contend that high-quality annual reports provide a contextual reference point for investors rather than a timely source of new information (O’Sullivan Citation2017). This view characterises the role of the annual report as providing firm-specific contextual information, reassuring investors by bringing together annual messaging into a consistent narrative and providing a window into corporate culture (PwC Citation2010).
2.2. Measuring the quality of annual report narratives
Most research on U.K. annual reports uses hand-coding methods applied to small samples to define the attributes of narrative reporting quality including corporate social and environmental responsibility disclosures (Gray et al. Citation1995), risk reports (Linsley and Shrives Citation2006, Abraham and Cox Citation2007, Linsley and Lawrence Citation2007), accounting ratio disclosures (Watson et al. Citation2002), tone, self-serving attribution bias, and variation of readability within the annual report (Clatworthy and Jones Citation2001, Citation2003). In a similar vein, Jones (Citation1988) reports a case-study analysis of longitudinal trends in the chair’s letter for a single U.K. firm.
Extant large-sample (computerised) research on U.K. narrative reporting quality has relied on theory-driven quality proxies. Hussainey et al. (Citation2003) find no association between earnings response coefficients (ERCs), the strength of connection between current stock returns and future earnings changes, and forward-looking orientation using a self-designed metric for overall narrative annual report quality. They do, however, report a positive association using a measure of forward-looking statements. The authors attribute this inconsistency to noise in generic quality metrics. Further work suggests that the informativeness of forward-looking statements for future earnings is limited to loss-making firms (Schleicher et al. Citation2007).
Beattie et al. (Citation2004) and Anis et al. (Citation2012) suggest multi-dimensional proxies for narrative reporting quality. These proxies’ benefit from a more holistic definition of quality but remain researcher-driven interpretations of narrative reporting quality. Anis et al. (Citation2012) model their definition of quality using the Accounting Standards Board (ASB) guidance on the Operating and Financial Review (ASB Citation2006) and measure seven additional attributes: forward-looking orientation, verifiability, relevance, supplementation to the financial statements, understandability, balance and neutrality, and comprehensiveness.
While to our knowledge, ours is the first study to use practitioner ratings to capture annual report narrative quality for U.K. firms, awards and rankings are widely accepted proxies for quality in extant research because they reduce the potential for researcher bias and draw on the expertise of industry professionals (Deegan and Carroll Citation1993, Healy and Palepu Citation2001, Leuz and Wysocki Citation2008). For example, the U.S. Association for Investment Management Research – Financial Analysts Federation (AIMR-FAF) rankings are found to be positively associated with analyst accuracy and earnings returns coefficients, and negatively associated with analyst dispersion, probability of informed trading (PIN), cost of capital, and volatility in forecast revisions (Lang and Lundholm Citation1996, Botosan and Plumlee Citation2002, Gelb and Zarowin Citation2002, Byard and Shaw Citation2003, Brown and Hillegeist Citation2007). Although awards differ from rankings due to their nature, both approaches rely on scoring by financial reporting experts that identifies a subset of high-quality reporters.Footnote4
While research in the U.S. setting suggests that the quality of 10-K narratives captured by external ratings has economic consequences, there is reason to expect that regulatory differences between the U.S. and U.K. will affect (1) the attributes of high-quality narrative reporting quality and (2) capital market effects. Inferences from U.S. studies may therefore provide an incomplete picture for settings such as the U.K. where annual reports differ markedly from 10-K filings. Specifically, extant research suggests that U.K. and U.S. annual reports differ significantly in the placement, volume, topical emphasis, and vocabulary of environmental disclosures (Holland and Boon Foo Citation2003), use of graphs (Beattie and Jones Citation1997), and tendency to provide risk, uncertainty, and forward-looking information (Collins et al. Citation1993). Differences in annual report narratives are attributed to regulatory, cultural, and legal differences between the U.S. and U.K. (Collins et al. Citation1993, Beattie et al. Citation2008).
The U.K. offers an interesting setting to examine outcomes of high-quality annual reporting because management enjoy significantly more freedom over annual report content and presentation compared with U.S. registrants. Accordingly, the quality of U.K. annual reports varies considerably, creating richness in the data. Although prior U.K. research employs theory-driven attributes of high quality, it has not adopted a proxy for overall annual report narrative quality that mitigates researcher bias. Our research examines the market effects of annual report disclosure as a function of annual report quality.
2.3. Overview of U.K. annual report awards
This section discusses the U.K. annual report awards. We draw information from conversations with award-granting bodies and public disclosures of award-granting bodies. We acknowledge, however, that certain aspects of the awards are opaque and as such our understanding of the award processes including potential for measurement error or bias in the assessment of annual report quality is incomplete.
The PwC Building Trust Awards were established in 2002 to raise awareness of best practice reporting. Other U.K. organisations have subsequently developed their own awards to highlight different aspects of corporate reporting (e.g. online reporting or corporate governance reporting), as well as best practice reports based on overall quality. Awards for overall annual report quality are the focus of our analysis.
Awards underline the position of award-granting bodies as leaders in U.K. corporate reporting. Awarding institutions typically provide consultation services and professional development products, and benefit from a leadership position in this area. Additionally, the awards gala gives partners and consultants an opportunity to socialise with (potential) clients.
Awards criteria are based on outreach and research with the investment community and long-term experience with corporate reporting. Award checklists are driven by globally recognised good practice and investor needs. This differs from the AIMR-FAF analyst rankings of annual reports which have been used in academic studies examining the U.S. setting. Specifically, the U.K. annual report awards adopt an investor focus where award-granting organisations purport to represent a broad set of users including (potential) investors who are likely to rely on the annual report to make long-term investment decisions (PwC Citation2022). Conversations with award-granting bodies suggest that they expect award criteria to be similar across various U.K. corporate reporting awards.
While some awards like the PwC Building Trust Awards and ICSA Hermes ‘Best Annual Report’ are comprehensive (i.e. every firm in the FTSE350 is judged), others rely on nominations (typically in the form of self-nomination). Firms are incentivized to self-nominate to receive valuable feedback to improve their annual report, although they primarily benefit from publicity and legitimacy. Specifically, an award shortlisting provides external validation from experts in corporate reporting to build trust with (potential) investors. Awards are good social media publicity and a stamp of approval for the next year’s annual report (IR Society Citation2022).
Typically, award entries are first judged by a committee of internal experts who compile an initial shortlist, which is then subject to review by an external panel of expert judges to determine a winner. For example, internal reviewers for the PwC Building Trust Award are firm managers or partners who either hold an accounting designation or possess significant experience as financial analysts or management consultants. These reviewers are tasked with examining each annual report on the FTSE350 to compile a shortlist of best practice candidates. A panel of external experts then reviews the PwC shortlist to determine the winner. Appendix 1 provides information on each of the six U.K. corporate reporting awards we use to construct our sample, including whether the award is nominated, the judging criteria applied, and the use of an external judging panel.
2.4. Hypothesis development: share price revisions
Share price revisions follow changes in investor expectations. The accounting literature uses absolute abnormal returns to test for changes in investor expectations to information disclosure. Cready and Mynatt (Citation1991), Griffin (Citation2003) and Li and Ramesh (Citation2009) find significant absolute abnormal returns around 10-K filings, consistent with investors viewing information reported therein as useful. Rippington and Taffler (Citation1995), in contrast, find little evidence of absolute abnormal returns in response to the publication of the annual report in the U.K.
If high-quality annual report narratives, proxied by award shortlisting, have incremental information content over peer firms’ reports then we expect to observe a stronger market response around the release of shortlisted reports. Empirically, narrative reporting quality in 10-K filings correlates with lower cost of capital (Botosan Citation1997, Botosan and Plumlee Citation2002, Hail Citation2002), while the extent of new information in 10-K reports correlates with higher absolute abnormal returns (Baginski et al. Citation2004, Brown and Tucker Citation2011).
On the other hand, if the objective of the annual report is to provide contextual information about a firm and its operations then high-quality reports will not necessarily contain more price-sensitive information. Accordingly, Rippington and Taffler (Citation1995) find muted market reactions around the publication of U.K. annual reports, which they interpret as evidence that U.K. annual reports provide confirmatory data rather than new information. Drawing on these findings, higher quality annual reports providing superior confirmatory data should not generate incremental market reactions around their publication date.
Since extant research provides mixed evidence on the effects of annual report narrative quality on market returns, we formalise our hypothesis on the price impact of high-quality annual reporting in the null form:
H1: Firms issuing high-quality annual reports experience similar absolute abnormal returns to their peers at the report publication dates.
2.5. Hypothesis development: trading volume
Extensive research on information-driven trading volume documents a strong positive association between trading volume and absolute price changes (e.g. Karpoff Citation1987, Schwert Citation1989, Gallant et al. Citation1992, Lerman and Tan Citation2019). Theory posits that trading volume around information events such as earnings announcements is a function of (1) information content; (2) pre-announcement differences in the precision of private information sets, and (3) belief divergence to information (Beaver Citation1968, Karpoff Citation1986, Holthausen and Verrecchia Citation1990, Kim and Verrecchia Citation1991, Harris and Raviv Citation1993, Atiase and Bamber Citation1994, Kandel and Pearson Citation1995).
The information content perspective suggests that if high-quality reports contain price-relevant information, they will generate incrementally higher absolute trading volume and absolute returns at the report publication date. Conversely, pre-announcement differences in the precision of private information and belief divergence relaxes the dependence between volume and price. Specifically, trading volume increases are a function of the variance in beliefs, whereas price and changes therein are a function of average beliefs. Annual reports may provide additional information on financial statement line items and their performance implications that help investors interpret a prior earnings announcement. If high-quality reports do not contain price-sensitive information but instead provide contextual information, then it is possible to observe abnormally high trading volume around the report release date even in the absence of significant absolute abnormal returns. Specifically, we will observe abnormally high trading volume if high-quality annual reports help investors reinterpret existing information. On the other hand, if high-quality annual reporting is an observable outcome of a long-term commitment to a high-quality investor communication strategy, then high-quality annual reports may simply provide contextual information which is already known by the market. In this case the publication of an annual report will not change existing beliefs and will not elicit abnormally high trading volume. Indeed, if award-shortlisted reports provide a clearer and more comprehensive summary of information emerging during the reporting period, then it is possible that these reports generate a less pronounced reaction relative to non-shortlisted reports that contain more surprise disclosures. The impact of high-quality annual reports on trading volume is therefore unclear.
Changes in trading volume can take the form of changes in turnover (the value of trades) and/or changes in the number of trades. We consider both dimensions of volume in our study. Since the effect of the issue of high-quality annual reports on abnormal trading volume is unclear, we formalise our hypothesis on the relation between high-quality annual reports and both abnormal trading turnover and abnormal number of trades in the null form:
H2a: Firms issuing high-quality annual reports experience similar absolute abnormal trading turnover to their peers at the report publication dates.
H2b: Firms issuing high-quality annual reports experience similar absolute abnormal number of trades to their peers at the report publication dates.
3. Methodology
We test hypotheses using a compilation of U.K. annual report awards to proxy for high-quality reporting and an event study approach focusing on the annual report release date. A subset of annual report commentary often appears first in the earnings announcement and as such, the earnings announcement date may serve as a timelier proxy for disclosure of annual report content. We therefore also examine the market reaction to annual reports conditional on report quality at the earnings announcement date. We use propensity score matching (PSM) to assign a control observation to each award-shortlisted report and then test for differences in announcement-period absolute abnormal returns, abnormal trading turnover and abnormal number of trades between the award-shortlisted and non-shortlisted report samples.
3.1. Proxy for annual report quality
We use a compilation of U.K. reporting awards from 2007 to 2019 to proxy for annual report quality. There are six annual report narrative awards/rankings in the U.K.: the PriceWaterhouseCoopers (PwC) Building Public Trust Awards, Investor Relations (IR) Society Awards, ICSA Hermes Transparency in Governance Awards, Communicate Magazine, Accountancy Age, and Report Watch. Each of these organisations (except Report Watch) annually identifies the highest quality annual report narratives in the FTSE350 index and publishes a shortlist of between three and ten firms as potential award winners. We compile shortlisted firms from the 2007 through 2019 awards cycles and classify these as high-quality annual reports.
Award criteria are publicly available with guidance on the content and style of high-quality annual report narratives (See Appendix 1 for further details of the awards processes). In particular, awards stipulate that narrative content should report on market environment, strategy, business model, risks, and performance (PwC Citation2014). Firms need to explain how they create value, how they measure progress on their objectives, and how risks are managed (IR Society Citation2015). Stylistically, narratives should be integrated and presented as a coherent whole (‘joined up’) without jargon or boilerplate language (ICSA Citation2014, PwC Citation2014). Integration may be evidenced by consistent messaging and connectivity of information (i.e. referencing an original occurrence of information rather than repeating it) between sections of the narrative report.
While we acknowledge that our compilation of U.K. awards might be noisy and represent an incomplete proxy of narrative quality due to human error and private incentives of awarding institutions, it nevertheless has the advantage of being less reliant on researcher judgement. Further, awards are established and implemented by practitioners who are experts in analysing financial information, familiar with U.K. industry-specific trends, and have extensive auditing or consulting experience relating to top-level organisational strategy and business models. Although award-granting organisations in the U.K. could use these awards to establish themselves as experts, create visibility, and gain clients, they also have incentives to preserve the legitimacy of the awards, their organisation’s reputation, and their professionalism by presenting reliable results. Although research has not made use of U.K. annual report awards, the strategy of using awards to proxy for reporting quality is common in other settings including Australian government reporting (Ryan et al. Citation2002), sustainability reporting (Cooper and Owen Citation2007), and Canadian annual reporting (Sutley Citation1994).
3.2. Matching method
Annual reporting quality is not randomly assigned. Rather, firms choose the amount of information they disclose and the clarity of exposition. It is therefore difficult to isolate the effect of annual reporting quality on market outcomes since many characteristics that affect a firm’s propensity for enhanced disclosures also determine market outcomes.Footnote5 Cohen (Citation2008) and Larcker and Rusticus (Citation2010) criticise the disclosure literature for failing to account for endogeneity in the research design. Propensity score matching (PSM) reduces differences between the treatment (i.e. award-shortlisted) group and peer firms. Specifically, PSM matches treatment and control firms using a vector of covariates that determine the probability of award shortlisting. The resulting treatment and matched control groups should have the same probability of issuing a high-quality report.Footnote6 We apply a propensity score model that matches firms on characteristics that associate with annual report quality, using nearest neighbour matching with replacement.Footnote7
Extant research identifies several firm characteristics that likely affect both reporting quality and market valuation. We therefore consider each of these potential firm-level determinants in the following probability model:
(1)
(1) Equation (1) expresses the log of the odds that an annual report is award-shortlisted as a function of FIRM CHARACTERISTICS, time fixed effects (TIME) and industry fixed effects (IND).Footnote8 FIRM CHARACTERISTICS include the following covariates: firm size (SIZE), analyst following (ANALYST), earnings surprise (EARN_SUR), earnings variation (EARN_VAR), earnings loss (LOSS), earnings loss in the previous fiscal year (LOSS_lag1), share price volatility (PRICE_VOL), performance (PERFORM), change in performance (ΔPERFORM), intangibles (R&D), complexity of operations (COMPLEX), leverage (LEVERAGE), trading volume (TRADE_VOL), auditor (PWC, DELOITTE, EY, KPMG), accounting system (US_GAAP), corporate blockholdings (CO_BLOCK), investment company blockholdings (IC_BLOCK), employee and family blockholdings (EMP_BLOCK), other blockholdings (OTH_BLOCK), pension fund blockholdings (PF_BLOCK), government blockholdings (GOV_BLOCK), foreign shareholding (FOR_SH), and a suite of corporate governance variables. Governance variables comprise diversity measures for inside and outside director age, education, nationality, and gender; CEO/Chairman duality; and the percentage of executive board members. Appendix 2 lists the firm characteristics in our analysis, their definition, predicted sign, and theoretical link with reporting quality.
3.3. Capital market outcomes
We measure absolute abnormal returns, abnormal trading turnover and abnormal number of trades using an event window starting two days before the earnings announcement or annual report release day (t – 2) and ending one day after (t + 1).Footnote9 We obtain data on price, turnover and number of trades from Refinitiv Datastream. Absolute abnormal returns are calculated using the market model (Cready and Mynatt Citation1991, Griffin Citation2003, Li and Ramesh Citation2009) in Equation (2) and are defined as absolute market-adjusted returns over the four-day window from time t – 2 to t + 1.
(2)
(2) where Rid is the market return for firm i on day d (Datastream: ReturnIndex) and RMd is the return on the FTSE350 index on day d. If the annual reports of award-shortlisted firms provide more (or less) information to the market relative to non-shortlisted firms, then we expect to reject H1 in favour of the alternative hypothesis that announcement-period absolute abnormal returns for high quality annual reports differ from their matched counterfactuals.
We compute abnormal trading turnover and abnormal number of trades over the same four-day window as absolute abnormal returns, relative to the earnings announcement date or the annual report release date. We set the baseline level of normal trading turnover and the normal number of trades for each firm equal to average trading volume over the 90 trading days ending 17 trading days prior to the earnings announcement date. Following Bailey et al. (Citation2003, Citation2006), average daily abnormal trading turnover (AT) for each firm event (EA and AR release) is defined as:
(3)
(3) while average daily abnormal number of trades (ANT) for each firm event (EA and AR release) is defined as:
(4)
(4) where VOLid in Equation (3) is trading turnover (Datastream: Volume) for firm i on day d and NTid in Equation (4) is number of trades (Datastream: NT). The numerator in Equation (3) (Equation (4)) is the event period trading turnover (number of trades) and the denominator is a scaler for normal trading turnover (number of trades) in the non-event window t-106 to t-17. H2a (H2b) is rejected if the abnormal trading turnover (number of trades) around the annual report publication dates for issuers of high-quality annual reports is statistically different from that of their matched counterfactuals.
4. Sample and matching procedure
4.1. Sample and data
To proxy for high-quality annual report narratives, we identify firms that are shortlisted for an annual reporting award from awarding organisations’ websites.Footnote10 Judging for most awards occurs between May and September in year t with the aim of evaluating nominees with fiscal year-ends between 1 April t – 1 and 31 March t. Accordingly, we define reporting year t in our analysis to include reports with fiscal year-ends falling within the 12-month period ending 31 March in year t.Footnote11
Firms’ annual report quality tends to be sticky over time (Brown and Tucker Citation2011) and therefore it is likely that a firm issuing a shortlisted report in year t discloses high-quality reports throughout the sample period (although they may not be shortlisted for an award every year).
provides a flowchart that classifies firm-year observations into three categories: shortlisted firms in an award year (C1), non-shortlisted firms which have been shortlisted in the four years (two years before and two years after) around the award year (C2), and non-shortlisted firms that have not been shortlisted during the four-year window (two years before and two years after) around the award year (C3). FTSE350 constituent firm-years comprise 4,550 observations over the period 2007–2019. From these, 484 observations relate to award-shortlisted firms and 4,066 observations relate to non-shortlisted firms. shows that after dropping observations due to missing identifiers, observations for investment trusts and hedge fund firms, and observations with missing data, our final sample consists of 393 award-shortlisted observations and 2,374 non-shortlisted observations. We refine the control sample to exclude 437 non-shortlisted reports issued by shortlisted firms (C2) to reduce the likelihood of matching high-quality reports to treatment reports. The final sample available for matching therefore comprises 1,937 firm-year observations.
Figure 1. Decision tree for categorising FTSE350 firm-year observations. Year t is the award year (2007–2019). This figure provides a framework for classifying firms into three categories based on (a) whether the firm was shortlisted for an award in year t and (b) whether it was shortlisted for an award in either the two previous years (t−2 or t−1) or the two subsequent years (t + 1 or t + 2). Category one (C1) consists of firms that was shortlisted in year t. Category two (C2) consists of firms that were not shortlisted in year t but shortlisted in the 5-year window t−2 to t + 2. Category three (C3) consists of firms that have not been shortlisted for an award in the period t−2 to t + 2.
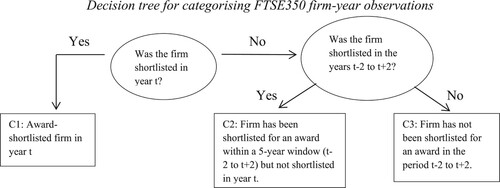
Table 1. Sample size and classification.
reveals 134 unique firms account for the 393 award-shortlisted observations in our sample. also presents the frequency of annual nominations by firm: 51 firms receive a single nomination while 83 firms are shortlisted in at least two years. These firms relate to 342 of the 393 award shortlisted observations in our sample.
Table 2. Firm awards over the sample period.
presents the number of years that shortlisted firms and never-shortlisted firms appear in our sample. Firms do not feature in years where data are unavailable or where the firm drops out of the FTSE350 index. reports that our sample consists of 1,261 firm-year observations for 134 shortlisted firms and 1,506 observations for 257 never-shortlisted firms.
Table 3. Duration of firms in the sample period (2007–2019).
4.2. Descriptive statistics for award-shortlisted firms
This section describes the sample of award-shortlisted firms. reports descriptive statistics by SIC industry division and award-year. Shortlisted observations are most prominent in Division 4 (manufacturing) and Division 8 (finance/insurance/real estate) with 96 and 89 award-shortlisted observations, respectively. Conversely Division 5 (transportation, communications, electric, gas and sanitary services) has the highest number of shortlisted observations relative to division size. The regulated and publicly accountable nature of these industries may explain their propensity for high-quality disclosures (Eng and Mak Citation2003). The frequency of shortlisted observations increases in the later period of our sample period, coinciding with growth in the number of awarding organisations (i.e. IR Society in 2009, ICSA Hermes in 2010, and Communicate Magazine in 2012).
Table 4. Distribution of industry division by award-year.
provides information on the frequency of shortlisted reports by awarding organisation and year. Overlap occurs where firms are shortlisted by at least two awarding organisations in the same year. Communicate Magazine and Report Watch contribute the most award observations (114 and 147 observations, respectively) while Communicate Magazine and PwC have the most overlap award observations with at least one other organisation (61% and 51% of their shortlists, respectively).Footnote12 If awarding organisations act independently then overlap in shortlisting signals agreement among experts about the nature and measurement of annual report quality.
Table 5. Distribution and overlap of award observations by year.
4.3. Matching process
This section summarises firm-level determinants of high-quality reporting and reviews the matching process. reports descriptive statistics and pooled tests of difference for variables in Equation (1) between award-shortlisted (AWARD = 1) and non-shortlisted (AWARD = 0) firms. Significant differences across the following firm characteristics are evident: SIZE, ANALYST, EARN_VAR, PRICE_VOL, R&D, COMPLEX, LEVERAGE, TRADE_VOL, PWC, KPMG, US_GAAP, CO_BLOCK, IC_BLOCK, EMP_BLOCK, OTH_BLOCK, PF_BLOCK, GOV_BLOCK, ED_AGE, NED_AGE, ED_ED, NED_ED, ED_GENDER, NED_GENDER, ED_NATION, NED_NATION and ED_RATIO. These differences suggest that award-shortlisted firms are different from non-shortlisted firms, and that without matching it is not possible to attribute capital market reactions around the annual report publication dates to annual report quality. Through matching, we aim to compare the capital market reactions around the annual report publication date for similar firms.
Table 6. Tests of difference before matching
presents the regression analysis including firm-level determinants of high-quality reporting. In column (1) we estimate Equation (1) including all firm characteristics discussed in Section 3.2. Results for this specification are largely in line with expectations. Specifically, SIZE, ANALYST, PWC, PF_BLOCK, ED_ED and ED_RATIO are positively related to the probability of being shortlisted, while R&D, COMPLEX, CO_BLOCK, IC_BLOCK, EMP_BLOCK, OTH_BLOCK, ED_AGE, NED_AGE, and NED_GENDER have a negative impact on the probability of being shortlisted. A test for the joint significance of both time and industry fixed effects suggests that these are significantly related to the probability of being award-shortlisted. To avoid overfitting, we estimate a parsimonious version of the model that includes only the determinants in column (1) which are statistically significant at the 10% level or better. To mitigate underfitting, to this specification we separately add each determinant which was insignificant in column (1) to ensure it remains insignificant in the parsimonious model. The specification in column (2) includes all significant covariates in column (1) plus TRADE_VOL, the only other variable that was subsequently significant when separately added back to the parsimonious model. Results in column (2) are in line with the results in column (1). Specifically, significant determinants in column (1) remain significant and with the same sign in column (2).
Table 7. Regression analysis: firm-level determinants of high-quality.
The matching process involves two steps. Step one is a direct match on binary variables (PwC, industry, and time), followed by a match on propensity score in step two. We match cases by industry and PwC because results in identify these features as important determinants of being shortlisted for an award. We match observations by award-year to be consistent with the awards process, which determines award shortlists within a regular 12-month cycle. Matching by year may also mitigate the effect of temporal factors such as changes to best practice reporting, market environment, and the economy. The propensity score (p-score) in step two is the probability of being shortlisted for an award computed from the stepwise regression in . Applying nearest neighbour matching with replacement and a caliper of 0.045 yields 161 matched (322 total) firm-year observations.
We report tests of differences in the p-score and covariates to help evaluate the validity of our match. reports paired tests of differences after matching. As intended, the difference in the covariate means between the treatment and control groups after matching is insignificant for most variables. The only covariates where the difference in means remains (marginally) significant are EARN_SUR, LOSS and LEVERAGE. Specifically, award-shortlisted observations have lower earnings surprise, higher incidence of losses, and higher leverage. These variables were not significant in the stepwise regression in , hence were not included in the computation of the p-score used in matching observations. Results suggest the match is successful at eliminating a high fraction of the differences between the treatment and control samples.Footnote13
Table 8. Tests of difference after matching.
also tests for relative differences in the timing of the earnings announcement and annual report releases. We present results for the difference in days between (1) the fiscal year-end and the earnings announcement date; (2) the earnings announcement and the annual report publication; and (3) the fiscal year-end and the annual report publication. While we do not observe any differences between the treatment and control groups with respect to the period between the fiscal year-end and earnings announcement, the interval between the earnings announcement and the annual report publication date is shorter for award-shortlisted firms.
5. Results
This section provides evidence of the effect of annual report quality on capital market outcomes. Notwithstanding that we use a matched sample for this analysis, given that matching might not fully address time-series variation in firm characteristics, we test for capital market effects using the following Generalized Estimation Equation (GEE) regression that accounts for residual differences between treatment and control samples, and the paired nature of our sample:
(5)
(5) where Capital Market Effects are absolute abnormal returns, |CAR|, abnormal trading turnover, AT, or abnormal number of trades NT. The dependent variables are calculated as explained in Section 3.3. Our test variable AWARD is an indicator that takes the value of one for award-shortlisted observations and zero otherwise. CONTROLS refers to the vector of firm-specific characteristics that are significant in the stepwise regression examining firm-level determinants of high-quality shown in , together with variables on report timing (YE_EA and EA_AR) and additional variables significant in tests of difference after matching (: EARN_SUR, LOSS and LEVERAGE). reports results for Equation (5). Columns (1)–(3) show results for the capital market effects of high-quality reporting around the earnings announcement date, while columns (4)–(6) show results around the annual report publication date.
Table 9. Capital market effects of award shortlisting.
5.1. Absolute abnormal returns
Columns (1) and (4) of present results of reporting quality on cumulative abnormal returns (|CAR|) for the earnings announcement date and annual report publication date, respectively. Column (1) shows that award-shortlisted firms have a lower absolute cumulative abnormal return relative to matched non-shortlisted firms around the earnings announcement date. This result is significant at the one percent level (t-statistic 3.53) and suggests that the earnings announcements of award-shortlisted firms are significantly less informative than those of non-shortlisted firms. Meanwhile, the coefficient on AWARD is insignificant in column (4) of , suggesting no difference in the absolute abnormal cumulative returns of award-shortlisted firms relative to non-shortlisted firms around the annual report publication date. Collectively, these results provide no evidence to suggest that award-shortlisted reports are more informative than non-shortlisted reports. In fact, results around the earnings announcement suggest that award-shortlisted reports are less informative. One possible explanation for this counterintuitive result is that despite their higher perceived quality, award-shortlisted reports may contain less price-sensitive (i.e. new) information because their primary role is simply to summarise information released throughout the reporting period via more timely communication channels.
5.2. Trading volume
We test for abnormal trading volume using abnormal turnover and abnormal number of trades. Specifically, columns (2) and (5) in show results for abnormal trading turnover at the earnings announcement date and at the annual report publication date, respectively, while columns (3) and (6) contain corresponding results for the abnormal number of trades. If high-quality narratives contain more information, then shortlisted reports may induce higher trading turnover and a higher number of trades relative to non-shortlisted reports. Conversely, if high-quality annual reports contain stale information, shortlisted reports may induce lower trading turnover and a lower number of trades relative to their non-shortlisted controls.
The coefficient estimate on AWARD in the earnings announcement date specification is indistinguishable from zero for abnormal turnover and negative (t-statistic 2.57) for the abnormal number of trades specification. For the annual report publication date, the coefficient estimate on AWARD is insignificant for both abnormal turnover and abnormal number of trades. These results suggest that annual reports of award-shortlisted firms are no more informative than the reports of non-shortlisted firms.
5.3. Timeliness of information disclosure
To examine whether award-shortlisted firms provide more timely information disclosure than their peers throughout the reporting cycle, we use the timeliness metric from Beekes and Brown (Citation2006) that measures the speed of price adjustment over the 12-month reporting period as our dependent variable in Equation (5). The timeliness measure approaches zero as firms opt to release information to the market promptly. Specifically, TIMELINESS traces share prices over the preceding 250 trading days ending 10 trading days after the earnings announcement to measure how quickly share price adjusts towards the price at the end of the 250-day window (day 0):
(6)
(6) where t = 0 corresponds to 10 trading days after the earnings announcement date, P is the market-adjusted share price for firm i at day t, and R is the market-adjusted rate of return for the firm over the 250 trading days. Ri0 adjusts for the magnitude in price drift over the 250 trading day period (Beekes et al. Citation2015). If high-quality annual reports signal enhanced disclosure throughout the year, then we expect a negative association between annual report quality and TIMELINESS.
presents the results for this analysis. The coefficient on AWARD is negative and significant at the ten percent level (t-statistic 1.88). The evidence provides some support for the view that award-shortlisted firms are timelier in the release of price-sensitive information relative to non-shortlisted firms. The conclusion that high-quality annual reporters disclose price-sensitive information earlier than their non-high-quality counterfactuals lends support for the confirmatory view of annual reports and explains the absence of larger capital market responses for high-quality annual reports.Footnote14 Our results suggest that experts’ assessment of high-quality annual reporting speaks more to the way information is summarised and presented in the report rather than to the provision of new information.
Table 10. Regression analysis: timeliness of information capture.
5.4. Robustness tests
We undertake several robustness tests to assess the sensitivity of our results to different research design choices. First, we test whether our results are sensitive to the length of the window we use to calculate the capital market effects. Second, we test whether our results are sensitive to the exclusion of financial firms from our sample. Third, to ensure that our results are not driven by the potential self-serving behaviour of the awarding institutions, we run our analysis for the subsample of reports that are shortlisted independently by at least two award-granting bodies. Fourth, to ensure that our results are not driven by the possibility that PwC is more likely to shortlist reports issued by its own audit clients, we repeat the analysis after excluding firms audited by PwC from our analysis. Fifth, we test whether AWARD is simply capturing annual report narrative characteristics as opposed to the general quality of the annual report by including controls for narrative tone and readability. Sixth, since PSM increases model dependence and covariate imbalance relative to unmatched data (King and Nielsen Citation2019, Clatworthy and Peel Citation2021), we examine the sensitivity of our results to using entropy balancing method, which overcomes these limitations of PSM. Results for this suite of robustness tests are presented in an accompanying Internet Appendix. These additional tests provide support to our baseline results and suggest that our findings are robust to different research design choices.
Finally, while matching limits differences in covariates between the treatment and control groups, thereby reducing the possibility that treatment group-specific characteristics other than reporting quality accounts for our results, it does not eliminate the possibility of an unobserved confounding variable influencing our results (Peel and Makepeace Citation2009). Specifically, matching does not eliminate the possibility that a characteristic correlated with both financial reporting quality and capital market effects is inadvertently omitted from our matching procedure. To test the robustness of our propensity score matching to unspecified confounders, we calculate Rosenbaum bounds for absolute cumulative abnormal returns and abnormal number of trades. Rosenbaum bounds predict the impact that a confounding variable must have on both the selection and the outcome to render the treatment effect insignificant (Rosenbaum Citation1995). Results for the Rosenbaum bounds for absolute cumulative abnormal returns and cumulative abnormal number of trades suggest that the treatment effect loses significance when the bound parameters are ℾ = 1.15 and ℾ = 1.10, respectively. Accordingly, an unobserved confounding variable that increases shortlisting odds by 15% (10%) would be sufficient to render results for absolute cumulative abnormal returns (cumulative abnormal trades) insignificant at the 5% level. While the existence of such unobserved confounder is possible, it is pertinent to note that these are conservative estimates because the confounder must influence both the shortlisting selection and the capital market outcome (DiPrete and Gangl Citation2005). Further, there is no suggestion that significance would flip signs such that award reports have higher capital market effects.
6. Interview evidence
Despite the time, attention, and financial investment involved in producing high quality annual reports, our results do not provide evidence of direct short-run capital market benefits to management and shareholders. In this section, we summarise interview evidence that seeks to understand managements’ motives for investing in high-quality annual reports. We interview senior executives from three shortlisted firms in our sample, along with two senior consultants from firms that advise FTSE350 companies on annual report content and design.Footnote15
Interviews were semi-structured, and respondents were asked identical questions relating to the intended audience of the annual report, characteristics of high-quality reports, the process of preparing the annual report (i.e. timing, authorship, and coordination), competitive restraints, and the approach to drafting certain content (i.e. chair’s letter, forward-looking information, performance, and strategy and business model). Participants also commented on the current state of annual reporting generally, and the biggest changes to annual reporting over the last decade. We view this analysis as an exploratory exercise that complements our empirical tests rather than as a comprehensive survey of preparers’ views yielding generalisable insights. CF1 and CF2 refer to the two senior consultants interviewed while Firms 1 to 3 refer to the three FTSE350 executives interviewed.
6.1. Purpose and users of the annual report
Traditionally, incumbent institutional investors were considered the primary target audience for the annual report (CF1), but its intended audience has shifted to prospective investors who rely on the annual report for ‘strategy and the big picture’ (CF2). Whereas finance used to be responsible for preparing the annual report, that role now typically sits with investor relations. Ownership transfer from finance to investor relations is partly an attempt to focus on clearer communication and simpler messaging to position the firm as an attractive proposition to prospective investors.
The annual report is not considered useful to current investors because they are familiar with the company (CF2) and price-sensitive information would already be publicly available (Firm 2). Instead, institutional investors and professional analysts are more likely to use the annual report for reference (i.e. as a summary of annual corporate disclosures). Specifically, executives from Firm 1 and Firm 2 state that:
There is more context in [the] annual report and depth of information. Institutional investors and professional analysts are going over numbers, not narratives. (Firm 1)
Analysts and investors largely don’t read the annual report because all the bits of annual reports are disclosed in a more timely manner: strategy is released just after the board of directors reviews it, although strategy is largely stagnant and not price sensitive. Analysts tend to look at the presentation and institutional investors meet the Chairman when he goes on the road after presentation … The annual report is a document of reference. (Firm 2)
6.2. Content and price sensitivity of the annual report
The role and importance of the annual report has changed as technology has produced a more dynamic information environment. The annual report is not considered to be a strategically important document for information dissemination because it is not timely. Rather, the annual report echoes messages from the earnings announcement and previous disclosures.Footnote17 Specifically, Firm 2 and Firm 3 interviewees note that:
No price reaction is expected in the annual report because price sensitive information must be disclosed in a timely manner – the annual report is not timely. Individual bits have a role to play, but they are published earlier. The annual report used to be necessary 40 years ago, but it is now a legacy document. With websites the information environment is more dynamic … Anything major would have been in the preliminary results or presentation. The annual report is a document of reference (Firm 2)
The annual report is something that needs to be done rather than a strategically important communication document. (Firm 3)
Accordingly, interviewees do not expect a price reaction to the annual report irrespective of quality. In this respect, respondents agree that firms do not invest in high quality annual reports to attain short-term capital market benefits around the publication date but instead view production of high-quality annual reports as part of the long-term broad strategy of the firm to provide high quality communication to stakeholders. In so doing, companies build a reputation as an honest and open broker of information.
In terms of content and purpose, respondents believe that annual report narratives provide retail investors and employees with a big picture overview of the firm and industry relative to other disclosures (Firm 3). The annual report provides more context than other disclosures (Firm 1) with the aim of providing a framework in which to examine and interpret past and future disclosures.
The annual report also informs corporate culture (e.g. personality coming through Chairman and CEO statements) and enhances trust (CF2). High-quality reporting uses transparency and consistency as a route to credibility. Specifically, readers are aware of corporate performance before the annual report is released and are therefore looking for a balanced commentary on results that is consistent with their expectations. The content, structure, and presentation of the annual report focusses on consistent delivery of key messages (Firm 2).
According to Firm 1, management discussion and analysis is possibly the least informative part of the annual report as very similar commentary occurs in the earnings announcement. Similarly, the strategy section is taken from the strategy board papers and related presentation (presented mid-year) and merely rephrased to sound as simple and clear as possible for employees and potential investors (Firm 2, Firm 3). Annual reports nevertheless disclose some new information in the form of the financial statement notes and the remuneration report. However, management do not typically consider this incremental content to be price relevant due to its narrow and specialised focus (Firm 2).
In summary, interviewees see the annual report as a summary document that simplifies and condenses information from other disclosures made during the reporting period. Respondents believe the main users of this summary information are potential investors and employees. Meanwhile, the process of summarising and simplifying messaging for the annual report serves an internal purpose by improving internal communication and promoting a shared understanding of the corporate value-added proposition.
7. Summary and conclusion
We examine the capital market effects of high-quality annual reports by matching firms whose reports have been shortlisted for an annual report quality award with non-shortlisted counterfactuals. Results for absolute cumulative abnormal returns and abnormal number of trades suggest that award-shortlisted annual reports elicit weaker market reactions, suggesting that these annual reports are no more informative than non-shortlisted annual reports. Further, we use the Beekes et al. (Citation2015) measure of timeliness to contextualise this result and find some evidence that award-shortlisted firms disclose information earlier than their peers.
Our results suggest that annual reports provide confirmatory information that contextualises prior information signals. Moreover, results indicate that award-shortlisted annual reports contain no more price-sensitive information than their counterfactuals because high quality reporters disclose relevant information to the market throughout the year on a timelier basis. Interviews with FTSE350 executives and consultants confirm that annual reports provide an accessible summary of annual events and disclosures for potential investors and employees. Respondents agree that the annual report is not a timely source of information, but companies see the publication of high-quality annual reports as part of the long-term broad communication strategy of the company.
Our study provides empirical evidence supporting the practitioner view that the annual report is a confirmatory document that collates and summarises pertinent information disclosed via timelier channels, rather than a source of new information. Our work shows how annual report quality can offer a window into the quality of firms’ broader communication strategy, where high quality annual reports form part of a high-quality overall communication strategy. Thus, high quality annual reporting does not automatically translate into more informative reporting. One implication of our findings is that policymakers (and researchers) should be wary about using the strength of capital market effects as a signal of annual report quality. Further, our study vindicates the use of practitioner-derived measures as proxies for annual report quality, insofar as they provide a parsimonious measure to score long and complex disclosures. Our evidence opens the possibility for further research examining the drivers and consequences of high-quality corporate reporting.
When interpreting our results, readers should be aware of the following caveats. First, although matching mitigates endogeneity, it does not eliminate it. Unobservable or unidentified differences (e.g. firm culture) likely exist and contribute to the remaining endogeneity (Shipman et al. Citation2017). Second, research suggests that propensity score matching induces bias and imbalance through imprecise matching on covariates and elimination of pairs to meet caliper specifications (King and Nielsen Citation2019). Although our design mitigates matching imbalance by employing course matching by industry, time, and auditor as a primary matching method and by reporting on covariate balance after the match (i.e. input variables to the propensity score), we do eliminate observations to meet an optimal caliper which may induce bias. Third, although award criteria are publicly available, there is no empirical evidence on how quality is measured in awards. In this respect Core (Citation2001) criticised rankings for their lack of transparency and called for empirical evidence on the properties of the AIMR-FAF rankings to support their continued use as a proxy for reporting quality. The motives and selection criteria of award-granting bodies, together with the net benefits of the awards industry for the corporate reporting system, are areas where theory and evidence remain scarce and where opportunities for further work therefore exist.
Acknowledgments
We are grateful for comments and advice from Mahmoud El-Haj, Paul Rayson, and workshop participants at the University of Saskatchewan and the European Accounting Association Annual Congress 2017. We thank Martin Walker and Thomas Schleicher for helping us with the collection of the interview data.
Disclosure statement
No potential conflict of interest was reported by the author(s).
Supplemental data
Supplemental data for this article can be accessed online at https://doi.org/10.1080/00014788.2022.2106542.
Additional information
Funding
Notes
1 The International Accounting Standards Board (IASB) does not provide a formal definition of the annual report. International Standard on Auditing (ISA) 720 (Revised) describes the annual report as ‘a document, or combination of documents … An annual report contains or accompanies the financial statements and the auditors’ report thereon and usually includes information about the entity’s developments, its future outlook, a risks and uncertainties statement by the entity’s governing body, and reports covering governance matters’ (IAASB Citation2015, p. 7, para. 12a).
2 Report Watch is an international ranking for which we have considered U.K. firms that rank at B+ or higher.
3 Public disclosures may also change the investor base (i.e., foreign, government, institutional holdings).
4 The advantage of a continuous ranking variable is ease of matching high- to low-quality reports. Absent this ranking information, we consider firms that are shortlisted during the sample period to be potentially high-quality and hence, eliminate observations for shortlisted firms for the four years around the shortlisting. This mitigates against inclusion of highly ranked, yet non-shortlisted, reports in the control sample (see Section 4.1 for further details).
5 Controlling for firm characteristics in linear regression models does not mitigate bias arising from misspecification of the (potentially non-linear) relation between firm characteristics and narrative reporting quality (Shipman et al. Citation2017). The accounting literature uses the Heckman model and matching to mitigate selection bias. Although the Heckman model is effective at reducing selection bias, its criteria for application are stringent and accounting models generally do not meet these requirements (Lennox et al. Citation2012).
6 Although endogeneity is mitigated using matching, it is not eliminated because unobservable or unidentified determinants (i.e., characteristics affecting both high-quality reporting and capital market outcomes) may exist that are not accounted for in the model (Caliendo and Kopeinig Citation2008). To mitigate the possibility that correlated omitted variables bias our results we undertake Rosenbaum bounds analysis. Shipman et al. (Citation2017) also identify limitations specific to PSM and its implementation including systematic exclusion of treatment observations with large treatment effects, and propensity to match treatment and control observations close to the cut-off (i.e., matching award-shortlisted observations to high-quality but non-shortlisted observations). We mitigate sample selection and generalizability concerns by matching with replacement, eliminating firm-year observations where a firm has been shortlisted in the previous or subsequent two years, and comparing PSM results to entropy balancing.
7 We match on propensity score with replacement to minimise bias from elimination of control observations while avoiding poor matches. We also test the sensitivity of outcomes to repeated control observations as recommended by Stuart (Citation2010), who notes that repeated observations in the control sample violate the assumption of independence. Austin (Citation2011), using Monte Carlo simulations in the medical field, finds that an optimal caliper of 0.2 times the standard deviation of propensity scores mitigates at least 99% of bias in confounding variables. We follow Austin (Citation2011), which in our setting results in a caliper of 0.045.
8 We do not use firm fixed effects in EquationEquation (1)(1)
(1) as award-shortlisting tends to be sticky over time, hence including firm fixed effects would subsume other explanatory variables.
9 In robustness tests we adjust the time window used to calculate capital market outcomes to check the sensitivity of our results to this research design choice.
10 PwC: http://www.pwc.co.uk/building-public-trust-awards/index.jhtml; IR Society: http://www.irs.org.uk/events/dinner; Communicate Magazine: https://www.communicatemagazine.com/awards/; Accountancy Age: http://www.britishaccountancyawards.co.uk/; Report Watch: http://www.reportwatch.net/
11 The dataset of annual reports that have been identified as having been shortlisted for an annual report award is available at doi:10.17635/lancaster/researchdata/534.
12 As an example of overlap, in 2009 PwC and IR Society shortlisted Great Portland Estates, PwC and Accountancy Age shortlisted HSBC, and IR Society and Accountancy Age shortlisted Marks & Spencer. Therefore, PwC, IR Society and Accountancy Age each had two observations that overlapped with another awarding body.
13 Testing differences in covariates is controversial because discarding matched observations reduces power thereby inflating statistical significance independent of covariate balance (Austin Citation2008). Hansen (Citation2008) argues, however, that both match validity and outcome analysis suffer from reduced power, therefore in the event of a type I error in match validity (rejecting the null hypothesis that the treatment and control samples are the same) arising from over-trimming in the sample, the reduction in power is sufficient to undermine causal effects in outcome analysis. Caliper tests are another way of assessing the quality of match through case and control group overlap. Austin (Citation2011) argues that using a caliper of 0.2 times the standard deviation mitigates at least 99% of bias in confounding variables. (The standard deviation of shortlisted firms is 0.224 and therefore we use a caliper of 0.045.)
14 Brown and Tucker (Citation2011) posit that year-on-year annual report modification is associated with market reactions. Therefore, to ensure the robustness of our timeliness results, we control for year-on-year annual report modifications (untabulated). Specifically, we add ΔWORDS, the log change in number of words, ΔSECTIONS, the change in the number of sections reported, and ΔPAGES, the change in the number of pages in the timeliness specification. Results for this test are in line with the results in .
15 Interviews took place in London over the period June to September 2017.
16 Customers and NGOs may also use the annual report (CF1; CF2)
17 For example, the earnings announcement includes commentary on performance while strategy days (often co-occurring with the half-year results release) review business model and strategic objectives.
References
- Abraham, S., and Cox, P., 2007. Analysing the determinants of narrative risk information in UK FTSE 100 annual reports. The British Accounting Review, 39, 227–248.
- Anis, R., Fraser, I., and Hussainey, K., 2012. A new measure for disclosure quality. Working Paper, Stirling University, UK.
- ASB, 2006. Reporting Statement: Operating and Financial Review. Available from: https://www.frc.org.uk/getattachment/4aeb44dd-0c04-479d-9592-d1a503834216/Reporting-Statement-The-Operating-and-Financial-Review-January-2006.pdf.
- Atiase, R.K., and Bamber, L.S., 1994. Trading volume reactions to annual accounting earnings announcements: the incremental role of predisclosure information asymmetry. Journal of Accounting and Economics, 17, 309–329.
- Austin, P.C., 2008. A critical appraisal of propensity-score matching in the medical literature between 1996 and 2003. Statistics in Medicine, 27, 2037–2049.
- Austin, P.C., 2011. Optimal caliper widths for propensity-score matching when estimating differences in means and differences in proportions in observational studies. Pharmaceutical Statistics, 10, 150–161.
- Baginski, S.P., Hassell, J.M., and Kimbrough, M.D., 2004. Why do managers explain their earnings forecasts? Journal of Accounting Research, 42, 1–29.
- Bailey, W., Andrewkarolyi, G., and Salva, C., 2006. The economic consequences of increased disclosure: evidence from international cross-listings. Journal of Financial Economics, 81, 175–213.
- Bailey, W., Li, H., Mao, C.X., and Zhong, R., 2003. Regulation fair disclosure and earnings information: market. Analyst, and Corporate Responses. Journal of Finance, 58, 2487–2514.
- Bansal, P., and Clelland, I., 2004. Talking trash: legitimacy, impression management, and unsystematic risk in the context of the natural environment. Academy of Management Journal, 47, 93–103.
- Beattie, V., and Jones, M.J., 1997. A comparitive study of the use of financial graphs in the corporate annual reports of major U.S. and U.K. companies. Journal of International Financial Management and Accounting, 8, 33–68.
- Beattie, V., McInnes, B., and Fearnley, S., 2004. A methodology for analysing and evaluating narratives in annual reports: a comprehensive descriptive profile and metrics for disclosure quality attributes. Accounting Forum, 28, 205–236.
- Beattie, V., McInnes, B., and Pierpoint, J., 2008. The management commentary: comparing narrative outcomes from alternative regulatory regimes. ICAEW Centre for Business Performance.
- Beaver, W., 1968. The information content of annual earnings announcements. Journal of Accounting Research, 6, 67–92.
- Beekes, W., and Brown, P., 2006. Do better-governed Australian firms make more informative disclosures? Journal of Business Finance, 33, 422–450.
- Beekes, W., Brown, P., and Zhang, Q., 2015. Corporate governance and the informativeness of disclosures in Australia: a re-examination. Accounting & Finance, 55, 931–963.
- Beyer, A., Cohen, D.A., Lys, T.Z., and Walther, B.R., 2010. The financial reporting environment: review of the recent literature. Journal of Accounting and Economics, 50, 296–343.
- Botosan, C., 1997. Disclosure level and the cost of equity capital. The Accounting Review, 72, 323–349.
- Botosan, C.A., and Plumlee, M.A., 2002. A re-examination of disclosure level and the expected cost of equity capital. Journal of Accounting Research, 40, 21–40.
- Brown, S., and Hillegeist, S.A., 2007. How disclosure quality affects the level of information asymmetry. Review of Accounting Studies, 12, 443–477.
- Brown, S., and Tucker, J.W., 2011. Large-sample evidence on firms’ year-over-year MD&A modifications. Journal of Accounting Research, 49, 309–346.
- Bushee, B.J., and Noe, C.F., 2000. Corporate disclosure practices, institutional investors, and stock return volatility. Journal of Accounting Research, 38, 171–202.
- Byard, D., and Shaw, K.W., 2003. Corporate disclosure quality and properties of analysts' information environment. Journal of Accounting, Auditing & Finance, 18, 355–378.
- Caliendo, M., and Kopeinig, S., 2008. Some practical guidance for the implementation of propensity score matching. Journal of Economic Surveys, 22, 31–72.
- Clatworthy, M., and Jones, M.J., 2001. The effect of thematic structure on the variability of annual report readability. Accounting, Auditing & Accountability Journal, 14, 311–326.
- Clatworthy, M., and Jones, M.J., 2003. Financial reporting of good news and bad news: evidence from accounting narratives. Accounting and Business Research, 33, 171–185.
- Clatworthy, M., and Jones, M.J., 2008. Overseas equity analysis by UK analysts and fund managers. The British Accounting Review, 40, 337–355.
- Clatworthy, M.A., and Peel, M.J., 2021. Reporting accountant appointments and accounting restatements: evidence from UK private companies. The British Accounting Review, 53, 100974–100919.
- Coffee, J.C., 2002. Racing towards the top? The impact of cross-listings and stock market competition on international corporate governance. Columbia Law Review, 102, 1757.
- Cohen, D.A., 2008. Does information risk really matter? An analysis of the determinants and economic consequences of financial reporting quality. Asia-Pacific Journal of Accounting & Economics, 15, 69–90.
- Collins, W., Davie, E.S., and Weetman, P., 1993. Management discussion and analysis: an evaluation of practice in UK and US companies. Accounting and Business Research, 23, 123–137.
- Communicate Magazine, 2015. Corporate Financial Awards 2016: Entry Criteria.
- Cooper, S.M., and Owen, D.L., 2007. Corporate social reporting and stakeholder accountability: the missing link. Accounting, Organizations and Society, 32, 649–667.
- Core, J.E., 2001. A review of the empirical disclosure literature: discussion. Journal of Accounting and Economics, 31, 441–456.
- Cready, W.M., and Mynatt, P.G., 1991. The information content of annual reports: a price and trading response analysis. Accounting Review, 66, 291–312.
- Deegan, C., and Carroll, G., 1993. An analysis of incentives for Australian firms to apply for reporting excellence awards. Accounting and Business Research, 23, 219–227.
- De Franco, G., Kothari, S.P., and Verdi, R.S., 2011. The benefits of financial statement comparability. Journal of Accounting Research, 49, 895–931.
- Deloitte, 2013. Need to know: new UK reporting regulations laid before parliament.
- Diamond, D.W., and Verrecchia, R.E., 1991. Disclosure, liquidity, and the cost of capital. The Journal of Finance, 46, 1325–1359.
- DiPrete, T.A., and Gangl, M., 2005. Assessing bias in the Estimation of causal effects: Rosenbaum bounds on matching estimators and instrumental variables Estimation with imperfect instruments. Sociological Methodology, 35, 271–310.
- Drake, M.S., Roulstone, D.R., and Thornock, J.R., 2016. The usefulness of historical accounting reports. Journal of Accounting and Economics, 61, 448–464.
- Dunn, K.A., and Mayhew, B.W., 2004. Audit firm industry specialization and client disclosure quality. Review of Accounting Studies, 9, 35–58.
- Dye, R.A., and Sridhar, S.S., 1995. Industry-wide disclosure dynamics. Journal of Accounting Research, 33, 157.
- e.com, 2014. Annual report on annual reports 2014: Report Watch.
- El-Haj, M., Alves, P., Rayson, P., Walker, M., and Young, S., 2020. Retrieving, classifying and analysing narrative commentary in unstructured (glossy) annual reports published as PDF files. Accounting and Business Research, 50, 6–34.
- Eng, L.L., and Mak, Y.T., 2003. Corporate governance and voluntary disclosure. Journal of Accounting and Public Policy, 22, 325–345.
- Epstein, L.G., and Schneider, M., 2008. Ambiguity, information quality, and asset pricing. The Journal of Finance, 63, 197–228.
- Firth, M., 1981. The relative information content of the release of financial results data by firms. Journal of Accounting Research, 19, 521.
- FRC, 2018. Guidance on the Strategic Report. Available from: https://www.frc.org.uk/getattachment/fb05dd7b-c76c-424e-9daf-4293c9fa2d6a/Guidance-on-the-Strategic-Report-31-7-18.pdf.
- Gallant, A.R., Rossi, P.E., and Tauchen, G., 1992. Stock prices and volume. Review of Financial Studies, 5, 199–242.
- Gelb, D.S., and Zarowin, P., 2002. Corporate disclosure policy and the informativeness of stock prices. Review of Accounting Studies, 7, 33–52.
- Gray, S., Kouhy, R., and Lavers, S., 1995. Corporate social and environmental reporting. Accounting, Auditing & Accountability Journal, 8, 47–77.
- Griffin, P.A., 2003. Got information? Investor response to form 10-K and form 10-Q EDGAR filings. Review of Accounting Studies, 8, 433–460.
- Grilliches, Z., 1995. R&D and productivity: econometric results and measurement issues. In: P. Stoneman, ed. Handbook of the Economics of Innovation and Technological Change. Oxford: Blackwell, 52–89.
- Guthrie, J., and Parker, L., 1990. Corporate social disclosure practice: a comparative international analysis. Advances in Public Interest Accounting, 3, 159–175.
- Hail, L., 2002. The impact of voluntary corporate disclosures on the ex-ante cost of capital for Swiss firms. European Accounting Review, 11, 741–773.
- Hansen, B.B., 2008. The essential role of balance tests in propensity-matched observational studies: comments on ‘A critical appraisal of propensity-score matching in the medical literature between 1996 and 2003’ by Peter Austin, Statistics in Medicine. Statistics in Medicine, 27, 2050–2054.
- Harris, M., and Raviv, A., 1993. Differences of opinion make a horse race. Review of Financial Studies, 6, 473–506.
- Healy, P.M., Hutton, A.P., and Palepu, K.G., 1999. Stock performance and intermediation changes surrounding sustained increases in disclosure. Contemporary Accounting Research, 16, 485–520.
- Healy, P.M., and Palepu, K.G., 2001. Information asymmetry, corporate disclosure, and the capital markets: a review of the empirical disclosure literature. Journal of Accounting and Economics, 31, 405–440.
- Hermalin, B.E., and Weisbach, M.S., 1998. Endogenously chosen boards of directors and their monitoring of the CEO. American Economic Review, 88, 96–118.
- Hines, R.D., 1982. The usefulness of annual reports: the anomaly between the efficient markets hypothesis and shareholder surveys. Accounting and Business Research, 12, 296–309.
- Holland, L., and Boon Foo, Y., 2003. Differences in environmental reporting practices in the UK and the US: the legal and regulatory context. The British Accounting Review, 35, 1–18.
- Holthausen, R.W., and Verrecchia, R.E., 1990. The effect of informedness and consensus on price and volume behavior. The Accounting Review, 65, 191–208.
- Hossain, M., Perera, M.H.B., and Rahman, A.R., 1995. Voluntary disclosure in the annual reports of New Zealand companies. Journal of International Financial Management & Accounting, 6, 69–87.
- Hussainey, K., and Mouselli, S., 2010. Disclosure quality and stock returns in the UK. Journal of Applied Accounting Research, 11, 154–174.
- Hussainey, K., Schleicher, T., and Walker, M., 2003. Undertaking large-scale disclosure studies when AIMR-FAF ratings are not available: the case of prices leading earnings. Accounting and Business Research, 33, 275–294.
- IAASB, 2015. ISA 720: The Auditor’s Responsibilities Relating to Other Information and Related Conforming Amendments. Available from: https://www.ifac.org/system/files/publications/files/ISA-720-(Revised).pdf.
- ICSA, 2014. ICSA: The Chartered Governance Institute Awards 2014.
- IR Society, 2015. IR Society 2015 Best Practice Awards Review. Available from: https://irsociety.org.uk/files/IRSoc_Best_Practice_2016.pdf.
- IR Society, 2022. IR Society Frequently Asked Questions. Available from: https://irsocietyawards.org.uk/faqs.
- Jensen, M.C., and Meckling, W.H., 1976. Theory of the firm: managerial behavior, agency costs and ownership structure. Journal of Financial Economics, 3, 305–360.
- Jones, M.J., 1988. A longitudinal study of the readability of the chairman’s narratives in the corporate reports of a UK company. Accounting and Business Research, 18, 297–305.
- Kandel, E., and Pearson, N.D., 1995. Differential interpretation of public signals and trade in speculative markets. Journal of Political Economy, 103, 831–872.
- Karpoff, J.M., 1986. A theory of trading volume. The Journal of Finance, 41, 1069–1087.
- Karpoff, J.M., 1987. The relation between price changes and trading volume: a survey. The Journal of Financial and Quantitative Analysis, 22, 109–126.
- Kim, O., and Verrecchia, R.E., 1991. Trading volume and price reactions to public announcements. Journal of Accounting Research, 29, 302.
- King, G., and Nielsen, R., 2019. Why propensity scores should not be used for matching. Political Analysis, 27, 435–454.
- Lang, M.H., Lins, K.V., and Miller, D.P., 2003. Adrs, analysts, and accuracy: does cross listing in the United States improve a firm’s information environment and increase market value? Journal of Accounting Research, 41, 317–345.
- Lang, M.H., and Lundholm, R., 1993. Cross-sectional determinants of analyst ratings of corporate disclosures. Journal of Accounting Research, 31, 246–271.
- Lang, M.H., and Lundholm, R.J., 1996. Corporate disclosure policy and analyst behavior. The Accounting Review, 71, 467–492.
- Larcker, D.F., and Rusticus, T.O., 2010. On the use of instrumental variables in accounting research. Journal of Accounting and Economics, 49, 186–205.
- Lennox, C.S., Francis, J.R., and Wang, Z., 2012. Selection models in accounting research. The Accounting Review, 87, 589–616.
- Lerman, A., and Tan, Q., 2019. Rethinking Determinants of Trading Volume at Earnings Announcements. University of Connecticut School of Business Research Paper, (19-05).
- Leuz, C., and Wysocki, P.D., 2008. Economic Consequences of Financial Reporting and Disclosure Regulation: A Review and Suggestions for Future Research. SSRN Electronic Journal. Available from SSRN 1105398.
- Li, E.X., and Ramesh, K., 2009. Market reaction surrounding the filing of periodic SEC reports. The Accounting Review, 84, 1171–1208.
- Li, F., 2010. The information content of forward-looking statements in corporate filings-a naïve Bayesian machine learning approach. Journal of Accounting Research, 48, 1049–1102.
- Linsley, P.M., and Lawrence, M.J., 2007. Risk reporting by the largest UK companies: readability and lack of obfuscation. Accounting, Auditing & Accountability Journal, 20, 620–627.
- Linsley, P.M., and Shrives, P.J., 2006. Risk reporting: a study of risk disclosures in the annual reports of UK companies. The British Accounting Review, 38, 387–404.
- Loughran, T., and McDonald, B., 2011. When is a liability not a liability? Textual analysis, dictionaries, and 10-Ks. The Journal of Finance, 66, 35–65.
- Merkl-Davies, D., and Brennan, N., 2007. Discretionary disclosure strategies in corporate narratives: incremental information or impression management? Journal of Accounting Literature, 26, 116–194.
- Meyer, J.W., and Rowan, B., 1977. Institutionalized organizations: formal structure as myth and ceremony. American Journal of Sociology, 83, 340–363.
- O’Sullivan, M., 2017. Can’t Live With It, Can’s Live Without It: The Continuing Role of the Annual Report. London: IIRC.
- Peel, M.J., and Makepeace, G.H., 2009. Propensity Score Matching in Accounting Research and Rosenbaum Bounds Analysis for Confounding Variables. SSRN Electronic Journal. Available from SSRN: https://ssrn.com/abstract=1485734.
- PwC, 2007. Preparer’s Guide. Narrative Reporting. Give Yourself a Head Start. Available from: https://www.pwc.com/gx/en/audit-services/corporate-reporting/assets/pdfs/narrative-reporting.pdf.
- PwC, 2010. Investor View: Insight from the Investment Community. The Role of the Annual Report. Available from: https://www.pwc.com/gx/en/audit-services/corporate-reporting/publications/investor-view/pdf/pwc-role-of-the-annual-report.pdf.
- PwC, 2014. Navigating the Trust Journey – Excellence in Reporting Awards. Available from: https://www.pwc.co.uk/assets/pdf/building-public-trust-excellence-in-reporting-awards-2014-2-october.pdf.
- PwC, 2022. Award Categories and Criteria 2022. Available from: https://www.pwc.co.uk/who-we-are/building-public-trust-in-corporate-reporting-awards/award-categories-and-criteria.html.
- Rippington, F.A., and Taffler, R.J., 1995. The information content of firm financial disclosures. Journal of Business Finance & Accounting, 22, 345–362.
- Rosenbaum, P.R., 1995. Obervational Studies. New York: Springer.
- Rowbottom, N., and Lymer, A., 2010. Exploring the use and users of narrative reporting in the online annual report. Journal of Applied Accounting Research, 11, 90–108.
- Ryan, C., Dunstan, K., and Brown, J., 2002. The value of public sector annual reports and annual reporting awards in organisational legitimacy. Accounting, Accountability & Performance, 8, 61–76.
- Schleicher, T., Hussainey, K., and Walker, M., 2007. Loss firms’ annual report narratives and share price anticipation of earnings. The British Accounting Review, 39, 153–171.
- Schwert, G.W., 1989. Indexes of United States Stock Prices from 1802 to 1987 (No. w2985). National Bureau of Economic Research.
- Shipman, J.E., Swanquist, Q.T., and Whited, R.L., 2017. Propensity score matching in accounting research. The Accounting Review, 92, 213–244.
- Shtatland, E., Moore, S., and Barton, M., 2011. Why We Need an R2 Measure of Fit (and Not Only One) in Proc Logistic and Proc Genmod. Statistics and Data Analysis, (256–25).
- Stuart, E.A., 2010. Matching methods for causal inference: a review and a look forward. Statistical Science, 25, 1–21.
- Sutley, K.R., 1994. An empirical investigation into the relation between differential annual report informativeness and the association of stock returns with accounting earnings: the case of the Financial post annual report awards. Unpublished doctoral dissertation. University of Chicago.
- Verrecchia, R.E., and Weber, J., 2006. Redacted disclosure. Journal of Accounting Research, 44, 791–814.
- Xie, B., Davidson, W.N., and DaDalt, P.J., 2003. Earnings management and corporate governance: the role of the board and the audit committee. Journal of Corporate Finance, 9, 295–316.
- Yekini, L.S., Wisniewski, T.P., and Millo, Y., 2016. Market reaction to the positiveness of annual report narratives. The British Accounting Review, 48, 415–430.
- Yuthas, K., Rogers, R., and Dillard, J.F., 2002. Communicative action and corporate annual reports. Journal of Business Ethics, 41, 141–157.
- Wagenhofer, A., 2004. Accounting and economics: what we learn from analytical models in financial accounting and reporting. In: C. Leuz, D. Pfaff, and A. Hopwood, eds. The Economics and Politics of Accounting: International Perspectives on Research Trends, Policy, and Practice. Oxford: Oxford University Press, 5–31.
- Watson, A., Shrives, P., and Marston, C., 2002. Voluntary disclosure of accounting ratios in the UK. The British Accounting Review, 34, 289–313.