
 ?Mathematical formulae have been encoded as MathML and are displayed in this HTML version using MathJax in order to improve their display. Uncheck the box to turn MathJax off. This feature requires Javascript. Click on a formula to zoom.
Abstract
We study product market competition’s influence on annual report readability. As competition increases in an industry, our findings show that firms reduce the readability of their annual reports. We further document that the impact of competition on annual report readability is stronger for research and development (R&D)-intensive firms, for firms that have a higher level of trade secrecy (i.e. proprietary information), and for firms with higher levels of CEO performance-based incentives. Overall, our findings highlight the importance of the proprietary cost effect of competition on annual report readability.
1. Introduction
Prior research has explored the links between product market competition and corporate information opacity (e.g. Datta et al. Citation2013, Guo et al. Citation2019, Jiang et al. Citation2016, Markarian and Santalo Citation2014, Muiño and Núñez-Nickel Citation2016, Shi et al. Citation2018, Wang and Winton Citation2021). In this study, we focus on the effect of competition on annual report readability. Readability is an important attribute of the text in financial statements and allows ‘ … individual investors and analysts to assimilate valuation-relevant information from a financial disclosure’ (Loughran and McDonald Citation2014, p. 1649). In this study, we explore readability because prior research (Bloomfield Citation2008, Li Citation2008) shows that managers can affect information opacity by influencing financial statements readability. In recent years, regulators and corporate stakeholders have paid increasing attention on the readability of annual reports. The United States Securities and Exchange Commission (SEC) adopted the Plain English rule on October 1, 1998, requiring companies to prepare prospectuses, annual reports, and other materials that are understandable to, and readable by, investors. Prior studies show that the readability and lexical characteristics of financial reports have important implications for many outcome variables.Footnote1 Despite extensive studies in the literature on the implications of annual report readability, very few studies examine what drives annual report readability. Moreover, these studies mostly focus on how management characteristics and firm-level earnings quality influence annual report readability (i.e. Hasan Citation2020, Lo et al. Citation2017, Miller Citation2010). Our study extends the current literature by examining whether product market competition influences annual report readability.
The relationship between competition and opacity is ambiguous ex ante. One strand of the literature documents that more competition leads to higher opacity (Datta et al. Citation2013, Guo et al. Citation2019, Markarian and Santalo Citation2014, Shi et al. Citation2018, Wang and Winton Citation2021). Datta et al. (Citation2013), for example, show that more competitive industries are associated with greater earnings manipulation for several reasons. Firstly, firms with greater product market power (i.e. low competition) can shift cost shocks to customers. Thus, market power enables these firms to keep their cashflow fluctuations low, with the management of earnings not required. Conversely, firms with weaker market power potentially face penalties in the capital market when they fail to meet earnings expectations. Thus, more competition is likely to incentivize these firms to manage earnings. This line of reasoning is consistent with that of Peress (Citation2010) who uses a similar argument when studying the association between competition and insider trading. Secondly, Datta et al. (Citation2013) argue that firms in a more competitive industry may prefer to strategically limit the availability of information to competitors, a view consistent with the proprietary cost argument (Clinch and Verrecchia Citation1997, Gertner et al. Citation1988, Verrecchia Citation1983). Several empirical studies support this argument. Markarian and Santalo (Citation2014), for instance, observe a positive relationship between competition and both accrual-based and real earnings management. Likewise, Shi et al. (Citation2018) find a positive relationship between competition and earnings management, arguing that managerial career concerns act as the incentive for this positive relationship. Furthermore, Wang and Winton (Citation2021) allude that higher competition is related to a higher probability of fraud commission. Taken together, these studies indicate that a high level of competition may create incentives for a firm or its manager to increase the level of opacity of its information environment. An important way for a manager to obfuscate information is to make reports less readable, more complex, and more difficult to understand (Li Citation2008, Citation2010b). Overall, these prior studies suggest that annual report readability could decrease as competition increases.
An alternative view is that competition and corporate opacity are negatively related; that is, increased competition leads to decreased opacity (i.e. increased readability). Competition disciplines managers to reduce agency problems and increase economic and information efficiency. For instance, Hart (Citation1983) theoretically shows that competition diminishes managerial slack and helps to improve monitoring. Consequently, managers in competitive firms achieve efficiency in allocating resources (Schmidt Citation1997), providing more voluntary disclosure and improving the financial reporting environment (Darrough and Stoughton Citation1990). Ali et al. (Citation2014) show that firms in more concentrated industries disclose less information owing to their opaque information environment: as competition increases, these firms start to increase their voluntary disclosures. Similarly, Muiño and Núñez-Nickel (Citation2016) show that firms provide a greater level of disclosure at a high level of competition to deter new competitors. Lastly, Jiang et al. (Citation2016) find that higher competition reduces banks’ opacity. Overall, this strand of the literature suggests that corporate information opacity decreases as competition increases. Thus, it is possible that annual report readability may increase when product market competition increases.
Given these opposing views and predictions, this study explores the effect of product market competition on annual report readability. We examine how competition influences 10-K annual report readability based on 42,948 US firm-year observations between 1994 and 2019. Firms can make their disclosures less readable in different ways. For instance, they may use an ambiguous tone to hide news and reduce readability for investors. Firms may also make reports more complex and less readable by changing the structure of sentences. We examine the latter approach and utilise the Bog Index, as proposed by Bonsall et al. (Citation2017), as a proxy for annual report readability. A lower (higher) value on the Bog Index implies a higher (lower) level of readability of an annual report.Footnote2 Our primary measure of product market competition is Hoberg and Phillips (Citation2016) firm-level Competition Index, which is based on text-based network industry classifications (TNIC). These classifications are dynamic and are derived from product descriptions reported every year in the SEC 10-K filings. Hoberg and Phillips (Citation2016) argue that, unlike static proxies such as the Standard Industrial Classification (SIC) codes for industries and industry-level concentration measures, their index is dynamic and captures product similarity and competition at the firm level. A lower (higher) value on the index implies stronger (weaker) competition.
Our baseline analysis shows a significant and negative relationship between the Bog Index and the firm-level Herfindahl–Hirschman Index. This result suggests that the lower (higher) the competition, the higher (lower) the annual report readability. We run a wide range of sensitivity tests, showing that the results remain qualitatively unchanged for alternative industry-level measures of competition and alternative annual report readability measures such as the Fog, Flesch, and Flesch–Kincaid indexes (Biddle et al. Citation2009, Dougal et al. Citation2012, Lawrence Citation2013, Lehavy et al. Citation2011, Li Citation2008).
A caveat in this type of empirical design is that some unobservable omitted variables could be driving the results. To help mitigate this concern, following Fresard (Citation2010) and Valta (Citation2012), we design a quasi-natural experiment. Specifically, we use significant reductions in import-related tariffs as exogenous shocks to product market competition. For our sample, we consider significant tariff changes as exogeneous shocks when changes in tariffs are negative and greater than three times the industry average.Footnote3 The idea is that any significant reductions in trade barriers increase the intensity of an industry’s competition.Footnote4 Using US tariff data for the period between 1994 and 2005, we derive 75 shock events in 53 different 4-digit SIC codes, yielding a treated firm-year sample of 625 observations. We utilise the difference-in-differences (DiD) approach and find results consistent with our main findings. Specifically, as competition increases after significant reductions in import-related tariffs, firms exposed to these shocks reduce their annual report readability. Moreover, following Waisman (Citation2013) and Rahman et al. (Citation2021), we use the earliest year Competition Index value as an instrument for the current level of competition. This instrumental variable approach provides results consistent with our baseline findings. Overall, these testsFootnote5 and results all add credence to our main findings.
Our study next considers and excludes any alternative explanations for the decrease in annual report readability. While we show that decreased readability is due to increased competition, one can argue that readability may be due to poor performance and linguistic complexity in firm disclosures. Firms’ business strategy could also be a confounding factor, with Lim et al. (Citation2018) documenting a decrease in readability for firms pursuing an innovation-oriented prospector strategy. Finally, competition from new entrants could drive our results. To exclude these alternative explanations and other forms of competition from new entrants, we conduct three tests. Firstly, we run a regression in which we include two additional variables as proxies for poor performance and for linguistic complexity. The relationship between our competition proxy and annual report readability remains qualitatively similar even after the inclusion of these controls. Secondly, we construct a business strategy variable, following Bentley et al. (Citation2013), and control for this in our regression model. We find that our results remain qualitatively unchanged. Thirdly, we explicitly recognise the distinction between competition from potential entrants and competition from existing competitors in our regression model. Empirically, we find that competition from potential entrants does not have any significant impact on readability, which is consistent with the argument that competition from new entrants does not drive our results.
To further understand the settings in which the effect of competition on annual report readability is more pronounced, we perform several tests. Firstly, consistent with the proprietary information and cost argument (Verrecchia Citation1983), the reduction in readability is stronger for firms with higher levels of R&D intensity. Thus, the relationship is more pronounced for firms with proprietary information (Jones Citation2007). Secondly, using data on trade secrecy (proprietary information) risk disclosure in 10-K reports (Glaeser Citation2018), we document that the impact of competition on readability is also stronger when firms have higher levels of trade secrecy or proprietary cost. Thirdly, we argue that CEO options-based incentives have a significant role in annual report readability. Karuna (Citation2007) shows that excessive performance-based incentives designed to achieve optimal productivity are more prevalent when competition increases. In addition, these incentives reduce executive turnover (Erkens Citation2011) and the likelihood that executives may share a firm’s proprietary information with its competitors. Taken together, we hypothesize that the relationship is more pronounced when CEO risk incentives increase. Consistent with this expectation, we find that the relationship is more pronounced when firms increase the level of CEO options-based (risk) incentives.
Our study makes several contributions. Firstly, prior research studies the association between competition and several dimensions of corporate opacity, such as earnings quality, earnings management, and fraud (e.g. Datta et al. Citation2013, Guo et al. Citation2019, Jiang et al. Citation2016, Markarian and Santalo Citation2014, Muiño and Núñez-Nickel Citation2016, Shi et al. Citation2018, Wang and Winton Citation2021). Further, past studies also examine the impact of competition on analyst coverage and dispersion (Datta et al. Citation2011, Haw et al. Citation2015); managerial disclosure of earnings (Huang et al. Citation2017); investment efficiency (Stoughton et al. Citation2017); and audit fee (Wang and Chui Citation2014). Overall, each of these studies broadens our insights into the influence of competition on firms’ information environment, corporate opacity, and reporting and disclosure choices. However, these studies fail to capture
the overall complexity of firms’ financial communication, that is, the cost of processing and interpreting the entirety of firms’ disclosures. This potential limitation is particularly important, given the broad nature of corporate disclosures such as 10-K filings that describe a significant number of interrelated financial items. (Lehavy et al. Citation2011, p. 1088)
Moreover, the lack of standardisation and the absence of regulation make annual report readability less susceptible to regulatory intervention or the adverse opinions of auditors or analysts. Thus, consistent with the incomplete revelation hypothesis (Bloomfield Citation2008), these advantages make readability a potential avenue through which managers can obfuscate information. In our study, we focus on annual report readability. We are not aware any previous studies conducted on the effect of product market competition on annual report readability.
Secondly, previous studies mostly investigate the link between competition and disclosures (information asymmetry), based on whether managers issue more or less voluntary disclosures (e.g. Ali et al. Citation2014, Huang et al. Citation2017, Li Citation2010a). In other words, each of these studies shows the effect of competition on the quantity and quality of disclosures in terms of quantitative financial information. However, some studies in the literature (e.g. Loughran and McDonald Citation2014) suggest that, even when corporate disclosures increase, information asymmetry could also increase due to a lower level of readability. For example, Li (Citation2010b) argues that the narratives in annual reports portray future firm performance, with annual report readability having significant implications for managers’ information-obfuscating behaviour (Bloomfield Citation2008, Loughran and McDonald Citation2014). With the availability of sophisticated linguistic analysis and readability measures, we extend prior literature by linking competition with disclosure quality as reflected in annual report readability.
Thirdly, numerous studies examine firm-level strategic disclosures. However, we find limited research on strategic disclosures while using readability and lexical characteristics. Studies in this context document that firms reduce readability in response to higher earnings management, short-selling pressures, and less persistent earnings (Li Citation2008, Li and Zhang Citation2015, Lo et al. Citation2017). We contribute to, and extend, this literature by documenting a negative relationship between readability and competition.
Fourthly, one strand of the literature argues that competition disciplines managers and enhances economic and information efficiency (i.e. Chou et al. Citation2011, Giroud and Mueller Citation2010, Shleifer and Vishny Citation1997). In contrast, another strand argues that competition discourages the dissemination of information (Shi et al. Citation2018, Stoughton et al. Citation2017, Wang and Chui Citation2014). We extend this literature by documenting that firms reduce annual report readability as competition in their industry intensifies.
This paper is structured in the following sections. Section 2 reports the data, sample selection, and variables. Section 3 presents baseline findings. Section 4 addresses endogeneity and establishes the identification strategy. Section 5 presents robustness checks and some cross-sectional heterogeneity tests. Section 6 displays results from additional tests and analyses, while the paper concludes in Section 7.
2. Data, variables, and descriptive statistics
2.1. Data
To study the influence of product market competition on annual report readability, we collect data from the Center for Research in Security Prices (CRSP), Compustat, and SDC Platinum databases for the period from 1994 to 2019. We begin our sample from 1994 as the electronic data gathering, analysis, and retrieval (EDGAR) database records 10-K files mostly from that year onwards. For readability of these 10-K files, we obtain Bog Index data from Bonsall et al. (Citation2017).Footnote6 Our initial sample for product market competition variables comprises 86,021 firm-year observations. Due to missing readability data, 33,672 firm-year observations are removed. Finally, as non-missing observations are required for all variables in our regressions, we remove 9401 missing observations. Our final regression sample comprises 42,948 firm-year observations from 6376 unique firms in 384 industries (based on 4-digit SIC codes) in the United States.
2.2. VariablesFootnote7
2.2.1. Annual report readability
Following Bonsall et al. (Citation2017), we use the Bog Index (BOG) value as our key measure of readability, with this index being a multifaceted measure of plain English. The index considers the English language characteristics of disclosure, such as weak verbs, passive voice, complex words, overused words, jargon, and document length. It corrects the standard readability measures through a graded wordlist, instead of employing a syllable count or word length. The index value is estimated as the combination of three different components: ‘sentence bog’, ‘word bog’, and ‘pep’. Sentence and word bogs identify issues related to sentence length and word difficulty, whereas pep considers writing attributes based on whether readers will understand the text. Overall, a lower (higher) BOG value represents higher (lower) annual report readability (Bonsall et al. Citation2017). For robustness checks, we use a wide set of alternative measures. Specifically, based on the broad accounting and finance literature (Biddle et al. Citation2009, Dougal et al. Citation2012, Hasan Citation2020, Lawrence Citation2013, Lehavy et al. Citation2011, Li Citation2008), we use additional alternative annual report readability measures, such as Fog (FOG), Flesch (FLESCH), and Flesch–Kincaid (KINCAID) indexes.Footnote8
2.2.2. Product market competition
Our key proxy for product market competition is the firm-level Herfindahl–Hirschman Index (COMPETITIONtextual).Footnote9 Hoberg and Phillips (Citation2016) construct this index following text-based network industry classifications (TNIC) which are dynamic and derived from product descriptions reported every year in the US SEC 10-K filings. Unlike static proxies such as SIC-based codes for industries and industry-level concentration measures, Hoberg and Phillips (Citation2016) argue that the Herfindahl–Hirschman Index is dynamic and captures product similarity and competition at the firm level. A lower (higher) value for this index implies stronger (weaker) competition.
In the sensitivity analysis, following prior studies (Hou and Robinson Citation2006, Karuna Citation2007, Valta Citation2012), we use three other alternative measures of competition: industry size (COMPETITIONind_size), the Big Four Index (COMPETITIONbig_four), and Herfindahl’s Asset Index (COMPETITIONHHI). Representing the density of consumers in an industry, COMPETITIONind_size is estimated based on the log of industry-level sales at 4-digit SIC code levels. A lower (higher) value of COMPETITIONind_size represents a lower (higher) level of industry competition. For COMPETITIONbig_four, we take the ratio of sales by the four largest firms to total industry sales. A lower (higher) value on this index implies stronger (weaker) competition. Finally, for COMPETITIONHHI, we first estimate the square of firm-level market share of assets for each industry and for each year. Based on the past three years’ average, COMPETITIONHHI is then constructed for each industry-year. All the industries in this index are defined at the 4-digit SIC code level. A lower (higher) value for COMPETITIONHHI implies stronger (weaker) competition.
2.2.3. Control variables
Following Li (Citation2008) and Lo et al. (Citation2017), we include several control variables. SIZE is estimated as the natural logarithm of the market value of equity. MARKET_BOOK is calculated by taking the ratio of the aggregated book value of liabilities and the market value of equity to the book value of assets. LEVERAGE is the ratio of total debt (including the current portion) to total assets. ROA is calculated as the ratio of income, before extraordinary items, to total assets. VOL_RETURN is estimated by taking the standard deviation of monthly stock returns over a one-year period. VOL_EARNINGS is the standard deviation of operating earnings based on the last five years’ observations. AGE is measured as the number of years since a firm first appeared on the CRSP database. SPECIAL_ITEMS is estimated as the ratio of special items to total assets. SEG_BUS and SEG_GEO are the natural logarithms of the number of business segments and geographic segments, respectively. We also include the natural logarithm of the total number of NON_MISSING items on the Compustat database as one of the controls. Finally, two dummy variables are included: one for merger and acquisitions (M&As), and the other for firms incorporated in Delaware. DELAWARE is an indicator variable taking a value of 1 if a firm is incorporated in Delaware and 0 otherwise. We include DELAWARE as different corporate laws in Delaware drive different levels of annual report readability (Daines Citation2001). MA_DUMMY is also an indicator variable taking a value of 1 if a firm is an acquirer reported in the SDC Platinum Mergers and Acquisitions database and 0 otherwise. Finally, following Kothari et al. (Citation2005), we control for D_ACCRUALS which is a performance-adjusted measure of discretionary accruals.
2.3. Descriptive statistics
reports the summary statistics and distributions of the key variables. Panel A shows that both the mean and median values of the Bog Index (BOG) are around 83, which is consistent with prior studies (Bonsall and Miller Citation2017, Hasan Citation2020). Panel B presents the mean, standard deviation, and other distributions of our product market competition proxy (COMPETITIONtextual). We find that the mean (standard deviation) value of COMPETITIONtextual is 0.291 (0.283). This is similar to the summary statistics reported by He and Wintoki (Citation2016). Panel C reports the descriptive statistics for control variables related to firm characteristics. The mean firm SIZE is 5.994; the mean MARKET_BOOK ratio is 1.804; and VOL_RETURN is, on average, 0.143. Overall, all the firm characteristics are consistent with data in past studies (i.e. Hasan Citation2020, Karuna Citation2007).
Table 1. Relevant summary statistics.
presents the correlations between the key variables used in this study. COMPETITIONtextual is negatively and significantly correlated with the Bog Index (BOG) (−0.264). The sign of this correlation provides preliminary evidence that annual report readability is negatively associated with product market competition. Our study finds that most correlations between all other variables are statistically significant. These correlations are also within a reasonable range, suggesting that multicollinearity issues are less likely to be a major concern.
Table 2. Correlations.
3. Baseline results
To examine the influence of competition on annual report readability, we follow Karuna (Citation2007) and Hasan (Citation2020) and specify the following regression model:
(1)
(1) where Readabilityi,t is proxied by the Bog Index (BOG) value of the 10-K annual report for firm i at time t. Competitioni,t−1 is proxied by COMPETITIONtextual for firm i at time t–1, while control variables for firm i characteristics are: SIZE, MARKET_BOOK, LEVERAGE, ROA, VOL_RETURN, VOL_EARNINGS, AGE, SPECIAL_ITEMS, SEG_BUS, SEG_GEO, NON_MISSING, MA_DUMMY, DELAWARE, and D_ACCRUALS at time t-1. We include industry and year fixed effects in all our regression models. Furthermore, we check the robustness of our baseline results using firm and year fixed effects.
reports our baseline findings for the model specified in Equation (1). The results are consistent with the notion that increases in competition decrease annual report readability. The t-statistics are reported in parentheses, while standard errors are clustered at the firm level and corrected for heteroskedasticity.Footnote10 Values for the Bog Index (BOG) and COMPETITIONtextual are modelled as the key measures of readability and competition, respectively. Column (1) reports the ordinary least squares (OLS) regression, with COMPETITIONtextual as the key explanatory variable with industry fixed effects. In Column (2), we consider both industry and year fixed effects for any issues related to time-invariant, industry-level omitted variables. The estimated coefficients of COMPETITIONtextual at −3.543 and −4.328 in Columns (1) and (2), respectively, are statistically significant at the 1% level. These results suggest that, as product market competition increases (decreases) with a lower (higher) value for COMPETITIONtextual, readability decreases (increases) with a higher (lower) value on the Bog Index (BOG). In other words, these negative coefficients imply that the higher (lower) the competition, the lower (higher) the readability of annual reports. In terms of economic significance, the coefficient value of −4.328, implies a decrease in readability by a non-trivial amount of about 55.95% (4.328/7.735) of one standard deviation of the Bog Index (BOG) distribution. Overall, all the above results support the notion that stronger product market competition reduces annual report readability.
Table 3. Baseline results: Competition and readability.
Most of the control variables are significant and show the predicted signs. For instance, consistent with Hasan (Citation2020) and Lo et al. (Citation2017), higher size (SIZE), leverage ratio (LEVERAGE), volatility of returns (VOL_RETURN), volatility of earnings (VOL_EARNINGS), complexity (SEG_BUS, SEG_GEO, NON_MISSING), and special circumstances (MA_DUMMY, DELAWARE) are linked with lower annual report readability, while higher profitability (ROA) and higher company age (AGE) are associated with higher annual report readability.
4. Endogeneity and identification strategy
At this point, the results suggest that firms reduce their annual report readability when facing higher competition. However, our baseline results do not imply causality, as product market competition can be endogenous. For example, firms can strategically formulate their corporate policies to impact on their competitive structure. Prior studies in the literature (e.g. Billett et al. Citation2017, Bolton and Scharfstein Citation1990) show that the firm-level information environment can also influence competition. Thus, corporate disclosure policies and competition can be jointly determined. Moreover, some firm-level omitted variables could drive our results. We address these endogeneity issues in several ways. Firstly, using the exogenous shocks of reductions in import-related tariffs, we design a quasi-natural experiment and run a difference-in-differences (DiD) test. As these shocks not only increase the intensity of competition, but are also exogenous to all firms in the affected industries, we expect to add increased validity to our baseline results. Secondly, we include the lagged value of the Bog Index (BOG) as an additional control variable and run a regression of firm fixed effects to address omitted time-invariant, firm-level characteristics. Lastly, we use the instrumental variable approach in which the earliest year COMPETITIONtextual is an instrument for the current level of product market competition. Collectively, these identification strategies are all used to mitigate any endogeneity in the link between competition and annual report readability.
4.1. Import tariffs as a quasi-natural experiment
Following Fresard (Citation2010) and Valta (Citation2012), we design a quasi-natural experiment in which significant reductions in import-related tariffs are identified as exogenous shocks to product market competition. Prior literature suggests that these significant reductions trigger competition in the affected industries (Fresard Citation2010, Valta Citation2012).Footnote11 We initially use import data (1974–2005) compiled by Feenstra (Citation1996), Feenstra et al. (Citation2002), and Schott (Citation2010). These data are then matched with our regression sample, yielding a treatment sample for the period from 1994 to 2005. For each 4-digit SIC industry-year level, we estimate the ad valorem tariff, calculated as the ratio of duties collected at US Customs and the free-on-board imported value. Next, to qualify as a shock event, tariff changes must be negative and greater than at least three times the industry average. Furthermore, to make our competitive shocks more non-transitory and more reliable, we exclude import tariff shocks if we observe a large increase of equivalent value in tariffs in a subsequent three-year time window. We also exclude tariffs of less than 1%. Overall, using US tariff data for the period from 1994 to 2005 and with the above filtering, we derive 75 shock events in 53 different 4-digit SIC code levels.
Next, we design the quasi-natural experiment in which treated firms in industries are defined as firms that face import-related tariff shocks during the sample period. In the spirit of Adhikari et al. (Citation2018), Atawnah et al. (Citation2018), and Valta (Citation2012), all our control variables are used for matching between treated and control firms. Specifically, we use the propensity score matching (nearest-neighbor) technique with a 0.005 caliper to construct our sample. Our sample comprises 625 firm-year observations in each of the treated and control groups. The descriptive statistics of all the matching variables are presented in . This matching is performed a year before the selected tariff shocks. The Kolmogorov–Smirnov test results document no significant differences in the distributions of matching variables between the treated and control groups.Footnote12
Table 4. Identification strategy: Ex-ante summary statistics of the matching variables.
Empirically, to examine the impact on annual report readability of exogenous shocks to import-related tariffs, we use three different time windows (−1/+1, −2/+2, −3/+3) for our regression analysis where (−1/+1), (−2/+2), and (−3/+3) represent one, two, and three years before and after the shocks, respectively. shows how treated firms change their annual report readability compared to control firms. We plot changes in readability (BOG) around the exogenous shocks in import tariffs. We find that the change in the Bog index (BOG) is significantly positive and higher for treated firms than for control firms after these tariff shocks. This provides an initial indication that annual report readability decreases following exogenous shocks to import tariffs.Footnote13 To formally test this, we run the following difference-in-differences (DiD) multivariate regression model:
(2)
(2) where TREATED and POST are indicator variables. We define treated firms (TREATED) as those that face shocks in tariffs, while POST represents firm-year observations after tariff shocks. The interaction term (TREATED × POST) shows whether competition driven by tariff shocks induces firms to reduce their annual report readability in the post-shock period. The control variables’ results are similar to the baseline specifications in Model (1) and are reported in .
Figure 1. Readability (BOG index) response to tariff reductions. This figure shows how the treated firms change their readability compared to matched firms. We plot change in BOG index for the difference-in-differences estimate of the treated firms compared to control firms. Positive change in BOG index suggests less readability. The sample includes 75 shock events in 53 industries that experience tariff reductions over the period 1994–2005.
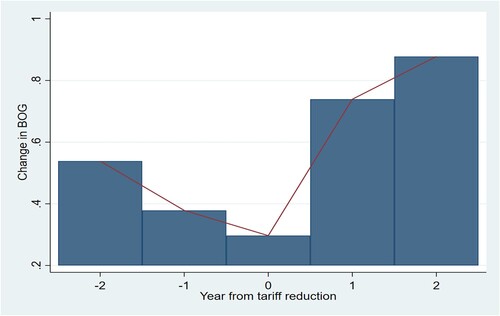
Table 5. Identification strategy by difference-in-differences test: Exogenous shocks in import tariffs.
We find that the interaction term (TREATED × POST) is significantly positive in most of the specifications. This implies that firms experience a decrease in their annual report readability when competition rises after tariff shocks. Hence, this finding is consistent with our baseline results reported in .
Despite the use of a matched sample and tariff shocks in our quasi-natural experiment, concerns may still arise that: (i) tariff shocks are not necessarily increasing competition levels either from current competitors or from new entrants and/or (ii) our treated firms (generally by nature) have less annual report readability. Consequently, our results could be mechanical. To allay these concerns, we need to formally test the linkage between tariff shocks and different competition measures and the assumption of parallel trends. In other words, for the validity of our quasi-natural experiment and its results, we first must show that competition increases for tariff shocks, with no statistical difference in annual report readability between treated and control firms when no tariff shocks occur.
We conduct three analyses to address these issues. Firstly, we apply the same difference-in-differences (DiD) design (as in Model [2]) to different competition measures to check whether tariff shocks increase the intensity of competition from either existing competitors or new entrants. Specifically, four different measures are used for existing competition: COMPETITIONtextual, COMPETITIONHHI, COMPETITIONbig_four, and COMPETITIONind_size. We also use two proxies to measure competition from new entrants: COMPETITIONind_entry and COMPETITIONind_diff. , Panel A displays the results. We find that our difference-in-differences (DiD) coefficients (TREATED × POST) are negatively significant with COMPETITIONtextual, COMPETITIONHHI, and COMPETITIONbig_four and positively significant with COMPETITIONind_size. However, no significant results are found for the proxies for competition from new entrants. These results suggest that tariff shocks increase competition from existing competitors. Moreover, these findings are consistent with those of Huang et al. (Citation2017), who use similar tariff shocks, arguing that competition is mainly between existing competitors following tariff shocks.
Table 6. Validity tests of our quasi-natural experiment.
Secondly, we run regressions to check the parallel trends assumption, that is, whether annual report readability is the same for treated groups and control groups before tariff shocks and significantly different following these shocks. In our regression, T_SHOCK−1, T_SHOCK−2, T_SHOCK−3, T_SHOCK0, T_SHOCK+1, T_SHOCK+2, and T_SHOCK+3 are the key variables. Aside from T_SHOCK0 which denotes the shock year, the others are dummy coded variables indicating treated firms one, two, and three years before and after the shocks to import tariffs. , Panel B displays the results. We find that none of the coefficients of T_SHOCK−1, T_SHOCK−2, T_SHOCK−3, and T_SHOCK0 are statistically significant which clearly satisfies the parallel trends assumption. More importantly, we find positive significant coefficients for T_SHOCK+1, T_SHOCK+2, and T_SHOCK+3. Thirdly, to further satisfy the parallel trends assumption, we use a falsification (placebo) test, in which firms are assigned reductions in import tariffs (the placebo) randomly in those years in which such reductions do not actually take place. These firms are defined as placebo TREATED firms for the falsification test. We assume that these placebo tariff reductions occur at least four years before actual shocks to import tariffs, defining POST as an indicator variable for observations after the placebo shocks. Using regression samples constructed one, two, and three years before and after the placebo shocks (−1/+1, −2/+2, −3/+3), we perform the regression model specified in Equation (2). If our prior results are mechanical and systematic, we expect to obtain a similar positive and significant coefficient for the interaction term (TREATED × POST). , Panel C presents the results of this placebo test. Importantly, none of the interaction coefficients are significant, implying that competition does not cause firms to reduce their annual report readability after placebo tariff shocks.Footnote14 This result further allays the mechanical relationship concern in our difference-in-differences (DiD) specification and bolsters the validity of this setting.
4.2. Further checks to address endogeneity issues
Another possible concern is that tariffs, being industry specific, could affect firms in ambiguous ways. Moreover, some firm-level omitted variables could drive our results. In this section, we further address these endogeneity issues using three other tests. Firstly, we use the lagged value of the Bog Index (BOG) as an additional control. This method could mitigate omitted variable bias as both Bog Index (BOG) values at time t and t-1 are influenced by similar omitted time-invariant characteristics. , Column 1 shows this result. We report that our product market competition variable (COMPETITIONtextual) still has a negative and significant coefficient at the 1% level. Secondly, we utilise firm and year fixed effects regressions which could mitigate concerns related to omitted, time-invariant firm-level characteristics. Column (2) documents this result and shows that our baseline results remain qualitatively unchanged. Thirdly, following Waisman (Citation2013) and Rahman et al. (Citation2021), we use the earliest year COMPETITIONtextual as an instrument (INSTRUMENT) for the current level of competition. This instrument fulfils both the exclusion and relevance criteria as the historical and current level of competition is positively associated. Importantly, it is unlikely that annual report readability is related to this instrument except through the current level of competition. Columns (3) and (4) show the first and second stages of this instrumental variable approach, respectively. As shown in the first stage, our estimated coefficient for INSTRUMENT is positive and significant. In the second stage, we find that the estimated coefficient of the instrumented COMPETITIONtextual remains significantly negative.Footnote15 Overall, these tests all further address endogeneity issues.
Table 7. Robustness: Addressing endogeneity further.
5. Robustness checks and cross-sectional heterogeneity tests
5.1. Robustness checks
Under robustness checks, we firstly include three additional control variables to address alternative explanations. Prior studies (e.g. Bushee et al. Citation2018, Li Citation2008, Lim et al. Citation2018, Lo et al. Citation2017) show that poor firm performance, complexity, and business strategy affect annual report readability and, therefore, may confound our results. Our baseline results control for firm performance (ROA), complexity (SEG_BUS, SEG_GEO, and NON_MISSING) and other firm characteristics. We further control for poor firm performance with a dummy variable (LOSS_DUMMY) that takes the value of 1 for negative profitability and 0 otherwise; linguistic complexity by including the natural logarithm of 10-K file size in megabytes (10K_SIZE)Footnote16; and a business strategy variable. Following Bentley et al. (Citation2013), we create our business strategy variable (BUS_STRATEGY), based on the sum of the quintile ranking of six variables comprising: research intensity; marketing and advertising efforts; historical growth; operational efficiency; capital intensity; and organisational stability. These six variables are measured as follows: research intensity as the ratio of R&D expenditures to sales; marketing and advertising efforts as the ratio of selling, general, and administrative expenses to sales; historical growth as the one-year percentage change in total sales; operational efficiency as the ratio of total employees to sales; capital intensity as the ratio of net property, plant, and equipment to total assets; and organisational stability as the standard deviation of the total number of employees. A higher BUS_STRATEGY score shows a prospector innovation-oriented strategy. Prior studies in the literature (e.g. Lim et al. Citation2018) document a negative relationship between a prospector innovation-oriented strategy and annual report readability. presents the results after including these additional control variables. We find that our baseline coefficient (COMPETITIONtextual) remains qualitatively unchanged.
Table 8. Robustness: additional controls.
Secondly, presents the results of sensitivity analyses using several alternative measures of annual report readability. We use three additional readability measures, namely, Fog (FOG), Flesch (FLESCH), and Flesch–Kincaid (KINCAID) indexes. Higher values for FOG and KINCAID indexes represent lower readability, whereas a higher value for the FLESCH Index reflects higher readability. The results are reported in , Columns (1), (2), and (3), respectively. We find that the estimated coefficients are significantly negative for FOG and KINCAID indexes and positive for the FLESCH Index. These results further support our baseline findings that product market competition has a negative relationship with annual report readability.
Table 9. Robustness: Alternative measures of 10-K readability.
Thirdly, we analyse the readability of the management discussion and analysis (MD&A) segment of annual reports. This segment is more likely to capture forward-looking proprietary information than the entire annual report which contains predominantly historical information. shows the sensitivity of our baseline results to the MD&A readability measures. The results remain qualitatively similar to our original baseline findings.
Table 10. Robustness: Readability of MD&A.
Fourthly, we also check the sensitivity of our baseline findings with respect to three additional alternative measures of competition: COMPETITIONind_size, COMPETITIONbig_four (Karuna Citation2007, Valta Citation2012), and COMPETITIONHHI (Hou and Robinson Citation2006). COMPETITIONind_size represents the density of consumers in an industry. We estimate industry size based on the log of industry sales at the 4-digit SIC code levels. A lower (higher) value of COMPETITIONind_size implies a lower (higher) level of competition. The COMPETITIONbig_four Index is the ratio of the sales of the four largest firms to total industry sales. Finally, to measure COMPETITIONHHI, we first estimate the square of the firm-level market share of assets for each industry and for each year. The index for an industry for each year is constructed based on the past three years’ average with all industries being defined at the 4-digit SIC code level. A lower (higher) value for the COMPETITIONHHI Index implies a stronger (weaker) level of competition. summarises the results for all alternative measures of product market competition. A lower (higher) value of COMPETITIONind_size (COMPETITIONbig_four or COMPETITIONHHI) reflects a higher industry market concentration and a lower level of competition. Here, we re-run Model (1) and find that the significance and signs of all estimated coefficients remain qualitatively unchanged.
Table 11. Robustness: Alternative measures of competition.
Finally, as prior studies argue that firms employ different forms of disclosure for different types of competition (Clinch and Verrecchia Citation1997, Verrecchia Citation1983, Verrecchia Citation1990), we exclude the alternative explanation related to new entrants. In our baseline setting, we capture competition from existing competitors. In this section, we empirically test whether competition from new entrants has any influence on annual report readability. We measure competition from new entrants by two variables: COMPETITIONind_entry and COMPETITIONind_diff. Following Karuna (Citation2007), we measure COMPETITIONind_entry as the minimal investment required to begin production. We calculate minimal investment by considering the weighted average value of the property, plant, and equipment for firms classified with a 4-digit SIC code. As entry cost is highly skewed, we take the natural logarithm of this variable. For COMPETITIONind_diff, also following Karuna (Citation2007), we estimate product substitutability by the price–cost margin at the 4-digit SIC code industry level. presents the results, with none of the coefficients found to be statistically significant. This implies that competition from potential entrants has no significant impact on annual report readability. In other words, competition from new entrants does not drive our results.
Table 12. Additional analysis: competition from new entrants and annual report readability.
5.2. Cross-sectional heterogeneity
Our main finding suggests that, with increasing competition in an industry, firms reduce annual report readability. Prior studies in the literature document that competition could discourage the sharing of information as industry competitors may exploit proprietary information and damage a firm's competitive position (e.g. Verrecchia Citation1983). In this section, we report the results of several cross-sectional tests conducted to substantiate this conjecture. Firstly, we examine whether the influence of competition on annual report readability is stronger for firms with higher R&D intensity and for firms that have risks related to trade secrecy. Secondly, we analyse how the main relationship between product market competition and annual report readability is moderated by CEO performance incentives.
5.2.1. Research and development (R&D) intensity and trade secrecy
We argue that firms reduce their annual report readability in response to a higher level of competition to protect their proprietary information and competitive position. Firstly, firms with higher investments in R&D generally have higher levels of proprietary information (Jones Citation2007). Extant literature documents that competitive firms are reluctant to share proprietary information (Darrough and Stoughton Citation1990, Gertner et al. Citation1988, Harris Citation1998, Hayes and Lundholm Citation1996, Verrecchia Citation1983). Accordingly, we argue that firms with higher levels of R&D intensity withhold proprietary information to protect their competitive position. We, therefore, hypothesize that the decline in annual report readability should be stronger for R&D-intensive firms.
We create the variable, R&D_INTENSITY, which is estimated as the annual R&D expenditures divided by total assets for each firm. Following prior studies (e.g. Atawnah et al. Citation2018), R&D expenditures are assumed to be 0 if the value is missing on the Compustat database. We interact R&D_INTENSITY with COMPETITIONtextual and display the results in , Column (1). We find that the interaction term (COMPETITIONtextual × R&D_INTENSITY) is significantly negative, which suggests that R&D intensity magnifies the impact of competition on annual report readability.
Table 13. Cross-sectional tests: The role of R&D intensity, trade secrecy, and CEO incentives.
Secondly, several recent studies in the literature (e.g. Glaeser Citation2018, Li et al. Citation2018) show that firms with higher levels of trade secrecy (proprietary information) reduce the level of transparency of their financial disclosures. According to SEC Regulation S-K (Item 601), firms with trade secrecy must report the risk related to their trade secrets in their 10-K reports. In line with competition's proprietary cost argument, we hypothesize that the effect of competition on annual report readability is more pronounced for firms with proprietary information related to trade secrets.
Following Glaeser (Citation2018), we generate a variable (TRADE_SECRECY) taking a value of 1 for trade secrecy reporting in annual reports and 0 otherwise. We interact TRADE_SECRECY with COMPETITIONtextual in our regression model. , Column (2) reports this result, with our baseline coefficient (COMPETITIONtextual) found to remain significantly negative. More importantly, the interaction term (COMPETITIONtextual × TRADE_SECRECY) is also negative and significant. Overall, these results imply that proprietary cost is one of the most significant channels through which product market competition reduces annual report readability.
5.2.2. CEO incentives
In this section, we report our investigation of how the influence of competition on annual report readability is moderated by CEO performance incentives. We argue that options-based performance incentives could drive managers to reduce readability in their financial disclosures. This emanates from information hoarding behaviour related to the proprietary information argument. Karuna (Citation2007) shows that options-based incentives increase when competition increases. The intended objective of this options-based compensation is to motivate managers to achieve higher productivity (Raith Citation2003). Importantly, these incentives reduce the likelihood of executive turnover (Erkens Citation2011) and of the leakage of proprietary information to competitors. Reconciling all these findings, we hypothesize that the relationship between annual report readability and product market competition is more pronounced when CEO risk incentives increase.
We create a variable called CEO_VEGA to test this conjecture. Specifically, CEO_VEGA is estimated as the change in a CEO’s personal wealth for 0.01 change in the standard deviation of returns.Footnote17 Consistent with Hirshleifer et al. (Citation2012), our regression model takes the natural logarithm of (1+CEO_VEGA). We interact CEO_VEGA with COMPETITIONtextual and display the results in , Column (3), with this interaction term found to be significantly negative. This result implies that CEO risk incentives make the relationship between annual report readability and product market competition more pronounced.
6. Additional analyses
To this point, our results show that competitive firms reduce their annual report readability. In this section, we examine how firms reduce annual report readability. Studies in the literature show that managers could increase tone ambiguity to reduce readability and hoard news from external investors (Ertugrul et al. Citation2017). The study links tone ambiguity in 10-K reports to the information-hiding activities of managers. Similarly, managers might increase tone ambiguity in their annual reports in a highly competitive environment to retain competitive advantage.
Following Ertugrul et al. (Citation2017), we use two measures: WEAK_MODAL and UNCERTAINTY. Both these measures use sentiment word counts (as defined by Loughran and McDonald Citation2011) in annual reports. Accordingly, we define WEAK_MODAL and UNCERTAINTY as the percentage count of weak modal and uncertain words, respectively. We regress both these tone ambiguity measures on competition, with the control variables outlined in our baseline model, that is, Model (1). We hypothesize that a high level of competition increases tone ambiguity. In other words, we predict an inverse relationship between the tone ambiguity measures (WEAK_MODAL and UNCERTAINTY) and COMPETITIONtextual.
shows the results from testing this hypothesis. Column (1) reports the coefficient for the relationship between WEAK_MODAL and COMPETITIONtextual, while Column (2) shows the corresponding result for UNCERTAINTY. The estimated coefficients of COMPETITIONtextual are significantly negative. This implies that increases in competition drive firms to increase tone ambiguity in their annual reports. The coefficient value (−0.103) reported in Column (1) indicates that if competition increases (i.e. decreases in COMPETITIONtextual), tone ambiguity (i.e. WEAK_MODAL) increases by about 52.82% (standard deviation of WEAK_MODAL = 0.195; the change is 0.103/0.195) of one standard deviation of the distribution. This result further supports our main results that product market competition induces firms to increase tone ambiguity in annual reports which reduces their readability.
Table 14. Additional analysis: competition and tone ambiguity in annual reports.
7. Conclusion
Annual reports are considered one of the main sources of information for all stakeholders. Less readable reports have major implications, such as increased risk of a stock price crash and increased cost of capital. Hence, this emerging area of research seeks to understand what drives annual report readability. In this study, we link competition with annual report readability, documenting that competitive firms reduce the readability of their annual reports. Through a range of robustness checks and, more importantly, using the exogenous shocks of import-related tariffs, we further bolster the claim that firms reduce their annual report readability in more competitive industries. Additionally, we find that the effect of product market competition on annual report readability is more pronounced for firms with a higher level of trade secrecy (proprietary information), for R&D-intensive firms, and for firms with higher levels of CEO performance-based incentives. Overall, our study makes significant contributions to the growing amount of literature on competition and the readability of corporate disclosures.
Acknowledgments
We thank the editor, associate editor, and two anonymous reviewers for their constructive comments. We also acknowledge helpful comments while presenting this paper in 2019 Australasian Finance & Banking Conference and 2019 New Zealand Finance Meeting.
Disclosure statement
No potential conflict of interest was reported by the author(s).
Notes
1 Prior literature also documents the association between readability and firm performance (Baxamusa et al. Citation2018); investment efficiency (Biddle et al. Citation2009), information efficiency of stock prices (Lee Citation2012, Yekini et al. Citation2016); cost of capital and stock price crash risk (Ertugrul et al. Citation2017, Kim et al. Citation2019); corporate liquidity and payout policies (Hasan and Habib Citation2020); cash holding and derivative use (Friberg and Seiler Citation2017); analyst forecasts (Lehavy et al. Citation2011); and individual investment decisions (Lawrence Citation2013).
2 The constituents and suitability of this index are described in the variable description.
3 We also consider tariff shocks that are two times and four times greater than the industry average in our difference-in-differences (DiD) design. Our results remain qualitatively similar. The results are un-tabulated and available upon request.
4 Following Huang et al. (Citation2017), we argue that these shocks increase competition from existing competitors rather than from new entrants. Contingent on the existing market structure, new competition (i.e. new exporters) needs more lead time than the existing rivals to enter the industry. As a result, when tariffs decrease, their effect on the U.S. import should be reflected in subsequent years. Huang et al. (Citation2017), who use the same tariff shocks we do, show that the import volume principally increases in the year of tariff cut while increases in subsequent years is minimal. This indicates that the competition is mainly among the existing rivals who quickly take advantage of the tariffs cut. We also empirically validate that tariff shocks increase the degree of competition from existing competitors. For details, see Section 4.1 and , Panel A.
5 We also use firm fixed effects and a lagged Bog Index value as an additional control variable to address omitted variable concern and find consistent results.
6 The Bog Index data are retrieved from Brian P. Miller’s webpage at Kelley School of Business, Indiana University <https://kelley.iu.edu/bpm/activities/bogindex.html>.
7 The definitions of variables appear in the Appendix. All the continuous variables are winsorized at the 1% level in both tails to control for outliers.
8 The data for these measures are retrieved from <http://webuser.bus.umich.edu/feng/>.
9 This index is available at <http://hobergphillips.tuck.dartmouth.edu/industryconcen.htm>.
10 Our baseline results are also robust at industry-level clustering. These results are available upon request.
11 As suggested by one anonymous reviewer of our paper, we empirically check whether tariff shocks affect industry competition using multiple measures. For details, see , Panel A.
12 We note that only ROA is significantly different at the 5% level. However, this difference is not expected to be of such high relevance to warrant further investigation, particularly given that treated firms have higher profitability compared to control firms.
13 We also conduct a cross-sectional test using pre-shock competition (high vs. low competition based on sample median of COMPETITIONtextual) as a sorting variable. We find that firms with low competition group experience a more significant decrease in readability after the shock than pre-shock period. The results are un-tabulated and available upon request.
14 This process is repeated 1000 times and the results (distribution) provide evidence consistent with our results in . The distribution is un-tabulated and available upon request.
15 ’s bottom panel reports the diagnostic statistics. Our instrument is neither weak nor under-identified; Wu–Hausman’s F statistic (84.277) is significant at the 1% level; no over-identifying restrictions are found.
16 All our regression results in this paper remain qualitatively unchanged with the inclusion of 10K_SIZE as an additional control variable. The results are available upon request.
17 We obtain CEO_VEGA data from Coles et al. (Citation2006).
References
- Adhikari, B., Bindal, S., Campbell, T.C., and Johnson, S.A., 2018. Competing against overconfident CEOs. Available at SSRN 3223778.
- Ali, A., Klasa, S., and Yeung, E., 2014. Industry concentration and corporate disclosure policy. Journal of Accounting and Economics, 58, 240–264.
- Atawnah, N., Balachandran, B., Duong, H.N., and Podolski, E.J., 2018. Does exposure to foreign competition affect stock liquidity? Evidence from industry-level import data. Journal of Financial Markets, 39, 44–67.
- Baxamusa, M., Jalal, A., and Jha, A., 2018. It pays to partner with a firm that writes annual reports well. Journal of Banking & Finance, 92, 13–34.
- Bentley, K.A., Omer, T.C., and Sharp, N.Y., 2013. Business strategy, financial reporting irregularities, and audit effort. Contemporary Accounting Research, 30, 780–817.
- Biddle, G.C., Hilary, G., and Verdi, R.S., 2009. How does financial reporting quality relate to investment efficiency? Journal of Accounting and Economics, 48, 112–131.
- Billett, M.T., Garfinkel, J.A., and Yu, M., 2017. The effect of asymmetric information on product market outcomes. Journal of Financial Economics, 123, 357–376.
- Bloomfield, R., 2008. Discussion of “annual report readability, current earnings, and earnings persistence”. Journal of Accounting and Economics, 45, 248–252.
- Bolton, P. and Scharfstein, D.S., 1990. A theory of predation based on agency problems in financial contracting. The American Economic Review, 80, 93–106.
- Bonsall, S.B. and Miller, B.P., 2017. The impact of narrative disclosure readability on bond ratings and the cost of debt. Review of Accounting Studies, 22, 608–643.
- Bonsall, S.B., Leone, A.J., Miller, B.P., and Rennekamp, K., 2017. A plain English measure of financial reporting readability. Journal of Accounting and Economics, 63, 329–357.
- Bushee, B.J., Gow, I.D., and Taylor, D.J., 2018. Linguistic complexity in firm disclosures: obfuscation or information? Journal of Accounting Research, 56, 85–121.
- Chou, J., Ng, L., Sibilkov, V., and Wang, W., 2011. Product market competition and corporate governance. Review of Development Finance, 1, 114–130.
- Clinch, G. and Verrecchia, R.E., 1997. Competitive disadvantage and discretionary disclosure in industries. Australian Journal of Management, 22, 125–137.
- Coles, J.L., Daniel, N.D., and Naveen, L., 2006. Managerial incentives and risk-taking⋆. Journal of Financial Economics, 79, 431–468.
- Daines, R., 2001. Does Delaware law improve firm value? Journal of Financial Economics, 62, 525–558.
- Darrough, M.N. and Stoughton, N.M., 1990. Financial disclosure policy in an entry game. Journal of Accounting and Economics, 12, 219–243.
- Datta, S., Iskandar-Datta, M., and Sharma, V., 2011. Product market pricing power, industry concentration and analysts’ earnings forecasts. Journal of Banking & Finance, 35, 1352–1366.
- Datta, S., Iskandar-Datta, M., and Singh, V., 2013. Product market power, industry structure, and corporate earnings management. Journal of Banking & Finance, 37, 3273–3285.
- Dougal, C., Engelberg, J., Garcia, D., and Parsons, C.A., 2012. Journalists and the stock market. Review of Financial Studies, 25, 639–679.
- Erkens, D.H., 2011. Do firms use time-vested stock-based pay to keep research and development investments secret? Journal of Accounting Research, 49, 861–894.
- Ertugrul, M., Lei, J., Qiu, J., and Wan, C., 2017. Annual report readability, tone ambiguity, and the cost of borrowing. Journal of Financial and Quantitative Analysis, 52, 811–836.
- Feenstra, R.C., 1996. US imports, 1972–1994: data and concordances (No. w5515). National Bureau of Economic Research.
- Feenstra, R.C., Romalis, J., and Schott, P.K., 2002. US imports, exports, and tariff data, 1989–2001 (No. w9387). National Bureau of Economic Research.
- Fresard, L., 2010. Financial strength and product market behavior: the real effects of corporate cash holdings. The Journal of Finance, 65, 1097–1122.
- Friberg, R. and Seiler, T., 2017. Risk and ambiguity in 10-Ks: an examination of cash holding and derivatives use. Journal of Corporate Finance, 45, 608–631.
- Gertner, R., Gibbons, R., and Scharfstein, D., 1988. Simultaneous signalling to the capital and product markets. The RAND Journal of Economics, 19, 173–190.
- Giroud, X. and Mueller, H.M., 2010. Does corporate governance matter in competitive industries? Journal of Financial Economics, 95, 312–331.
- Glaeser, S., 2018. The effects of proprietary information on corporate disclosure and transparency: evidence from trade secrets. Journal of Accounting and Economics, 66, 163–193.
- Guo, Y., Jung, B., and Yang, Y.S., 2019. On the nonlinear relation between product market competition and earnings quality. Accounting and Business Research, 49, 818–846.
- Harris, M.S., 1998. The association between competition and managers’ business segment reporting decisions. Journal of Accounting Research, 36, 111–128.
- Hart, O., 1983. The market mechanism as an incentive scheme. The Bell Journal of Economics, 14, 366–382.
- Hasan, M.M., 2020. Readability of narrative disclosures in 10-K reports: does managerial ability matter? European Accounting Review, 29, 147–168.
- Hasan, M.M. and Habib, A., 2020. Readability of narrative disclosures, and corporate liquidity and payout policies. International Review of Financial Analysis, 68, 101460.
- Haw, I.M., Hu, B., and Lee, J.J., 2015. Product market competition and analyst forecasting activity: international evidence. Journal of Banking & Finance, 56, 48–60.
- Hayes, R.M. and Lundholm, R., 1996. Segment reporting to the capital market in the presence of a competitor. Journal of Accounting Research, 34, 261–279.
- He, Z. and Wintoki, M.B., 2016. The cost of innovation: R&D and high cash holdings in U.S. firms. Journal of Corporate Finance, 41, 280–303.
- Hirshleifer, D., Low, A., and Teoh, S.H., 2012. Are overconfident CEOs better innovators? The Journal of Finance, 67, 1457–1498.
- Hoberg, G. and Phillips, G., 2016. Text-based network industries and endogenous product differentiation. Journal of Political Economy, 124, 1423–1465.
- Hou, K. and Robinson, D.T., 2006. Industry concentration and average stock returns. The Journal of Finance, 61, 1927–1956.
- Huang, Y., Jennings, R., and Yu, Y., 2017. Product market competition and managerial disclosure of earnings forecasts: evidence from import tariff rate reductions. The Accounting Review, 92, 185–207.
- Jiang, L., Levine, R., and Lin, C., 2016. Competition and bank opacity. Review of Financial Studies, 29, 1911–1942.
- Jones, D.A., 2007. Voluntary disclosure in R&D-intensive industries*. Contemporary Accounting Research, 24, 489–522.
- Karuna, C., 2007. Industry product market competition and managerial incentives. Journal of Accounting and Economics, 43, 275–297.
- Kim, C., Wang, K., and Zhang, L., 2019. Readability of 10-K reports and stock price crash risk. Contemporary Accounting Research, 36, 1184–1216.
- Kothari, S.P., Leone, A.J., and Wasley, C.E., 2005. Performance matched discretionary accrual measures. Journal of Accounting and Economics, 39, 163–197.
- Lawrence, A., 2013. Individual investors and financial disclosure. Journal of Accounting and Economics, 56, 130–147.
- Lee, Y.J., 2012. The effect of quarterly report readability on information efficiency of stock prices*. Contemporary Accounting Research, 29, 1137–1170.
- Lehavy, R., Li, F., and Merkley, K., 2011. The effect of annual report readability on analyst following and the properties of their earnings forecasts. The Accounting Review, 86, 1087–1115.
- Li, F., 2008. Annual report readability, current earnings, and earnings persistence. Journal of Accounting and Economics, 45, 221–247.
- Li, X., 2010a. The impacts of product market competition on the quantity and quality of voluntary disclosures. Review of Accounting Studies, 15, 663–711.
- Li, F., 2010b. Textual analysis of corporate disclosure: A survey of the literature. Journal of Accounting Literature, 29, 143–165.
- Li, Y. and Zhang, L., 2015. Short selling pressure, stock price behavior, and management forecast precision: evidence from a natural experiment. Journal of Accounting Research, 53, 79–117.
- Li, Y., Lin, Y., and Zhang, L., 2018. Trade secrets law and corporate disclosure: causal evidence on the proprietary cost hypothesis. Journal of Accounting Research, 56, 265–308.
- Lim, E.K., Chalmers, K., and Hanlon, D., 2018. The influence of business strategy on annual report readability. Journal of Accounting and Public Policy, 37, 65–81.
- Lo, K., Ramos, F., and Rogo, R., 2017. Earnings management and annual report readability. Journal of Accounting and Economics, 63, 1–25.
- Loughran, T. and McDonald, B., 2011. When is a liability not a liability? Textual analysis, dictionaries, and 10-Ks. The Journal of Finance, 66, 35–65.
- Loughran, T. and McDonald, B., 2014. Measuring readability in financial disclosures. The Journal of Finance, 69, 1643–1671.
- Markarian, G. and Santalo, J., 2014. Product market competition, information and earnings management. Journal of Business Finance & Accounting, 41, 572–599.
- Miller, B.P., 2010. The effects of reporting complexity on small and large investor trading. The Accounting Review, 85, 2107–2143.
- Muiño, F. and Núñez-Nickel, M., 2016. Multidimensional competition and corporate disclosure. Journal of Business Finance & Accounting, 43, 298–328.
- Peress, J., 2010. Product market competition, insider trading, and stock market efficiency. The Journal of Finance, 65, 1–43.
- Rahman, D., Kabir, M., and Oliver, B., 2021. Does exposure to product market competition influence insider trading profitability? Journal of Corporate Finance, 66, 101792.
- Raith, M., 2003. Competition, risk, and managerial incentives. American Economic Review, 93, 1425–1436.
- Schmidt, K.M., 1997. Managerial incentives and product market competition. The Review of Economic Studies, 64, 191–213.
- Schott, P., 2010. U.S. manufacturing exports and imports by SIC and NAICS category and partner country, 1972 to 2005. Working paper. Yale School of Management.
- Shi, G., Sun, J., and Zhang, L., 2018. Product market competition and earnings management: a firm-level analysis. Journal of Business Finance & Accounting, 45, 604–624.
- Shleifer, A. and Vishny, R.W., 1997. A survey of corporate governance. The Journal of Finance, 52, 737–783.
- Stoughton, N.M., Wong, K.P., and Yi, L., 2017. Investment efficiency and product market competition. Journal of Financial and Quantitative Analysis, 52, 2611–2642.
- Valta, P., 2012. Competition and the cost of debt. Journal of Financial Economics, 105, 661–682.
- Verrecchia, R.E., 1983. Discretionary disclosure. Journal of Accounting and Economics, 5, 179–194.
- Verrecchia, R.E., 1990. Information quality and discretionary disclosure. Journal of Accounting and Economics, 12, 365–380.
- Waisman, M., 2013. Product market competition and the cost of bank loans: evidence from state antitakeover laws. Journal of Banking & Finance, 37, 4721–4737.
- Wang, Y. and Chui, A.C., 2014. Product market competition and audit fees. Auditing: A Journal of Practice & Theory, 34, 139–156.
- Wang, T.Y. and Winton, A., 2021. Industry informational interactions and corporate fraud. Journal of Corporate Finance, 69, 102024.
- Yekini, L.S., Wisniewski, T.P., and Millo, Y., 2016. Market reaction to the positiveness of annual report narratives. The British Accounting Review, 48, 415–430.