
Abstract
Objectives
To analyse the mineral content of tap water in Flanders and assess if the region one lives in could prevent or precipitate stone formation due to a difference in mineral content.
Methods
Data from six water companies providing tap water to nine regions in Flanders regarding calcium, magnesium, potassium, sodium and sulphate content in tap water was retrieved. Minimum and maximum values were collected and compared between the different geographical regions.
Results
The highest calcium level was found in region 9 with a value of 157.0 mg/L, which is almost 10 times the value found in region 8 (16.1 mg/L). Region 6 had the highest magnesium (31.8 mg/L), potassium (30.5 mg/L), sodium (126.6 mg/L) and sulphate (218.5 mg/L) levels. The lowest level of magnesium (2.7 mg/L) was found in region 1, which was almost 12 times lower as in Region 6. Region 9 had the lowest level of potassium (1.5 mg/L), which is a factor 20 lower than Region 6. The lowest sodium and sulphate levels were found in region 8 (6.8 mg/L and 3.0 mg/L), respectively. The difference between the highest and lowest level of sulphate was a factor 70.
Conclusion
There is a broad range in the minerals found in tap water between the different production sites in the nine distribution regions in Flanders. However, due to the high standards tap water has to meet in Flanders, the region one lives in will not lead to a higher or lower risk of kidney stone formation if the advised 2 to 3 L per day are consumed.
Introduction
Kidney stones are highly prevalent worldwide. Not only do they have an important morbidity and health impact, they also significantly affect the quality of life of kidney stone patients [Citation1]. Because recurrence rates and cost associated with kidney stone treatment are high, preventive measurements are important. One of the cornerstones of prevention, besides dietary measures, is sufficient fluid intake [Citation2]. The consumption of 2 to 3 L of fluids per day increases urine production and subsequently significantly reduces stone recurrence [Citation3,Citation4]. Drinking water is often seen as the best choice for fluid intake, as it is considered to increase urine production without increasing the minerals related to crystallization. Different studies, however, have shown that the mineral content of water, whether tap or bottled, has a broad range and can be a source of high intake of minerals, which can help prevent or precipitate kidney stone formation [Citation1,Citation2,Citation5–8]. These minerals could have a significant influence on the recurrence of kidney stones. Ionic minerals, such as calcium, magnesium or sodium, are easily absorbed in the gastrointestinal tract and may consequently be an important source of high mineral intake [Citation9]. Mineral water rich in calcium, for example, could provide up to one-third of the recommended intake in adults [Citation10]. Similarly, magnesium in water is absorbed 30% faster than magnesium in food, thus making tap water an ideal source for this mineral [Citation11].
This study analyses the mineral content of tap water in Flanders and assesses if the region one lives in could prevent or precipitate stone formation due to the difference in mineral concentration.
Material and methods
Data acquisition
The public data of six water supply companies that distribute tap water in Flanders (Belgium) was retrieved in August 2020 to collect their water analysis reports from samples collected in 2019. From the collected water analysis reports, data regarding calcium, magnesium, potassium, sodium and sulphate content was extracted.
Statistical analysis
SPSS V.26 (IBM Corp, Armonk, NY, USA) was used to perform the statistical analysis. The collected data was checked for normality with the Shapiro-Wilks normality test. As all data was not normally distributed, it was treated as non-parametric data. Medians and ranges were calculated, evaluated and compared between the nine different geographical regions. A Kruskal-Wallis test was performed to verify the null hypothesis that there is no difference in concentration for the different minerals between the nine regions. Furthermore, we performed a pairwise comparison of the nine distribution regions for each mineral. A two-sided p-value ≤.05 was considered statistically significant. Additionally, significance values were adjusted by the Bonferroni correction for multiple tests.
Simple box plots were used to optimally represent the collected data. By using simple box plots, the distributional features of the data could be examined. Figures and tables were created with Microsoft® Excel for Mac V.2016 (Microsoft Corp, Redmond, WA, USA).
Results
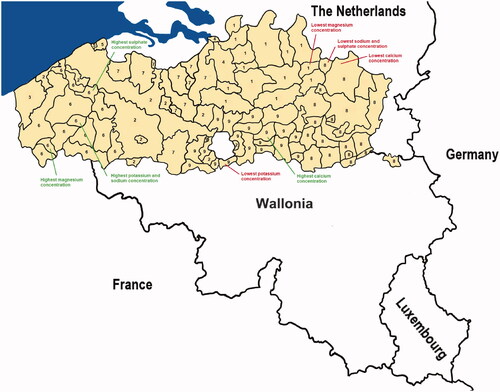
Flanders is divided into nine geographical regions in which six water companies (AGSO Knokke-Heist, De Watergroep, FARYS, IWVA, Pidpa, Water-link) supply tap water as shown in . The tap water is collected in 84 different production locations. Data from all 84 production locations was included in this study and is publicly available on internet or upon request from the different water companies.
Figure 1. Nine water distribution regions (numbered from 1-9) and their respective production sites in Flanders. The distribution sites with the lowest and highest concentrations of each mineral are highlighted.
Differences in ranges between distribution regions
The highest calcium concentration was found at a production site (De Watergroep Mid Oost: Landen) in region 9 with a value of 157.0 mg/L, which is almost 10 times the lowest calcium value found at a production site (De Watergroep Oost: Neerpelt) in region 8 (16.1 mg/L) ( and ). Region 6 had the production sites with the highest magnesium ((De Watergroep West: De Kooigem: 31.8 mg/L), potassium (De Watergroep West: De Blankaart: 30.5 mg/L), sodium (De Watergroep West: De Blankaart: 126.6 mg/L) and sulphate ((De Watergroep West: Beernem: 218.5 mg/L) concentrations. The production site (Pidpa: Regio 7) with the lowest concentration of magnesium (2.7 mg/L) was found in region 1, which was almost 12 times lower as the production site (De Watergroep West: De Kooigem) in Region 6. Region 9, then again, had the production site (De Watergroep Mid Oost: Hoeilaart) with the lowest concentration of potassium (1.5 mg/L), which is a factor 20 lower than the production site (De Watergroep West: De Blankaart) in Region 6. The lowest sodium and sulphate concentrations were found at production sites (De Watergroep Oost: Lommel) in region 8 (6.8 mg/L and 3.0 mg/L), respectively. The difference between the highest and lowest concentration of sulphate was a factor 70.
Figure 2. Simple boxplots for calcium, magnesium, potassium, sodium and sulphate.
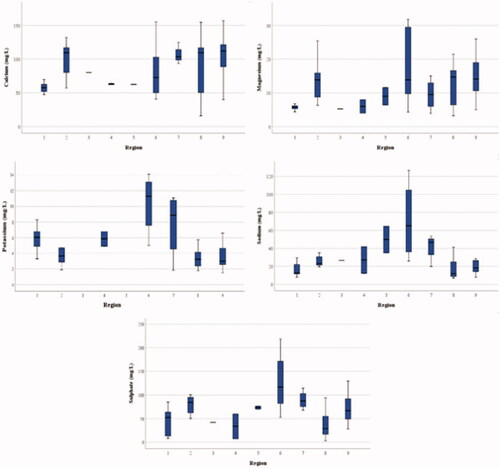
Table 1. Median (range) of concentrations for minerals found in tap water in the nine distribution regions in Flanders.
Differences across distribution regions
A Kruskal-Wallis test showed that the distribution of calcium (p = .012), magnesium (p = .001), potassium (p = .000), sodium (p = .000) and sulphate (p = .000) was different across the regions as shown in .
Table 2. Hypothesis test summary.
A significant difference for calcium was found between Regions 1 and 9 (p = .004), whereas the magnesium concentration found in Region 1 differed significantly from the concentration found in Region 6 (p = .017), Region 8 (p = 0.041) and Region 9 (p = .001). A significant difference was found for the concentration of potassium between Regions 1 and 8 (p = .014), as well as between Regions 6 and 8 (p = .000) and 6 and 9 (p = .003). The concentration of sodium only significantly differed between Regions 1 and 6 (p = .002). Finally, the sulphate concentration differed significantly between Regions 1 and 6 (p = 0.009) and Regions 6 and 8 (p = .001) ().
Table 3. Pairwise comparison of the nine distribution regions for calcium concentration.
Table 4. Pairwise comparison of the nine distribution regions for magnesium concentration.
Table 5. Pairwise comparison of the nine distribution regions for potassium concentration.
Table 6. Pairwise comparison of the nine distribution regions for sodium concentration.
Table 7. Pairwise comparison of the nine distribution regions for sulphate concentration.
Discussion
This descriptive study compares the mineral content of tap water between nine distribution regions in Flanders. The mineral composition (calcium, magnesium, potassium, sodium and sulphates) of drinking water purified by six water supply companies over 84 production locations and distributed over nine regions in the Flanders was analysed and compared and consumption safety for patients with kidney stone disease was evaluated.
Calcium, magnesium, potassium, sodium and sulphate all influence the risk of kidney stone formation. Calcium can lower the risk of kidney stone formation by binding with oxalate in the intestine. However, without calcium, oxalate is reabsorbed in the bloodstream and released in the urine, increasing the risk of kidney stone formation [Citation12]. Therefore, patients with calcium oxalate stones, the most common type of kidney stones, are advised to consume two to three products rich in calcium. Magnesium, then again, keeps calcium dissolved in the bloodstream, thus preventing calcium to be released in the urine and subsequently lowering the risk of kidney stone formation due to an excess of calcium in the urine (hypercalciuria). Additionally, magnesium may also diminish urinary oxalate excretion by reducing the intestinal reabsorption [Citation12–15]. Similarly, potassium intake has been associated with a lower risk of kidney stone formation. A low potassium intake can impair the reabsorption of calcium, leading to hypercalciuria and thus a higher risk of kidney stone formation [Citation13,Citation16].
As for sodium, their levels are carefully regulated in the human body, and as excess sodium is excreted with urine, calcium is evacuated proportionally. This might lead to hypercalciuria and the subsequent risk of kidney stone formation [Citation17]. Finally, an increased urinary sulphate intake could reduce the risk of calcium oxalate and calcium phosphate formation by binding with calcium in urine and consequently lowering the available calcium for complexation with phosphate or oxalate [Citation18]. On the other hand, the complex between sulphate and calcium can prevent reabsorption of calcium in the renal tubules and lead to hypercalciuria, which can increase the risk of stone formation [Citation19].
The advised daily intake of calcium for adults is 1000–1200mg, which corresponds with two to three calcium rich products. Men are advised to consume 400–420mg of magnesium a day, whereas women are advised to consume 310–320mg of magnesium a day. The advised daily intake of potassium is 4700mg for adults, whereas a maximum intake of 2300–3000mg of sodium is recommended per day. Finally, kidney stone patients are advised to consume 25–30mg of sulphate a day [Citation1,Citation9,Citation19–21]. Tap water could be a great source for these minerals in our daily diet.
Tap water in Flanders is bound to a legal framework for quality control. Not only to Flemish quality regulations but also European regulations. About 60 parameters are used to check the quality of tap water in Flanders [Citation22]. A report from the Flemish government in 2018 shows 99.6% compliance with these regulations [Citation23]. Due to these strict quality regulations tap water has to meet, it can be considered safe for patients with kidney stone disease. Interestingly, these strict Flemish and European regulations are not always applicable for bottled water [Citation23], thus possibly leading to a broader range in mineral content, as shown by Stoots et al. [Citation1,Citation5].
Although most European citizens have access to safe and cheap tap water, the consumption of bottled water keeps rising [Citation24]. Belgium has one of the highest consumption of bottled water in Europe. Only Italy (188 L) and Germany (175 L) had a higher consumption of bottled water per person per year than Belgium (130 L) in 2016. Since 2013, the yearly consumption of bottled water per person kept rising in Belgium (134 L) and the rest of Europe. In 2018, five countries preceded Belgium in the consumption of bottled water [Citation25].
Geerts et al. performed a survey among 2309 Flemish people and found that they assume that tap water is unhealthier, less safe and less tasty than bottled water [Citation24]. Other reasons for the increase in consumption of bottled water are convenience and fashion [Citation26]. The preference for bottled water is more pronounced in men, older and lower educated people [Citation24].
Nonetheless, the consumption of tap water, however, is preferable on grounds of resource efficiency and global environmental challenges [Citation24]. To stimulate the consumption of tap water in Flanders, AquaFlanders launched a campaign “#drinkkraanwater” in 2019. The arguments in favor of the consumption of tap water compared to bottled water are both of ecological and economical nature. On the website ‘www.kraanwater.be’, one can calculate the effect the consumption of tap water has on the environment, as well as on your finances. Taken, a person drinks the advised 2 to 3 L of tap water a day for one year, he or she would save between 130 to 195 kg CO2 and 428 to 642 Euros [Citation27]. Italy (Milan) and France (Paris), two countries with a high consumption of bottled water (188 and 125 L per person per year in 2016, respectively), installed public sparkling water fountains in 2009–2010 to encourage people to drink tap water.
Different studies have examined the mineral content of tap water in their respective countries. Azoulay et al., for example, investigated the mineral content (calcium, magnesium and sodium) of tap and bottled waters in North America. They found that tap water sources in North America can contain high levels of calcium, magnesium and sodium and thus provide clinically important portions of the recommended dietary intake of these minerals [Citation9]. In contrast to these findings, Azlan et al. found relatively low mineral concentrations in tap water in Malaysia. They concluded tap water in Malaysia to be safe for consumption, as the mineral content is below the standard limitations prescribed by the Malaysian Food Regulations of 1985 [Citation28]. In 2009, Rodriguez et al. created a guideline for Spanish citizens with kidney stone disease on what water to consume according to the region they live in [Citation6]. Finally, a study from our group concluded that tap water in the Netherlands is safe to consume for kidney stone disease patients. Nonetheless, the authors state that it is important to realize that the mineral composition of drinking water may vary, as it might require alterations of their diet [Citation29]. These different studies show that there can be an important difference in mineral content of tap water between different geographical regions. This is also true for our study, where we found a broad range in the levels of the different minerals in tap water. However, this wide spectrum will not lead to a higher risk for kidney stone formation if the required 2 to 3 L of water per day are consumed. However, these differences in mineral content might require some minor adaptions in the daily diet of kidney stone patients. Furthermore, it is important to realise that the wide variation in mineral content is not only true for the different geographical regions but also between the different production locations providing tap water in the same geographical region.
Conclusion
This study confirms that there is a broad range in the minerals found in tap water between the different production sites in the nine distribution regions in Flanders. However, due to the high standards tap water has to meet in Flanders, the minerals in each region are within a safe range and tap water is not considered as a source of calcium if the advised 2 to 3 L of water per day are consumed.
Author contributions
M.M.E.L. Henderickx: Protocol/project development, data collection or management, data analysis, manuscript writing/editing.
S.M.J. Stoots: Manuscript writing/editing.
J. Baard: Data analysis, manuscript writing/editing.
G.M. Kamphuis: Manuscript writing/editing.
Acknowledgements
The authors thank AGSO Knokke-Heist, De Watergroep, FARYS, IWVA, Pidpa and Water-link for providing the data concerning mineral content of their respective production sites. Furthermore, the authors would like to thank dr. Christiane M.E.A. Stilman for proofreading the manuscript.
Disclosure statement
No potential conflict of interest was reported by the author(s).
References
- Stoots SJM, Geraghty R, Kamphuis GM, et al. Variations in the mineral content of bottled “carbonated or sparkling” water across Europe: a comparison of 126 brands across 10 countries. Cent Eur J Urol. 2021;74:71–75.
- Sulaiman SK, Enakshee J, Traxer O, et al. Which type of water is recommended for patients with stone disease (hard or soft water, tap or bottled water): evidence from a systematic review over the last 3 decades. Curr. Urol. Rep. 2020; 21: 6.
- Bao Y, Tu X, Wei Q. Water for preventing urinary stones. Cochrane Database Syst Rev. 2020;2:CD004292.
- Borghi L, Meschi T, Amato F, et al. Urinary volume, water and recurrences in idiopathic calcium nephrolithiasis: a 5-year randomized prospective study. J Urol. 1996;155(3):839–843.
- Stoots SJM, Geraghty R, Kamphuis GM, et al. Variations in the mineral content of bottled “"Still" water across Europe: comparison of 182 brands across 10 countries”. J Endourol. 2021;35(2):206–214.
- Millán Rodríguez F, Gracia García S, Jiménez Corro R, et al. [Spanish bottled and tap water analysis and their relation with urinary lithiasis]. Actas Urol Esp. 2009;33(7):778–793.
- Hubert J. Drinking water : which type should be chosen? Prog Urol. 2010;20(11):806–809.
- Stoots SJM, Kamphuis GM, Geraghty R, et al. Global variations in the mineral content of bottled still and sparkling water and a description of the possible impact on nephrological and urological diseases. JCM. 2021;10(13):2807.
- Azoulay A, Garzon P, Eisenberg MJ. Comparison of the mineral content of tap water and bottled waters. J Gen Intern Med. 2001;16(3):168–175.
- Heaney RP, Dowell MS. Absorbability of the calcium in a high-calcium mineral water. Osteoporosis Int. 1994;4(6):323–324.
- Durlach J. Recommended dietary amounts of magnesium: Mg RDA. Magnes Res. 1989;2(3):195–203.
- Medical JH Kidney Stones: Overview.[cited 2021 Mar 29]. Available from: https://www.hopkinsmedicine.org/health/conditions-and-diseases/kidney-stones
- Taylor EN, Stampfer MJ, Curhan GC. Dietary factors and the risk of incident kidney stones in men: new insights after 14 years of follow-up. J Am Soc Nephrol. 2004;15(12):3225–3232.
- Lindberg J, Harvey J, Pak CY. Effect of magnesium citrate and magnesium oxide on the crystallization of calcium salts in urine: changes produced by food-magnesium interaction. J Urol. 1990;143(2):248–251.
- Liebman M, Costa G. Effects of calcium and magnesium on urinary oxalate excretion after oxalate loads. J Urol. 2000;163(5):1565–1569.
- Ferraro PM, Mandel EI, Curhan GC, et al. Dietary protein and potassium, diet-dependent net acid load, and risk of incident kidney stones. CJASN. 2016;11(10):1834–1844.
- Leslie SW, Sajjad H. StatPearls [Internet]: Hypercalciuria. Treasure Island (FL): StatPearls Publishing; 2021. Available from: https://pubmed.ncbi.nlm.nih.gov/28846247
- Rodgers A, Gauvin D, Edeh S, et al. Sulfate but not thiosulfate reduces calculated and measured urinary ionized calcium and supersaturation: implications for the treatment of calcium renal stones. PLoS One. 2014;9(7):e103602
- Medscape.com [Internet]. WebMD LLC; [updated 2021 Jun 02; cited 2021 Aug 23]. Available from: https://www.medscape.com/answers/2182757-185345/what-are-the-dietary-recommendations-for-the-treatment-of-hypercalciuria
- Marcus JB. 2013. Diet and disease: Healthy choices for disease prevention and diet management. In: Culinary nutrition. Amsterdam, the Netherlands: Academic Press - Elsevier Inc., p. 371–430.
- Freitas M. 2017. The benefits of yogurt, cultures, and fermentation. In: Floch MH, Ringel Y, Walker WA, editors. The microbiota in gastrointestinal pathophysiology. Boston, MA, United States: Elsevier, p. 209–223.
- vmm.be [Internet]. Vlaamse milieumaatschappij; [cited 2021 Mar 03]. Available from: https://www.vmm.be/wetgeving/besluit-van-de-vlaamse-regering-houdende-reglementering-inzake-de-kwaliteit-en-levering-van-water-bestemd-voor-menselijke-consumptie
- vmm.be [Internet]. Vlaamse milieumaatschappij; [cited 2021 Mar 03]. Available from: https://www.vmm.be/publicaties/kwaliteit-van-het-drinkwater-2013-2018
- Geerts R, Vandermoere F, Van Winckel T, et al. Bottle or tap? Toward an integrated approach to water type consumption. Water Res. 2020;173:115578.
- fieb-viwf.be [Internet]. Koninklijk Verbond van de industrie van Waters en Frisdranken; [cited 2021 Jan 03]. Available from: https://www.fieb-viwf.be/nl/cijfers-trends-2
- Abd El-Salam MM, Al-Ghitany EM, Kassem MM. Quality of bottled water brands in Egypt part II: biological water examination. J Egypt Public Health Assoc. 2008;83(5-6):468–486.
- kraanwater.be [Internet]. Aqua Flanders; [cited 2021 Jan 03]. Available from: https://www.kraanwater.be/waterkompas
- Azlan A, Khoo HE, Idris MA, et al. Evaluation of minerals content of drinking water in Malaysia. Sci World J. 2012;2012:403574.
- Stoots SJM, Henderickx MMEL, Kamphuis GM. Safety of Dutch tap water for kidney stone patients: comparison of the 179 national production sites. Eur Urol. 2021;79:S379–S380.