Abstract
Introduction Dual energy X-ray absorptiometry (DEXA) has been used to measure bone mineral density (BMD) around total hip prostheses. With the recent increase in the use of metal-on-metal hip resurfacing, such as the Birmingham hip resurfacing (BHR), we aimed to produce a reliable method of measuring bone density around a metal-on-metal hip resurfacing.
Methods We performed DEXA scans on 5 patients (7 BHRs), who had undergone resurfacing with the BHR within the past 2 years. A zonal reporting technique was devised and evaluated.
Results The intraclass correlation (i.e. the correlation between any two assessments of one region of interest) was 0.997, with an overall coefficient of variation of 5%.
Interpretation We have designed and demonstrated a safe, noninvasive and highly reproducible method for interpreting and reporting the results of DEXA scanning of BHR implants in vivo. We will now use this method to prospectively study our BHR population to assess the changes in bone density following BHR within the femoral neck. This method may add to the current techniques available for detection of impending failure.
Hip resurfacing for the treatment of osteoarthrosis is increasing in popularity, particularly for younger patients. Previous attempts at hip resurfacing, starting first with Charnley in the early 1950s, failed due to bone resorption and loosening on account of ischemic necrosis and wear debris (Charnley Citation1961). There were further attempts at resurfacing in the 1970s using metal and polyethylene cups, but again they failed (Amstutz Citation1991). However, a new generation of metal-on-metal hip resurfacing was developed in the early 1990s. The Birmingham hip resurfacing, designed by McMinn et al. (Citation1996) and in commercial use since 1997, is a metal-on-metal resurfacing, with hydroxyapatite coating to the acetabulum and cement fixation of the femoral component onto a convex reamed native femoral head. Medium-term results have been encouraging, but concern has been raised over hip resurfacing with regard to vascular supply to the femoral neck and head.
The survival of joint arthroplasty is associated with the quality of the surrounding bone mineral environment and therefore DEXA scanning may provide an extra modality to detect impending failure. The use of DEXA around THRs is well documented (McCarthy et al. Citation1991, Cohen and Ruston Citation1995). We aimed to produce a reliable technique for the analysis of DEXA scans around a BHR in vivo, prior to a prospective study of our BHR population.
To our knowledge, there is currently only one report of DEXA measurement around BHRs, in which Yishida et al. (Citation2004) report preservation of BMD around 13 BHRs when compared to 13 THRs. These authors used a reporting system analogous to Gruen regions in a THR stem, but with only 6 ROIs, 3 superior to the stem and 3 inferior to the stem. They did not report on reproducibility around the BHRs, but only interobserver variation within the equivalent Gruen region 7 as in THRs.
Patients and methods
Following appropriate ethical committee project approval, we chose 5 patients who had undergone metal-on-metal hip resurfacing using the BHR (Midland Medical Technologies Birmingham, UK) within the last 2 years. All BHRs were performed in the same manner by the same surgeon, within one orthopedic department. The patients were chosen on the basis of their proximity to the study centre, to minimize their own transport costs.
2 of the patients had undergone bilateral BHR; thus, there were 7 prosthetic hips in our study group, 4 left and 3 right. There were 2 females and 3 males, with a mean age of 52 (42–66) years and a mean weight of 84 (69–108) kg.
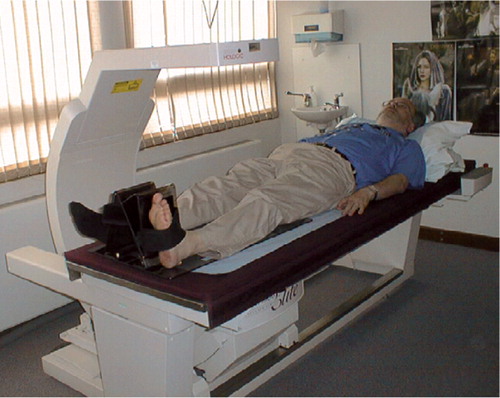
The Hologic QDR 45000A scanner was used in conjunction with the Hologic prosthetic hip foot positioner, with the simple modification of an extra Velcro strap to hold the heel more firmly to the positioning device ().
Figure 1 DEXA set up demonstrating the Hologic foot positioner for prosthetic hip patients.
Each of the 7 hips was scanned twice on the same hospital attendance, but between each scan the patient was taken off the scanning table, asked to walk around the department and then put back on the scanner.
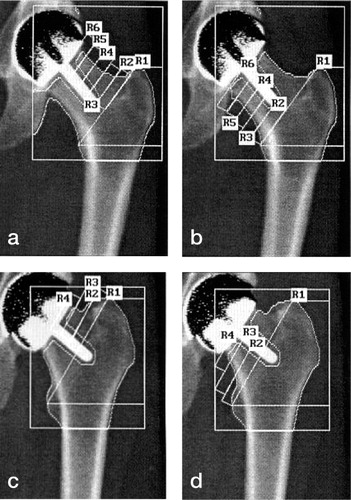
Each of the 14 scans was analyzed twice (at least 1 week apart) by 3 of the authors (JM, NC, DR) independently, using the Hologic prosthetic hip scan analysis software (operating software 9.80D; v 8.26a 3). A variable number of same-sized regions of interest (ROI) within the femoral neck were identified. These ROIs were derived from an intertrochanteric line and the axis of the BHR stem in the femoral neck as shown below (). We made every attempt to keep the ROIs the same size visibly by using the on-screen cursor, as no measurements are available with this software yet. The superior aspect of the greater trochanter and the medial aspect of the lesser trochanter were identified by the individual assessors, and these two points were joined to produce the first ROI, region 1, distal to this intertrochanteric line extending down to include the lesser trochanter (). Further ROIs were defined within the femoral necks, superior and inferior to the stem of the implants, as the individual femoral anatomy allowed. These ROIs were as close as possible to the same size, as determined by 5 cursor moves with the software described above. This produced a mean area covered by one single ROI within the femoral neck of 1.7 (1.3–2.4) cm2. Regions below 0.5 cm2 were excluded.
Figure 2 Examples of DEXA scans with BHRs in situ. Figures 2a and b are in the same patient, with 10 femoral neck ROI, and Figures 2c and d are from another patient, who had 6 ROIs.
Prior to settling on this method of variable-number same-size ROIs, we attempted referencing ROIs to the BHR implants (analogous to Gruen regions around total hip prostheses) and also trialled a standard number of variably-sized ROIs which were anatomically defined. However, due to the wide variation in anatomy of the femoral neck we decided that a variable number of same-size ROIs was the most reliable.
Two independent medical statisticians from our local university Department of Statistics performed statistical analysis of the raw data using SPSS analysis software. They used intraclass correlation and univariate analysis of variance. For both methods, the reproducibility of BMD in each individual ROI was analyzed to carefully assess reliability. This generated a large amount of data from the 7 BHRs, which would then highlight any problems regarding reproducibility.
The intraclass correlation coefficient is defined as the correlation between any two measurements in the same scan (Armitage and Berry Citation1994). It is closely related to the kappa measure of agreement used when the ratings are recorded on a categorical scale. With regard to the univariate analysis, a general linear model was used with results inferred from an ANOVA table. 95% confidence intervals and p-values are given.
Results
The variation within the same ROI in a given BHR was 0.0035, whereas the variation between all ROIs was 1.16. The overall intraclass correlation was 1.00 (0.997) (i.e. the correlation between any two assessments of one ROI with an overall coef- ficient of variation of 5%). The variation between the two scans for each BHR (interscan variation) and between the three assessors (interobserver variation) was not significant (p = 0.9 and p = 0.4, respectively) (, and ).
Figure 3 Interscan variation demonstrated as linear relationship between the values of BMD on the first scan (x-axis) against BMD on the second scan (y-axis). This plot includes the values from all three asssessors.
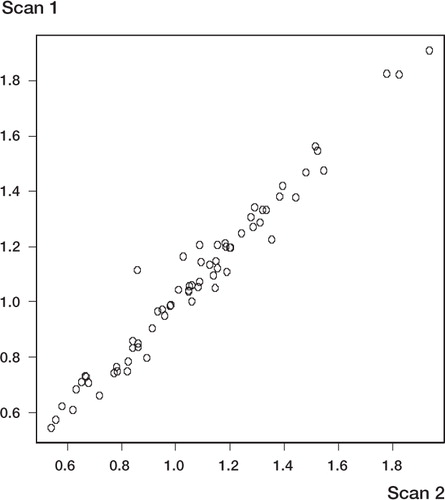
Figure 4 Multi-plot graph to show interovbserver variation. The BMD value for each individual ROI read by one of the three assessors (on both scans and on both occassions) is plotted against the value obtained by another of the three assessors. The use of multi-plot presentation allows for comparison between the three different assessors.
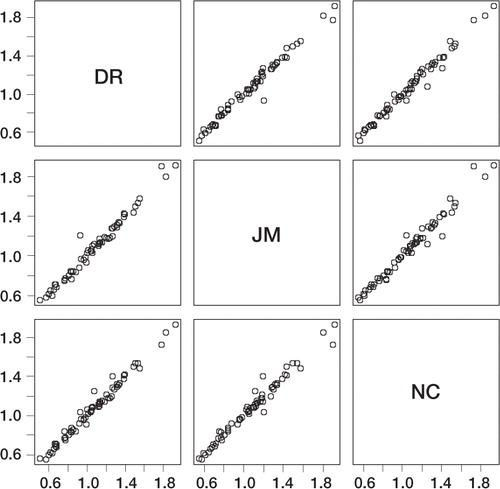
Figure 5 Intraobserver variability. The three assessors are plotted on three individual graphs. Assessment of all scans (by the same assessor) on the first occasion (x-axis) is plotted directly against assessment of all the scans on the second occasion (y-axis).
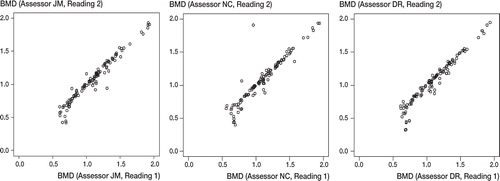
The mean BMD of the individual ROIs, between the two assessments of the same scans by the same assessor (i.e. intraobserver variation, ) was lower on the second assessment by 0.021 gcm-2 (SD = 0.003, p < 0.001).
With univariate analysis, the p-value (with 95% confidence limits) for variation between scan number and BMD was 0.98 and that between assessor and BMD was 0.54. These large p-values prove that at the 95% confidence limits, there is no significant statistical association between the scan number and BMD; nor is there a relationship between assessor and BMD.
There was a marked difference between the size and geometry of the femoral necks between the 7 BHRs studied. Consequently, there was a variable number of ROIs between different patients, as the ROIs were the same size. However, for the same patient there was always the same number of ROIs.
Discussion
DEXA is an attractive proposition for implant monitoring because of its very low radiation dose to the patient. One scan is in the order of 1 day's background radiation in the UK. This is particularly important in this population, which has started with arthroplasty at an early age.
With regard to experimental set-up, the DEXA scanner used was the standard departmental scanner with the use of a specific foot positioner, to produce neutral hip rotation, as in THR scanning. Extra Velcro permitted better subjective control of hip rotation on the DEXA scanner table, as testi- fied by two of the authors (JM and NC) who carried out tests using the foot positioner and an extra Velcro strap to further secure the subject's foot ().
The results show excellent reproducibility between different scans of the same patient, different assessors and with the same assessor on different occasions i.e. low interscan, interobserver and intraobserver variation. DEXA scanning around THR has been proven to be reproducible (McCarthy et al. Citation1991, Cohen and Ruston Citation1995) and as our cohort of BHR patients undergoes follow-up DEXA scans, we will be able to compare how bone density changes distal to a BHR, as opposed a THR.
We were unable to explain why there was a decreased numerical value of BMD on the second assessment of all scans, but the difference was inconsequential and statistical advice stated that this very small difference in mean density (intraobserver) only reached significance due to the highly sensitive measurements and excellent reproducibility of interscan and interobserver measurements.
We attempted to produce a modified Gruen region analogy for the Birmingham hip resurfacing implant, but the variation between patient anatomy within the femoral neck, even in this small series of 5 patients, was prohibitive. Thus, we used a variable number of same-sized regions (ROIs), of suitable size and reproducibility for following up BHRs over time, particularly looking for changes in the regions adjacent to the implant. As an ROI adjacent to the BHR becomes too small (we used < 0.5 cm2 as a cut-off figure), then it should be discounted, as the next ROI down the neck will give a more realistic result. Secondly, by referencing to the patient's trochanters rather than the implant, any gross future migration of the femoral component may be studied. Whilst DEXA will not detect early migration, its use in conjunction with migration studies using Roentgen stereometric analysis (RSA) data, may well contribute to an understanding of the mechanism of migration. Thirdly, this method also has the advantage that a preoperative assessment can be made prior to the resurfacing, if an anatomic placement of the implant stem is assumed. It is recognized, however, that the surgical procedure of resurfacing itself affects bone mineral density within the femoral neck.
Thus, to permit longitudinal follow-up of individual patients over time, we decided on same-sized regions-but does this allow comparison between different patients? We believe that our method does allow comparison of periprosthetic BMD. Indeed, we consider that our method is most suitable for this too, but attention must be paid to the naming of regions. For example, in a short femoral neck there may only be 6 ROIs, whereas in a long femoral neck there may be 10 (). The key is to compare the adjacent regions to the prostheses, which will be of similar size because of this particular method.
DEXA scanning cannot, of course, reveal what is happening to the bone density under the metal resurfacing itself, but it will reproducibly identify changes in bone mineral density around such a resurfacing in the femoral neck. We believe that this method is of value and warrants further prospective medium and long-term follow-up for the prediction of possible future implant failure.
We wish to acknowledge the work of Ross Darnell of the Statistical Consultancy Service and Eric Bhin Zhu of the School of Mathematics and Statistics, both at Newcastle University.
We are also very grateful to the staff of the Department of Densitometry of the Freeman Hospital, Newcastle, for their help during this trial.
- Amstutz H C. Surface replacement arthroplasty. Hip arthroplasty, H C Amstutz. Churchill Livingston, Edinburgh 1991; 295–332
- Armitage P, Berry G. Statistical methods in medical research. Blackwell Scientific Publications, Oxford 1994
- Charnley J C. Arthroplasty of the hip. A new operation. Lancet 1961; 280: 1129–32
- Cohen B, Ruston N. Accuracy of DEXA measurement of bone mineral density after total hip arthroplasty. J Bone Joint Surg (Br) 1995; 77: 479–83
- McCarthy C K, Steinberg G G, Agren M, et al. Quantifying bone loss from the proximal femur after total hip arthroplasty. J Bone Joint Surg (Br) 1991; 73: 774–8
- McMinn D, Treacy R, Lin K, Pynsent P. Metal on metal surface replacement of the hip. Experience of the McMinn prosthesis. Clin Orthop 1996, 329: 89–98
- Yishida Y, Sugano N, Nishii T, Miki H, Yamaguchi K, Yoshikawa H. Preservation of the bone mineral density of the femur after surface replacement of the hip. J Bone Joint Surg (Br) 2004; 86: 185–9