
Abstract
Object: Acoustic stimulation induced LTP in the human auditory cortex was successfully recorded for the first time by electroencephalography (EEG) using a stimulus of 1 kHz pure-tone in 2005. However, it was barely reproduced, given considerable challenges to reliably elicit and accurately record the enhanced potentials in vivo. The purpose of this paper was to explore whether acoustic stimuli other than 1 kHz pure-tone could generate LTP or not.
Measures: To answer this question, we proposed a tetanic-stimulation paradigm of pure-tones, narrow-band noises (NBNs) and white noise (WN) to elicit LTP in human subjects.
Results: The results showed that pure-tones with different frequency could elicit LTP in human auditory cortex, and proved for the first time that NBNs and WN could also achieve the same goal. Interestingly, it was also shown that the noises with certain bandwidth induced the greatest LTP and the WN induced LTP had the least variation over time and across subjects in comparison with pure-tones and NBNs.
Conclusions: In light of the results, we suggested to use the paradigm for broader studies of human in vivo cortical plasticity.
Chinese abstract
目的:在2005年, 首次使用1 kHz纯音刺激, 通过脑电图(EEG)成功记录了人类听觉皮质内声刺激诱导的LTP。然而, 这样的结果几乎很少重复出现, 因为可靠地引出和准确地记录体内增强的潜力是有一定的难度的。本文的目的是探讨1 kHz纯音以外的声刺激是否能产生LTP。
方法:为了回答这个问题, 我们提出了纯音、窄带噪声(NBN)和白噪声(WN)的强直刺激范例, 对人类受试者诱导LTP。
结果:结果表明, 不同频率的纯音可以在人类听觉皮层内诱导LTP, 并首次证明NBN和WN也能达到同样的目的。有趣的是, 结果还表明, 某种带宽的噪声能导致最大的LTP, 并且, 与纯音和NBN相比, WN诱导的LTP在不同时间和不同受试者之间变化最小。
结论:根据结果, 我们建议使用这种方法进行更广泛的人体内皮层可塑性研究
Introduction
Synaptic plasticity is considered as a critical component of the neural mechanism of learning and memory [Citation1]. Long-term potentiation (LTP) is a prominent candidate mechanism underlying the synaptic plasticity at both cellular and molecular levels. It is well believed that the LTP-induced plasticity in animals may play a key role in experience-dependent cortical plasticity [Citation2].
LTP was first reported as a persistently strengthened synaptic transmission between two neurons at the perforant path-dentate granule cells in the hippocampus of anaesthetized rabbits [Citation3]. It was believed to enhance excitatory postsynaptic potentials (EPSP) by a single pulse following a high-frequency train of stimuli to the pre-synaptic fibers [Citation4]. Subsequently, a classic in vitro model was established for investigating LTP based on the acute hippocampal slice, which is widely used due to its simplified neural circuits and relatively easy recording of extracellular synaptic responses. Using the classic model, a variety of mechanistically motivated experiments that were not feasible in vivo were performed [Citation5]. It is now understood that the underlying mechanisms of LTP relate to the NMDA (N-methyl-d-aspartate) and AMPA (α-amino-3-hydroxy-5-methyl-4-isoxazolepropionic acid) receptors [Citation5]. The basic properties of LTP, including cooperativity, synaptic specificity and associativity, are found to fit well with Hebb’s postulate and can be explained by the biophysical properties of the NMDA receptor that is needed to trigger LTP [Citation6]. Meanwhile, LTP of the intracortical circuits in a variety of neocortices, e.g. the sensory cortices, had be explored in animals. The complexity of the neural circuits including the polysynaptic inputs and horizontal connectivity [Citation7] as well as the importance of the temporal order of spikes (which is now defined as spike timing) were elaborated [Citation8].
Given the evidence of LTP in the sensory neocortices in animals, it was inferred that LTP may be observed in human sensory-evoked potentials as well. However, due to ethical reasons, invasive methods were not permitted in human subjects. Although there are a few candidate methods capable of inducing LTP, such as direct electrical stimulation [Citation9], sensory stimulation, and transcranial magnetic stimulation [Citation10]. The sensory induced LTP is a non-invasive stimulating method that can be accurately elicited in the human sensory cortex and other functional cortices [Citation11,Citation12]. The non-invasive recording methods such as EEG (electroencephalography) and MEG (magnetoencephalography) were employed to record the sensory-evoked responses [Citation13]. Along this direction, there has been a significant amount of evidence on LTPs evoked by the sensory stimulation of touch [Citation14], vision [Citation15] and hearing [Citation16]. The human LTP is found to be frequency-dependent, input specific, long-lasting (≥1 hour), and limited by NMDA receptor blockers, which are similar to LTP found in animal experiments where LTP in the sensory neocortices has been fully established [Citation11]. Although the mechanism of the sensory-evoked LTPs is not entirely clear, it seems that they share the same cellular and molecular mechanisms as LTP observed in the hippocampus. The presentation of a sensory stimulus at a rate to which a particular sensory cortex is most sensitive may potentially elicit rhythmic thalamocortical and cortico-cortical high frequency bursts that are similar to electrical tetanic bursts, thus inducing LTP [Citation12].
In 2005, LTP of the human auditory cortex was first successfully elicited and recorded by EEG after being stimulated by a 1 kHz pure-tone at 70 dB SPL [Citation16]. However, the human EEG study of the auditory evoked LTP was barely reproduced since then due to considerable challenges. First, there are a number of influencing factors of scalp recorded EEG, and it is not easy for a human subject to maintain a stable awake state for a long time experiment. Furthermore, it is not clear whether there is a relative generic method that can induce LTP, nor is it understood whether auditory stimuli other than pure-tone can do so. To explore the answers to these questions, we proposed an auditory tetanic-stimulation paradigm for reliably eliciting and recording LTP. By means of the paradigm, we investigated LTP induced by a variety of auditory stimuli including pure-tones, narrow-band noises (NBNs) and white noise (WN).
Materials and methods
Tetanic-stimulation paradigm
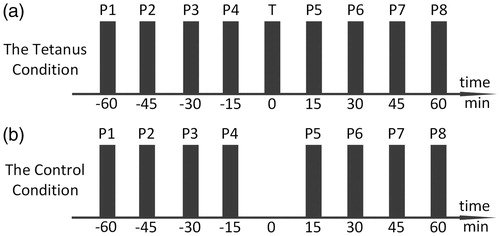
We proposed a tetanic-stimulation paradigm for investigating the effect of tetanic-stimulation on auditory cortex. There were two conditions designed in the paradigm, namely the Tetanus condition and the Control condition (see ). In the Tetanus condition, a tetanus block (T-block) that consisted of a train of auditory stimuli called ‘tetanic stimulation’ was delivered to human ears. While eight probe blocks (P-blocks) each consisted of a different train of auditory stimuli which were delivered to induce the auditory evoked potential (AEP) that could be recorded in EEG. Four probes were placed before the tetanus block and four after as shown in . The probe blocks were named P1–P8 in a temporal order, while the tetanus block was named T. Comparatively, in the Control condition, the tetanic stimulus was knocked out, whereas the eight probes remained the same as in the Tetanus condition (). In our experiment, the P1–P4, T, and P5–P8 were placed in an equal time interval which was chosen to be 15 minutes, although other intervals were also applicable to the paradigm. In the following sections, the two terms ‘pre-tetanus N1’ and ‘post-tetanus N1’ were used in both the Tetanus condition and the Control condition, although it was understood that in the Control condition the T-block was absent.
Figure 1. The diagram of the paradigm. P and T stood for the probe and tetanus block, respectively. (a) The Tetanus condition and (b) the control condition.
Stimuli and apparatus
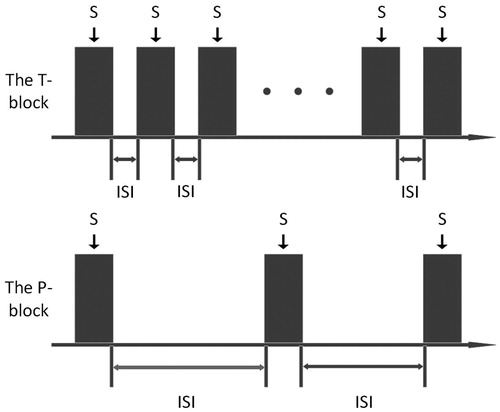
In this study, each T-block or P-block consisted of a train of stimuli (see ). Each single stimulus which was marked as ‘S’, was a pure-tone (PT, 1 kHz or 6 kHz), or a NBN (1/8 octave bandwidth with center frequency of 1 kHz or 6 kHz), or WN, with onset/offset ramps of 5 ms shaped by a Hanning window and a total duration of 50 ms, presented at an intensity level of 50 dB SL. For a T-block, the stimulus repetition was 3200 times with regular intervals (the inter-stimulus intervals (ISIs) were fixed to be 25 ms), whereas for a P-block, the stimulus repetition was 100 times with irregular intervals (the ISIs was randomized between [1800, 2600] ms). The bandwidth of the two NBNs was designed to be 1/8 octave so that the bandwidth was smaller than the Equivalent Rectangular Bandwidth (ERB) to assure the frequency components of the NBNs passed the same auditory filter, where ERB =24.7 × (4.37×F + 1), the ERB was in Hz, and the F was the center frequency in kHz.
Figure 2. The diagram of the T-block and P-block.
The acoustic signals were played by E-Prime® 2.0 software (Psychology Software Tools, Inc., Sharpsburg, PA) on a computer through a Multi-I/O ExpressCard adapter, power-amplified by two separate Yamaha® RX power amplifiers (Yamaha Corporation, Hamamatsu, Japan), then channeled binaurally to a human subject through a pair of Sennheiser® HDA200 circumaural headphones (Sennheiser Electronic GmbH & Co. KG, Wedemark, Germany). The EEG signals were acquired by a 64-channel Ag/AgCl electrode cap with a common vertex (Cz) reference and a forehead ground. Prior to each recording, the resistance of each electrode was measured and assured to be lower than 5 kΩ. The acquired EEG signals were then amplified by a NeuroScan® SynAmps2 amplifier (Neurosoft, Inc., Sterling, VA), filtered by a bandpass filter (BPF) with a passband of [0.1, 100] Hz, sampled at 1000 Hz, and eventually stored by the NeuroScan® 4.5 EEG system (Neurosoft, Inc., Sterling, VA).
Subjects and data acquisition
Ten right-handed normal-hearing subjects were recruited from the staff and students of the General Hospital of the PLA. Five males, with a mean age of 27.6 years (standard deviation [SD] = 3.9 years) and five females, with a mean age of 25.8 years (SD =3.5 years) participated in the study. No significant difference was observed between males and females mean age (p value=.46). Subjects reported no history of otological or neurological disorders. Each subject underwent an audiometric evaluation consisting of otoscopy, tympanometry, and pure-tone thresholds. The audiograms showed all participants had normal hearing that was defined as pure-tone thresholds no more than 20 dB HL between 0.25 and 8 kHz. All test procedures were approved by the General Hospital of the PLA Human Subjects Ethics Committee.
Each subject completed 10 trials under the proposed paradigm (five for the Tetanus conditions and five for the Control conditions) in a random order. There was at least one day rest between two trials for the same subject. The EEG signals were acquired only during the P-blocks in a shielding double-walled acoustic chamber. All the subjects were asked to close their eyes, stay still, and keep awake when hearing a sound in each block. Reading or mild motion was allowed between blocks to avoid falling asleep during trials.
Analysis
After completion of data collection and artifact removing, the EEG files were divided into 600-ms segments (including 100 ms baseline prior to stimuli) based on time stamps. The waveform of the event related potential (ERP) was formed after baseline correction, low-pass filtered at 30 Hz prior to averaging. Utilizing a software based re-reference technology (reference electrode standardization technique, REST, Software url: http://www.neuro.uestc.edu.cn/rest/), we reconstructed a set of equivalent sources, then calculated the scalp EEG with a reference at infinity from these equivalent sources. This method was documented to reduce the adverse effect of the reference electrode on the EEG recording so that it had contributed well to unify the recording results of different laboratories. After re-referencing, the ERPs of an individual subject were combined to produce grand-averaged ERPs.
Based on the grand-averaged ERPs, the butterfly plots and the mean global field power (MGFP) are plotted in . Meanwhile, the N1 peak and its time window are listed in .
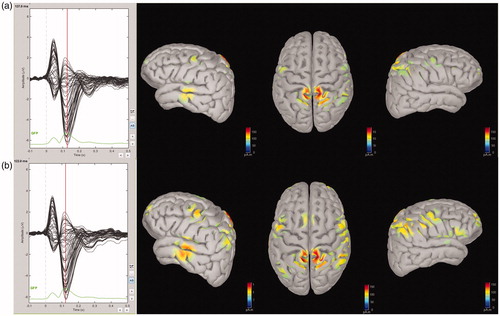
Figure 3. Butterfly plots and mean global field power (MGFP).
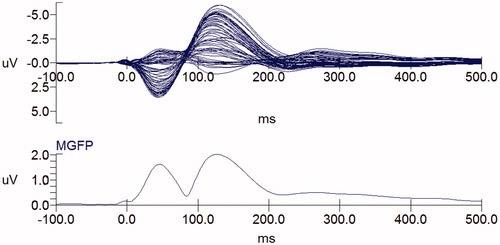
Table 1. The peak time and time window of N1 wave.
The mean value of N1 amplitude of the 10 electrodes with the highest N1 over the time window (T7, TP7, P7, CB1, O1, T8, TP8, P8, CB2, and O2) was utilized for statistical analysis. We compared the Tetanus condition with the Control condition for all the five stimulation in the highest amplitude electrode (electrode CB1 in our study), then conducted a four-way repeated measures ANOVA analysis on the amplitude of the N1 component under the four factors of stimulus, condition, gender, and time. After that, we performed a t-test on each stimulus and each condition, and a t-test on each post-tetanus blocks over the pre-tetanus baseline for time series analysis. Finally, the SD of the post-tetanus N1 amplitude for each stimulus and condition was analyzed and a 3D behavior of the post-tetanus N1 amplitude over the baseline was plotted.
From the 2D map of scalp current density (SCD) () and source localization of N1 (), it was seen that the SCD and source of N1 were mainly distributed in bilateral temporal and occipital regions, which was used to determine the locations of the 10 electrodes providing the highest N1 amplitude. In regard to the latency and the source localization of N1, it was observed that the location of cortex responding to acoustic stimulation was auditory cortex.
Figure 4. The 2D map of the scalp current density of N1.
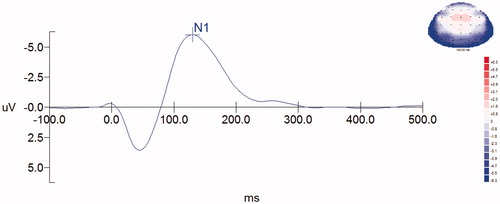
Figure 5. Source localization of N1. Grand averaged data showed the N1 source distributions of pre- (a) and post-tetanus (b) conditions.
Results
Analysis of stimulus and condition
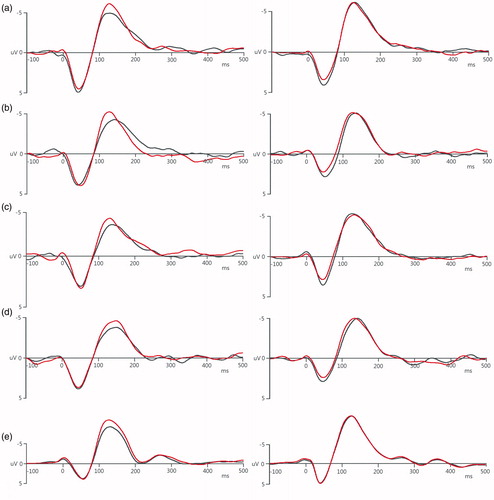
Compared with the Control condition of the 1 kHz PT, it was found that in the Tetanus condition the post-tetanus amplitude of the N1 component was higher than the pre-tetanus, however, the Control condition had no such increase. A similar trend was also observed in the other four stimuli ().
Figure 6. Auditory tetanic stimulation induced potentiation on the N1. In the Tetanus condition (left column), the post-tetanus amplitude of the N1 was higher than that of pre-tetanus, whereas there was no such increase in the Control condition (right column). (a) 1 kHz PT, (b) 1 kHz NBN, (c) 6 kHz PT, (d) 6 kHz NBN, and (e) WN. The black lines are pre-tetanus waves, and the red lines are post-tetanus waves.
A four-way repeated measures ANOVA analysis was conducted on the amplitude of the N1 component under the four factors of stimulus (1 kHz/6 kHz PTs, 1 kHz/6 kHz NBNs or WN), condition (the Tetanus or Control condition), gender (male or female), and time (pre-tetanus or post-tetanus). It was observed that stimulus (p value < .01, F(4, 360) = 894.405), condition (p value < .01, F(1, 360) = 93.203), gender (p value < .01, F(1, 360) = 32.799), and time (p value < .01, F(1, 360) = 38.001), all had a significant main effect on the N1 amplitude. Furthermore, there was significant interaction between stimulus and condition (p value < .01, F(4, 360) = 24.267), stimulus and gender (p value < .01, F(1, 360) = 26.408), condition and gender (p value < .01, F(1, 360) = 101.830), as well as condition and time (p value < .01, F(1, 360) = 51.632). However, no significant interaction existed between stimulus and time, or gender and time. For three-factor interaction, there was a significant interaction between stimulus-condition-gender (p value < .01, F(4, 360) = 12.841), but not between stimulus-condition-time, stimulus-gender-time, or condition-gender-time. Neither was there a significant interaction between the four factors of stimulus-condition-gender-time. Furthermore, also lists Bonferroni’s corrected p values for the ANOVA results.
Table 2. Bonferroni’s corrected p values for the ANOVA results.
To explore this analysis further, the pre- and post-tetanus amplitudes were averaged respectively for paired t-tests, and the mean value and the SD of the 10 subjects listed in . The results showed that, there was a significant increase of post-tetanus N1 amplitude from pre-tetanus (p value < .01, and t-value < 0) in the Tetanus condition for all the five stimulation, while there was a significant decrease of post-tetanus N1 in the Control condition for 1 kHz PT, 6 kHz PT, and WN (p value < .01, and t-value >0), or no significant difference for 6 kHz NBN in the Control condition (p value>.01, and t-value >0). The only exception was 1 kHz NBN in the Control condition, which had a slight but significant increased post-tetanus N1 (p value < .01, and t-value < 0), but the increase was much lower than that of the corresponding Tetanus condition (see ).
Table 3. Analysis of stimulus and condition.
Table 4. The percentage of the N1 amplitude of post-tetanus blocks over the baseline.
Analysis of time series
In order to investigate how long the LTP lasted after the tetanic stimulation, the mean N1 amplitude of all the pre-tetanus blocks P1, P2, P3 and P4 was averaged to obtain a baseline value, and the percentage of each post-tetanus block (P5, P6, P7 or P8) over the baseline is calculated in . Meanwhile, the SD of the percentage of the post-tetanus N1 amplitude over baseline for the five stimuli in the tetanus and Control condition is plotted in .
Figure 7. The standard deviation of the percentage of the post-tetanus N1 amplitude over baseline was illustrated for the five stimuli in the Tetanus condition and the Control condition, with the Tetanus condition plotted as a dark bar and the Control condition as a light bar.
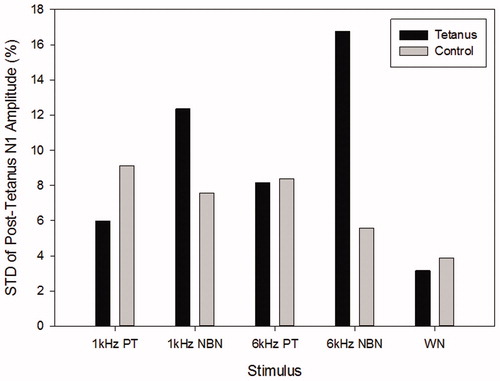
The results showed: (a) for all the five stimuli, the post-tetanus N1 amplitudes were all significantly higher than the baseline in the Tetanus condition (p value < .01), (b) however, in the Control condition, either no significant difference was observed (p value>.01) or the post-tetanus N1 amplitudes were significantly lower than the baseline (p value < .01), and (c) in comparison to the other four stimuli, the SD of the WN in both the Tetanus condition and the Control condition was smaller than the other stimuli.
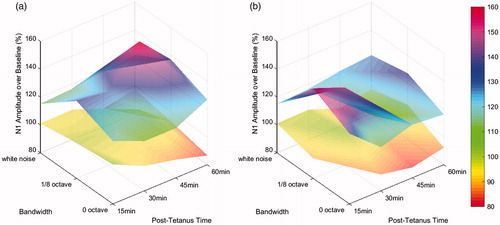
Furthermore, the 3D behavior of the percentage of the post-tetanus N1 over the baseline is plotted in . The stimuli were grouped into two groups – 1 kHz group {1 kHz PT, 1 kHz NBN, WN} and 6 kHz group {6 kHz PT, 6 kHz NBN, WN} because each group had the same center frequency but their bandwidth grew from 0 octave, 1/8 octave to full band. The upper surface represented the Tetanus condition whereas the bottom surface for the Control condition. From , it was observed that (a) the upper surface was clearly above a 100% horizontal plane that represented the baseline and did not drop below the baseline as the time elapsed from 15 minutes to 60 minutes, (b) the bottom surface tended to drop below the 100% horizontal plane within one hour time series, and (c) the upper surface demonstrated a ridge at 1/8 octave which signified the highest N1 increase.
Figure 8. (a) The percentage of the post-tetanus N1 amplitude over time and bandwidth for a center frequency of 1 kHz and (b) the percentage of the post-tetanus N1 amplitude over time and bandwidth for a center frequency of 6 kHz, where x-axis was the post-tetanus time in minutes, y-axis was the bandwidth of the stimulus ranging from 0 octave, 1/8 octave to full band, and z-axis was the percentage of the post-tetanus N1 amplitude over the baseline.
Discussion
A tetanic-stimulation paradigm was proposed for reliably eliciting and stable recording LTP. The design of the paradigm was composed of two conditions: the Tetanus condition and the Control condition, and LTP existed only when the post-tetanus N1 increase held stably for an hour in the Tetanus condition but not in the Control condition, differing from a short-term potentiation or the cumulative effect of the probe. Potentiation was defined as the percentage of the post-tetanus N1 amplitude over the baseline, considering the difference across subjects and trials. The probes and the tetanus in a trial were composed of the same stimulus (but different ISI and repetition), to ensure they were transmitted in the same peripheral auditory pathway and activated the same cortex neurons. The N1 component of the AEP was observed, which was thought to reflect activity within auditory cortex.
The results of this study indicated that utilizing this paradigm, a variety of sounds (pure-tones, NBNs, and WN) could induce stable potentiation after tetanus stimulation (high frequency stimulation), and the hold time lasted over one hour. Meanwhile, the repeated probes (low frequency stimulation) could incur a slight suppression effect as shown in the t-tests and the bottom surface of . These results conformed to the characteristics of LTP [Citation11]. It was believed that they resulted from functional plasticity of auditory cortex, and tetanus stimulation was the cause of the functional plasticity. Studies showed that intensive stimulation and training could lead to functional reorganization of auditory cortex in animals, and functional reorganization generally showed a certain degree of activation of neuronal function [Citation17].
The groups of stimuli with the same center frequency but different bandwidths are compared in . It was found that the optimal stimulus that induced the highest N1 increase was neither a pure-tone nor a WN, but a band-limited noise with a specific bandwidth. Research [Citation18] had shown that the discharge rate of single auditory fiber increased with the increase of the noise band-width from 0 octave. However, as the noise bandwidth continued to widen, the discharge rate of single fiber decreased gradually after reaching the highest level, which showed that the noise band with wider bandwidth had a restraining effect [Citation18]. This seemed to be because the excited neuron had the capacity to reduce the activity of its neighbors as lateral inhibition theory described [Citation19].
Furthermore, our data showed the WN was the best to elicit LTP with across-subject stability and time-domain stability. Consequently, the data suggested the most stable post-tetanus N1 increase was found to be activated by the WN because the N1 increase had the minimum fluctuation across subjects and over time. Previous studies showed that the N1 amplitude was larger for the WN than for single frequency tonal stimuli, because the WN spanned a full range of frequencies, which activated auditory fibers over a broad region of the basilar membrane, and the compound response of all these fibers was larger than the response of a pure-tone. Since more auditory fibers could be activated by the WN, statistically there was higher stability for auditory cortex to maintain a stable potentiation over time and remained less variant among different human subjects.
Overall, the tetanic-stimulation paradigm presented as well as its experimental results on the pure-tones, the NBNs and the WN were capable of reliably eliciting and recording human auditory evoked LTP in a broader range, which could contribute to characterize human in vivo cortical plasticity more clearly as well as assess neural plasticity diseases. This is because LTP not only is considered as the underlying mechanism of long-term synaptic plasticity and memory but also plays an important role in the diagnosis of neural plasticity diseases [Citation20]. The pathologic alterations of LTP contribute to a number of neurological diseases, including depression, Parkinson's disease, epilepsy, and neuropathic pain. The impaired LTP seemed to also relate to Alzheimer's disease and drug addiction. Moreover, it was shown in a few studies that LTP was related to tinnitus [Citation2].
Disclosure statement
No potential conflict of interest was reported by the authors.
Additional information
Funding
References
- Takeuchi T, Duszkiewicz AJ, Morris RG. The synaptic plasticity and memory hypothesis: encoding, storage and persistence. Philos Trans R Soc Lond B Biol Sci. 2014;369:20130288.
- Cakir A, Ecevit MC, Bal R, et al. Assessment of synaptic plasticity via long-term potentiation in young mice on the day after acoustic trauma: implications for tinnitus. Int Adv Otol. 2015;11:196–201.
- Anderson P, Lomo T. Mode of activation of hippocampal pyramidal cells by excitatory synapses on dendrites. Exp Brain Res. 1966;2:247–260.
- Bliss TV, Gardner-Medwin AR. Long-lasting potentiation of synaptic transmission in the dentate area of the unanaestetized rabbit following stimulation of the perforant path. J Physiol (Lond). 1973;232:357–374.
- Papatheodoropoulos C, Kouvaros S. High-frequency stimulation-induced synaptic potentiation in dorsal and ventral CA1 hippocampal synapses: the involvement of NMDA receptors, mGluR5, and (L-type) voltage-gated calcium channels. Learn Mem. 2016;23:460–464.
- Bouvier G, Higgins D, Spolidoro M, et al. Burst-dependent bidirectional plasticity in the cerebellum is driven by presynaptic NMDA receptors. Cell Rep. 2016;15:104–116.
- Kudoh M, Shibuki K. Long-term potentiation of supragranular pyramidal outputs in the rat auditory cortex. Exp Brain Res. 1996;110:21–27.
- Dan Y, Poo M-M. Spike timing-dependent plasticity of neural circuits. Neuron. 2004;44:23–30.
- Larson J, Munkacsy E. Theta-burst LTP. Brain Res. 2015;1621:38–50.
- Cash RF, Jegatheeswaran G, Ni Z, et al. Modulation of the direction and magnitude of Hebbian plasticity in human motor cortex by stimulus intensity and concurrent inhibition. Brain Stimul. 2017;10:83–90.
- Clapp WC, Hamm JP, Kirk IJ, et al. Translating long-term potentiation from animals to humans: a novel method for noninvasive assessment of cortical plasticity. Biol Psychiatry. 2012;71:496–502.
- Kirk IJ, McNair NA, Hamm JP, et al. Long-term potentiation (LTP) of human sensory-evoked potentials. Wiley Interdiscip Rev Cogn Sci. 2010;1:766–773.
- Noh NA. Exploring cortical plasticity and oscillatory brain dynamics via transcranial magnetic stimulation and resting-state electroencephalogram. Malays J Med Sci. 2016;23:5–16.
- Litvak V, Zeller D, Oostenveld R, et al. LTP-like changes induced by paired associative stimulation of the primary somatosensory cortex in humans: source analysis and associated changes in behaviour. Eur J Neurosci. 2007;25:2862–2874.
- Ross RM, McNair NA, Fairhall SL, et al. Induction of orientation-specific LTP-like changes in human visual evoked potentials by rapid sensory stimulation. Brain Res Bull. 2008;76:97–101.
- Clapp WC, Kirk IJ, Hamm JP, et al. Induction of LTP in the human auditory cortex by sensory stimulation. Eur J Neurosci. 2005;22:1135–1140.
- Fritz J, Shamma S, Elhilali M, et al. Rapid task-related plasticity of spectrotemporal receptive fields in primary auditory cortex. Nat Neurosci. 2003;6:1216–1223.
- Gilbert AG, Pickles JO. Responses of auditory nerve fibres in the guinea pig to noise bands of different widths. Hear Res. 1980;2:327–333.
- Kral A, Majernik V. On lateral inhibition in the auditory system. Gen Physiol Biophys. 1996;15:109–127.
- Kotak VC, Breithaupt AD, Sanes DH. Developmental hearing loss eliminates long-term potentiation in the auditory cortex. Proc Natl Acad Sci USA. 2007;104:3550–3555.