
Abstract
Background: Vestibular-evoked myogenic potential (VEMP) is commonly conducted with air-conducted (AC) stimuli whose intensity may exceed the prudential levels of acoustic exposure in susceptible subjects.
Objectives: To determine the diagnostic accuracy of AC VEMP for superior canal dehiscence syndrome (SCDS) at lowered acoustic stimulation levels.
Material and methods: VEMP was tested in 10 SCDS patients and in 10 age/sex matched control subjects. VEMP were recorded on cervical muscles (cVEMP) and extraocular muscles (oVEMP) in response to short AC tone bursts at 500, 1000 and 2000 Hz delivered at 80 dB nHL (103 dB peSPL). Parameters of interest were the response amplitude and the frequency tuning.
Results: VEMP evoked by AC stimuli at safe acoustic stimulation levels did effectively separate SCDS patients from healthy controls. The separation was optimal at all the frequencies tested, however 500 Hz resulted the best VEMP tuning frequency, especially at oVEMP.
Conclusions: Lowering the AC stimulation to the levels compatible with testing of patients susceptible to acoustic exposure didn’t affect the VEMP diagnostic properties for SCDS.
Significance: SCDS may be screened by VEMP even among subjects susceptible for acoustic exposure.
Chinese abstract
背景:前庭诱发肌源性势差(VEMP)通常通过空气传导(AC)刺激来进行, 其强度可能超过易感受试者声暴露的低弱程度。
目的:探讨低度声刺激下AC VEMP对上管裂开综合征(SCDS)的诊断准确度。
材料与方法:对10例SCDS患者和10例年龄性别相对的对照组进行VEMP检测。记录颈部肌肉(cVEMP)和眼外肌肉(oVEMP)在回应80dB nHL(103dB peSPL)处传送的500、1000和2000Hz的短AC音脉冲的VEMP。我们所关注的参数是回应振幅和频率调谐。
结果:AC刺激在安全声刺激度诱发的VEMP能有效地将SCDS患者与健康人区分开。在所有的频率测试中, 区分都是最佳的, 但是500Hz导致最佳VEMP调谐频率, 对于oVEMP尤为如此。
结论:将AC刺激降低到与声暴露易感性患者测试相符的水平并不影响VEMP对SCDS的诊断性能。
意义:即使在易感声暴露的受试者中, 都可通过VEMP进行SCDS检测。
Introduction
Vestibular-evoked myogenic potentials (VEMP) is a modern clinical test for the study of the vestibular pathways. VEMP consists of the recording of myogenic potential evoked by vestibular stimulation. On a clinical level the most diffuse stimulation modality is by loud air-conducted sounds (AC) or skull vibration (bone conducted, BC) [Citation1]. When recorded at the level of the sternocleidomastoideus (SMC) with surface electromyography (EMG) it is defined cervical VEMP (cVEMP); when recorded at the level of the inferior oblique muscle with infraorbital EMG montage, it is defined ocular VEMP (oVEMP). cVEMP appears as a short latency positive-negative myogenic potential and represents most likely the activation of the ipsilateral saccular afferences convoyed in the inferior vestibular nerve, especially when evoked by ipsilateral AC stimuli at middle frequencies (500–1000 Hz). oVEMP appears as a short latency negative-positive myogenic potential recorded with EMG at the extraocular muscles [Citation2]. The electrogenesis of the oVEMP is still controversial, however when it is evoked by low frequency stimuli and read contralaterally it would likely represent the utricular activity convoyed in the superior vestibular nerve [Citation3].
High intensity suprathreshold stimuli (equal or over 125 dB peSPL) are required to obtain an adequate response rate in AC VEMP. VEMP is enhanced by short (6–10 ms) narrow band AC stimuli at specific frequency tuning (middle frequency for cVEMP −400 Hz to 800 Hz−). AC VEMP reproducibility is reduced in older ages, particularly for oVEMP, and affected by elevated acoustic impedance [Citation1].
The diffuse use of high stimulation intensity levels coupled to narrow band stimuli has raised concerns about the cochlear vulnerability during AC VEMP. Spare works have focused on transitory [Citation4,Citation5] or persistent cochlear dysfunctions [Citation6] following VEMP stimulations. Precautional levels of acoustic stimulation are nowadays demanded in the context of clinical VEMP application. Experts recommended an upper limit for AC VEMP stimulation at 140 dB pSPL [Citation7]. VEMP is obtained by the averaging of 64–192 sweeps, collected consecutively at a rate of 5–6 stimuli/s in 1–3 sessions with a short pause within. So not only the stimulus intensity but also the stimulus time, in terms of cumulative stimulus duration, is a determinant of the acoustic exposure during VEMP testing. Citing the same recommendations, a maximal sound dose in terms of stimulus intensity × duration can be derived by guidelines for safe occupational acoustic exposure, with a recommended exposure level (REL) stated at 85 dB LAeq,8h. Applying the ‘3 dB doubling rule’ to the level of AC stimuli in dB SPLAeq, it is possible to derive the REL for stimuli of different duration (for ex a stimulus of 1 s should not overcome the intensity of 132 dB SPLAeq,1sec) and the specific sound dose for VEMP protocols with different stimulus durations. These REL refer to a safe acoustic exposure to prolonged environmental stimuli for normal hearing subjects in an occupational context. These references may be not proper for subjects and patients specifically vulnerable to noise exposure and commonly encountered in the clinical practice. No specific damage-risk criterion (DRC), such the one stated in the occupational context and at the basis of the specific REL, is available for the acoustic exposure in the clinical enviromental. Patients complaining tinnitus, hyperacusis, those undergoing chemotherapy or the ones affected by genetic vulnerability for noise induced hearing loss are at high risk to develop or exacerbate auditory disorders in case of high intensity acoustic exposure [Citation8]. The clinical audiological testing is targeted to these patient groups with lowered stimulation levels and exposure time. At our department, 80 dB nHL is a clinical reference for safe AC stimulation in audiological testing, especially for repetitive stimulation protocols such in auditive evoked potentials testing.
VEMP has received a growing attention for the possibility to clinically measure the unilateral otolith function and also for the capability to map the vestibular pathways, but it has assumed a central role in the diagnosis of a specific affection, the superior canal dehiscence syndrome (SCDS) [Citation9]. SCDS is caused by the presence of an additional opening of the capsula otica at the level of the superior semicircular canal that alters the biomechanical properties of the inner ear. The vestibular organ becomes hypersensitive to sound, vibration and transotic pressure gradients; the cochlea becomes hypersensitive to body sounds/vibrations and less compliant for external sound stimulation. These processes have a variable clinical expression. Among less specific audiovestibular complaints (chronic dizziness, ear lock, hearing loss) the key features in SCDS are the vertigo and torsional-vertical nystagmus evoked by sound or pressure changes or a pattern of autophony and ‘conductive hyperacusis’ (normal air tone threshold and enhanced bone tone one) at the pure tone audiometry. A superior canal dehiscence is confirmed by the high definition computer tomography of the temporal bone with dedicated planar reconstruction; however, this technique tends to overestimate the prevalence and the dimension of the bone dehiscence. In spite of a clinical inconsistency and a low accuracy in radiological studies, the presence of a SCDS can be uncovered by VEMP which reveals a specific pattern of vestibular hypersensitivity to sound and vibrations constantly expressed by SCDS patients regardless the clinical presentation. VEMP in SCDS shows a significantly larger amplitude at suprathreshold stimulation levels, a broadened frequency tuning and a significantly lower response threshold when compared with healthy controls, with the unaffected side in unilateral forms, and with VEMP responses in other vestibular affections [Citation10–12].
The acoustic vulnerability of SCDS has not yet been certainly stated. Noteworthy SCDS manifests with a variable combination of hyperacusis, tinnitus and hearing impairment which are indeed expressions of acoustic susceptibility.
Given these premises, the use of high intensity AC stimulation, commonly utilized in clinical VEMP testing and especially in SCDS diagnostics, should be carefully weighted in the presence of auditory complaints.
The aim of this study is to determine the diagnostic properties of AC VEMP for SCDS at stimulus intensity levels compatible with safe acoustic stimulation in clinical testing. For the purpose, we have conducted AC VEMP with short 500 Hz tone burst (TB) at intensity levels reduced at 80 dB nHL (103 dB peSPL). Moreover, to further reduce the acoustic exposure, VEMP was limited to the collection of only 128 stimulus repetitions. VEMP evoked by this protocol was recorded at both oVEMP and cVEMP.
The first study hypothesis was that 80 dB nHL 500 Hz TB AC VEMP could correctly identify and separate SCDS patients from a group of healthy controls. Further, this protocol should match at least the same diagnostic accuracy of other well established VEMP diagnostic protocols currently in use for SCDS diagnostics.
A secondary hypothesis was that at these reduced stimulation levels, it would be possible to replicate the VEMP tuning broadening observed in SCDS at suprathreshold and threshold levels, an highly specific diagnostic feature of VEMP in SCDS [Citation12].
Material and methods
To test the two hypothesis, a case/control study was conducted on 10 patients diagnosed with SCDS and 10 healthy control subjects. The study was approved by the local ethical board. The subjects were included after obtained informed consensus. The SCDS diagnose was formulated on diagnostic criteria in use at our department (): only subjects with unilateral and certain SCDS forms were recruited in this study. Healthy controls were defined as adult subjects not affected by audiovestibular diseases. The two groups didn’t differ on a significant level in age and gender distribution (Age, SCDS: 53.7 ± 12.5 years; controls: 46.2 ± 14.9 years. T test, p = .240. M/F in SCDS: 3/7 and in controls 3/7).
Table 1. Diagnostic criteria for SCDS.
For the control group a ‘reference’ side was randomly assigned and compared to the affected side in SCDS group.
Stimulation protocol
The AC stimulus was achieved from the Medelec Synergy signal averager (VIASYS Healthcare, Madison, WI, USA) corresponding to 80 dB nHL—(103 dB peSPL)—(ISO 389–6:2007). The stimuli consisted of 500, 1000 and 2000 Hz TBs with configuration 2–2–2 ms and were presented separately to each ear via TDH-49P headphones (Telephonics Co., Farmingdale, NY, USA) at a repetition rate of 5 stimuli/s.
Recording protocol
cVEMP
The recording was conducted with self-adhesive skin surface electrodes, Red Dot 2239 (3M Health Care, St. Paul, MN, USA). The active electrode was placed on the belly of the ipsilateral SMC muscle during head elevation in supine position. The reference electrode on the clavicle and the ground one are on the manubrium sterni. The skin was prepared by gentle abrasion to keep the impedance under 5 KΩ. Two sequences lasted 12.8 s each of 64 stimulus repetitions were recorded with a short break in between for a total of 128 stimuli for each frequency tested. The recording was conducted ipsilaterally.
The EMG signal was recorded under a 100 ms window, 20 ms before and 80 ms after stimulus and amplified, band-pass filtered (20–2000 Hz), and averaged. A cVEMP response was defined as a EMG positive-negative deflection with latencies within 13-18 ms for the positive peak and within 21–25 ms for the negative peak, according to our normative data. When the deflection was poorly recognizable, the amplitude (absolute value) of P1-N1 interval was calculated on the corresponding average peak latencies according to our normative data, e.g. 14.7 ms and 21.9 ms for N1, respectively, P1.
Following expertise guidelines [Citation13], the absolute P1-N1 amplitude was afterwards corrected by the averaged rectified level of EMG under 10 ms of pre-stimulus recording, in order to correct the response variance due to the EMG differences during recording.
oVEMP
The oVEMP consisted of a EMG recording with a pair self-adhesive skin surface electrodes, Neuroline 720 (Ambu A/S, Ballerup, Denmark), mounted under both the eyes. The active ones were placed just under the eyelid at the middle point, the reference one 2 cm below on a vertical alignment. The ground reference was placed on the manubrium sterni. Under condition of upward gaze, 2 EMG recording sessions of 64 sweeps at ∼5 Hz repetition rate for a total of 128 sweeps were collected and processed with amplification, band-pass filtration (10–500 Hz) and averaging. An oVEMP was defined as a negative-positive (N1–P1) EMG deflection with the N1 peak within 10.7–16.0 ms and the P1 one within the 14.7–22.3 ms after stimuli. oVEMP response was read contralaterally with respect to the stimulated ear [Citation14]. When a N1-P1 deflection was not clearly identifiable a corresponding N1-P1 deflection amplitude (absolute value) was calculated at latencies 13 ms and 17.4 ms, e.g. at AC oVEMP normative latency averages.
Data analysis
The measures of interest were the P1–N1 amplitude in µVolts for oVEMP and the N1–P1 corrected amplitude for cVEMP.
The data distribution was statistically modelled with a linear mixed model for AC oVEMP recordings, respectively, AC cVEMP recordings. The two models showed the better fitting on these determinants: group belonging (categorical, control/SCDS), subject age (parametric, years), frequency of stimuli (categorical, 500, 1000 and 2000 Hz) and a covariable that took in account the frequency tested for group belonging (categorical, case/controls *frequency). The model could provide the difference in parameters distribution and its statistical significance, calculated between the groups and, within the groups, between the tested frequencies. Moreover, the two models could return the effect of age on parameter distribution and its statistical significance. A statistical difference was considered significant when p < .05.
A receiver operating curve analysis (ROC) yielded the comparison of the diagnostic accuracy for SCDS of the different cVEMP and oVEMP tested frequencies, in terms of area under the curve (AUC). Amplitude cut offs returning the best levels of sensitivity and specificity, were calculated for each frequency tested.
Results
Summary statistics are provided in and and graphically represented by box plots in and . In SCDS group all the patients showed a well reproducible response, e.g. a response rate of 100%. In the control group the responses were tangent to 0 or hard to be distinguished from the EMG ‘noise’. However, VEMP responses could be visually identified in the control group in 2/10 oVEMP and cVEMP evoked by 500 Hz TB and at only 1/10 at oVEMP evoked by 1000 Hz TB. Taken together, the response rate in control group was 8%.
Figure 1. Case/control distribution of cVEMP-corrected amplitude for the three tested frequencies. Box plots indicating the median and interquartile range. o: outliers.
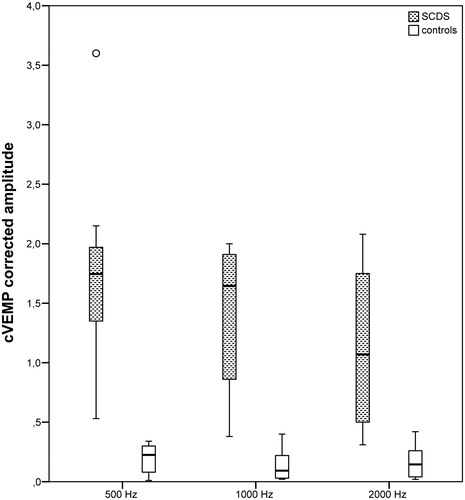
Figure 2. Case/control distribution of oVEMP amplitude (µVolts) for the three tested frequencies. Box plots indicating the median and interquartile range. o: outliers.
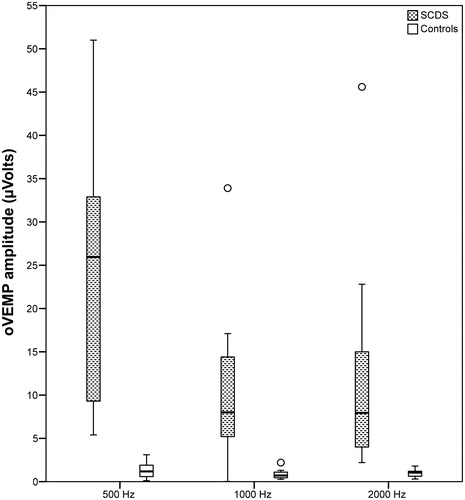
Table 2. Summary statistics cVEMP.
Table 3. Summary statistics oVEMP.
According to the linear mixed models, the amplitude and corrected amplitude distributed differently in SCDS and control groups (p < .001). There were no significant differences in parameter distribution between the tested frequencies within the groups. In other words, VEMP provided an optimal group separation at each frequency tested. The separation was complete at 500 Hz TB for both cVEMP and oVEMP and at 2000 Hz TB for oVEMP; a minimal groups overlap was instead present at the other tested frequencies ( and Citation2). Further, the largest group mean difference was reached with 500 Hz stimulation, with the lowest (oVEMP) or just the lowest relative standard error (cVEMP) ( and ).
The oVEMP amplitude resulted not statistically correlated to age, both at a between or within groups levels. On the contrary, cVEMP showed a significant association between corrected amplitude and age, summarized by an amplitude coefficient of –0.0038/year (p = .01).
The ROC analysis confirmed a ceiling effect for VEMP protocols by 500 Hz stimuli at both recording sites (AUC = 1). For oVEMP by 2000 Hz, a complete separation was also observed. The best amplitude cut points for oVEMP were as follows:
oVEMP 500 Hz: 4.25 µVolts (sensitivity 100%, specificity 100%)
oVEMP 1000 Hz: 3.35 µVolts (sensitivity 90%, specificity 100%)
oVEMP 2000 Hz: 2.0 µVolts (sensitivity 100%, specificity 100%)
In order to include an age correction in the cVEMP analysis, the ROC was conducted on the combined variable: corrected amplitude x age. A complete separation could be achieved for 500 Hz cVEMP and for 1000 Hz cVEMP (AUC = 1) and a near complete separation for cVEMP 2000 Hz (AUC = 0.97). The best cut points for cVEMP at each frequency tested were as follows:
cVEMP 500 Hz × age: 21.8 (sensitivity 100%, specificity 100%)
cVEMP 1000 Hz × age: 19.7 (sensitivity 100%, specificity 100%)
cVEMP 2000 Hz × age: 15.1 (sensitivity 100%, specificity 90%)
Discussion
This study demonstrated that VEMP evoked by AC stimuli at middle frequencies (500–2000 Hz) at a lowered intensity of 80 dB nHL retained an optimal diagnostic accuracy for SCDS. Both the cVEMP and the oVEMP procedures showed a 100% response rate for all the three tested frequencies in SCDS patients, with clearly identifiable responses. The responses in control subjects were, on the contrary, tangent to 0 and hard to distinguish from EMG noise with a response rate as low as 8%.
According to the stimulus specifications, an intensity of 80 dB nHL (103 dB peSPL) would result just under threshold for oVEMP, commonly stated at 95–100 dB nHL, whereas the same intensity would be at threshold levels for AC cVEMP, accredited at 75–90 dB nHL [Citation11,Citation12,Citation15,Citation16]. This aspect explained the low response rate in control group, especially for oVEMP. The response rate was computed on the visual identification of VEMP response and this detection method could have added an interpretation bias, especially in control group results, where the low VEMP amplitude responses may have not been completely distinguished from EMG noise, and so erroneously scored as 0 value. For this reason, the EMG deflection amplitude was computed not only for the well identifiable VEMP responses, but even at the corresponding EMG normative peak latencies for those cases with unidentifiable deflections. Even applying this inclusion method, the responses in control subjects resulted tangent to 0 and systematically detached from responses in SCDS group (). This optimal group separation can be interpreted as a result of three concomitant factors: the low EMG noise even with few sweeps collection (only 128 repetitions), the true low amplitude of control responses (tangent to 0 for the most) and the enhanced reproducibility of VEMP responses in SCDS group at lowered stimulus intensity levels.
Therefore, the first study hypothesis can be accepted, meaning that lowering the stimulus intensity to the reference levels for safe acoustic stimulation in clinical testing didn’t affect, but rather improved, the diagnostic accuracy of VEMP for SCDS. A few studies had previously provided the diagnostic accuracy of different AC VEMP protocols provided for SCDS: a near threshold AC cVEMP protocol, based on the stimulation with 90 dB nHL (121 dB peSPL) click, had reached a sensitivity of 92% and specificity of 97% [Citation17]) and an oVEMP protocol based on AC TB 500 Hz at suprathreshold levels (125 dB peSPL) could return a complete separation between SCDS and healthy controls (100% sensitivity; 100% specificity) [Citation10]. The same result was achieved by click evoked oVEMP at the same suprathreshold intensities [Citation11]. A lower accuracy was demonstrated for cVEMP evoked by click stimulus at threshold (85 dB nHL–120 dB peSPL-)with sensitivity of 86% and specificity 90%. This study showed that a complete separation, as the one obtained at suprathreshold levels at oVEMP by both TB and click, could be reached even with stimuli at 80 dB nHL dB (103 dB peSPL) 500 Hz, and more interestingly the same stimulation could give AC cVEMP a complete separation capability, not previously observed in two different stimulation protocols based on click at 90 and 85 dB nHL.
Regarding the tuning broadening found in other works [Citation12], this could be replicated also in this study. However, it didn’t yield a tuning shift, since AC 500 Hz TB showed the larger group separation in comparison with 1000 and 2000 Hz, particularly evident at oVEMP. In fact, the mean group difference at 2000 Hz was halved in comparison with 500 Hz and the relative standard error was higher, indicating a less separation between measures in the two groups ( and ).
cVEMP had to be corrected for recording bias. The amplitude dependency on muscle activation levels is commonly corrected by scaling the amplitude on the EMG levels before stimulus. An amplitude age dependency has been previously described [Citation18] but a standard correction is not available. We have tried to correct the age bias by the conversion of the amplitude parameters in the derived variable corrected amplitude * age. By these new parameters, a complete separation of SCDS from control subjects at AC cVEMP evoked by 500 Hz and 1000 could be achieved, with the larger group difference for 500 Hz AC cVEMP.
The reduction of acoustic stimulation in VEMP for the SCDS diagnosis is not only demanded but also possible and somewhat advantageous. It is moreover supported by different lines of evidence. On a preclinical level, it was largely shown that high intensity impulsive stimulation causes temporary noise induced hearing loss, hair cell loss and dendrite swelling in animal studies [Citation19]. On a clinical level, a temporary DPOAE depression, indicating cochlear distress, in normal hearing subjects was demonstrated after routine AC VEMP stimulation (TB 500 Hz >130 dB peSPL) [Citation5]. Moreover, even taking in account that a SCDS can be screening by AC cVEMP at near threshold, e.g. click at 90 dB HL [Citation20], the further moving to TB 500 Hz at 103 dB peSPL resulted in an acoustic exposure reduction of 18 dB peSPL (EN ISO 389–6:2007).
As a major conclusion, lowering the stimulus to 103 dB peSPL and especially at 500 Hz TB stimulation, adds many advantages in SCDS VEMP testing: (a) the diagnostic accuracy remains optimal (100% sensitivity and 100% specificity) for oVEMP and increases to optimal levels for cVEMP; (b) a SCDS screening test is available at safe levels for acoustic exposure in clinical testing. (c) a SCDS diagnostic work up based on VEMP can be completed also in acoustic vulnerable patients minimizing the risk for cochlear distress; (d) 500 Hz TB at 80 dB nHL is a stimulus protocol largely supported by the most of potential evoked devices in audiological testing. This protocol, in other words, could favour the dissemination of SCDS testing by VEMP in non-experimental facilities; (e) the presence of a clear response dichotomization by amplitude cut offs may ease the test conduction and the result interpretation in the clinical context. In contrast, the more diffuse diagnostic method for the SCDS is based on the search of the enhanced VEMP threshold in the affected ears, which, in comparison, presents specific drawbacks: time consuming, repetitive acoustic stimulation, difficult threshold identification in noisy recordings.
Conclusion
A test protocol based on middle frequency short TB AC VEMP at 80 dB nHL (103 peSPL) would represent a valid alternative to screen the vestibular sound hypersensitivity in patients suspected of SCDS. The protocol is highly feasible, in terms of easiness in test conduction, of accessibility regarding technical requirements and finally in terms of the compatibility with safe acoustic restrictions for sound vulnerable patients. It showed noteworthy optimal diagnostic properties for SCDS, particularly for oVEMP evoked by 500 Hz TBs. However, to demonstrate the validity of this VEMP diagnostic protocol for SCDS, those results have to be replicated in larger cohorts of patients complaining audiovestibular disorders.
Disclosure statement
No potential conflict of interest was reported by the authors.
References
- Rosengren SM, Welgampola MS, Colebatch JG. Vestibular evoked myogenic potentials: past, present and future. Clin Neurophysiol. 2010;121:636–651.
- Rosengren SM, McAngus Todd NP, Colebatch JG. Vestibular-evoked extraocular potentials produced by stimulation with bone-conducted sound. Clin Neurophysiol. 2005;116:1938–1948.
- Todd NP, Rosengren SM, Govender S, et al. Low-frequency tuning in the human vestibular-ocular projection is determined by both peripheral and central mechanisms. Neurosci Lett. 2009;458:43–47.
- Krause E, Mayerhofer A, Gürkov R, et al. Effects of acoustic stimuli used for vestibular evoked myogenic potential studies on the cochlear function. Otol Neurotol. 2013;34:1186–1192.
- Strömberg AK, Olofsson Å, Westin M, et al. Changes in cochlear function related to acoustic stimulation of cervical vestibular evoked myogenic potential stimulation. Hear Res. 2016;340:43–49.
- Mattingly JK, Portnuff CD, Hondorp BM, et al. Sudden bilateral hearing loss after cervical and ocular vestibular evoked myogenic potentials. Otol Neurotol. 2015;36:961–964.
- Colebatch JG, Rosengren SM. Safe levels of acoustic stimulation: comment on “effects of acoustic stimuli used for vestibular evoked myogenic potential studies on the cochlear function”. Otol Neurotol. 2014;35:932–933.
- Portnuff CDF, Kleindienst S, Bogle JM. Safe use of acoustic vestibular-evoked myogenic potential stimuli: protocol and patient-specific considerations. J Am Acad Audiol. 2017;28:708–717.
- Ward BK, Carey JP, Minor LB. Superior canal dehiscence syndrome: lessons from the first 20 years. Front Neurol. 2017;8:177.
- Janky KL, Nguyen KD, Welgampola M, et al. Air-conducted oVEMPs provide the best separation between intact and superior canal dehiscent labyrinths. Otol Neurotol. 2013;34:127–134.
- Zuniga MG, Janky KL, Nguyen KD, et al. Ocular versus cervical VEMPs in the diagnosis of superior semicircular canal dehiscence syndrome. Otol Neurotol. 2013;34:121–126.
- Taylor RL, Bradshaw AP, Halmagyi GM, et al. Tuning characteristics of ocular and cervical vestibular evoked myogenic potentials in intact and dehiscent ears. Audiol Neurootol. Audiol Neurotol. 2012;17:207–218.
- Papathanasiou ES, Murofushi T, Akin FW, et al. International guidelines for the clinical application of cervical vestibular evoked myogenic potentials: an expert consensus report. Clin Neurophysiol. 2014;125:658–666.
- Todd NP, Rosengren SM, Aw ST, et al. Ocular vestibular evoked myogenic potentials (OVEMPs) produced by air- and bone-conducted sound. Clin Neurophysiol. 2007;118:381–390.
- Chihara Y, Iwasaki S, Fujimoto C, et al. Frequency tuning properties of ocular vestibular evoked myogenic potentials. Neuroreport 2009;20:1491–1495.
- Park HJ, Lee IS, Shin JE, et al. Frequency-tuning characteristics of cervical and ocular vestibular evoked myogenic potentials induced by air-conducted tone bursts. Clin Neurophysiol. 2010;121:85–89.
- Brantberg K, Verrecchia L. Effectiveness of different click stimuli in diagnosing superior canal dehiscence using cervical vestibular evoked myogenic potentials. Acta Otolaryngol. 2012;132:1077–1083.
- Brantberg K, Granath K, Schart N. Age-related changes in vestibular evoked myogenic potentials. Audiol Neurotol. 2007;12:247–253.
- Duan M, Agerman K, Ernfors P, et al. Complementary roles of neurotrophin 3 and a N-methyl-D-aspartate antagonist in the protection of noise and aminoglycoside-induced ototoxicity. Proc Natl Acad Sci USA. 2000;97:7597–7602.
- Brantberg K, Verrecchia L. Testing vestibular-evoked myogenic potentials with 90-dB clicks is effective in the diagnosis of superior canal dehiscence syndrome. Audiol Neurotol. 2009;14:54–58.