
Abstract
Background
Speech perception tests are commonly used as indices reflecting hearing ability in daily life. In Japan, the CI-2004 test, first developed in 2004, is widely used as standard, but it was not validated against a large number of normal hearing controls and hearing loss patients.
Aims/objectives
The primary objective of the present study was to develop and validate iPad-based software for the Japanese monosyllable speech perception test, ‘iCI2004’.
Material and methods
Seven universities and two medical centers participated in this study. The hearing threshold and Japanese monosyllable speech perception test results of 77 people with normal hearing and 459 people with hearing loss were collected.
Results
All participants with normal hearing achieved almost perfect perception results both in quiet and in noise. For cochlear implant users, the average monosyllable speech perception score was 55.1 ± 19.6% in quiet and 40.3 ± 19.2% in noise (SNR + 10dB).
Conclusions and significance
We developed iPad-based Japanese monosyllable speech perception test software and validated it by testing a large number of controls and hearing loss patients with cochlear implants or hearing aids. The developed monosyllable speech perception test has a sufficiently large dynamic range for assessing improvement in speech perception in Japanese cochlear implant users.
Chinese abstract
背景:语音感知测试通常用作反映日常听力的指标。在日本, 2004年首次开发的CI-2004测试已被广泛用作标准, 但尚未针对大量正常的听力对照人员和听力损失患者进行验证。
目的:本研究的主要目的是开发和验证基于iPad的日语单音节语音感知测试软件“ iCI2004”。
材料和方法:七所大学和两个医疗中心参与了这项研究。收集了77名听力正常者和459名听力障碍者的听力阈值和日语单音节语音感知测试结果。
结果:所有听力正常的参与者都在安静的和噪音的环境中获得了几乎完美的感知结果。对于人工耳蜗使用者, 平均单音节语音感知得分在安静环境中为55.1±19.6%, 在噪声环境中为40.3±19.2%(SNRþ10dB)。
结论和意义:我们开发了基于iPad的日语单音节语音感知测试软件, 并通过测试大量对照人员和用人工耳蜗或助听器的听力损失患者来验证该软件。已开发的单音节语音感知测试具有足够的大动态范围, 可评估日本耳蜗植入者的语音感知的改善。
Introduction
Recent advances in hearing implants, including cochlear implants (CIs), middle ear implants (e.g. the Vibrant SoundBridge, BONEBRIDGE, and bone-anchored hearing aids), and electric acoustic stimulation (EAS) have dramatically improved the hearing thresholds even in people with profound hearing loss. To measure the effects of hearing aid (HA) and hearing implant use, speech perception tests are commonly used as indices reflecting hearing ability in daily life in many countries [Citation1–11].
In Japan, the Japanese monosyllable speech perception test, 67-S, was first developed in 1967 by the Japan Audiological Society and was later revised in 1987. It is commonly used as the standard testing tool [Citation10–13] and was intended to assess limitations due to hearing loss in daily life, provide information for rehabilitation or training, judge the application of HAs, and measure the effect of HA use [Citation14]. For this reason, monosyllables that are especially difficult for people with severe-to-profound hearing loss to perceive were excluded from the monosyllable list included in the 67-S test. In addition, this test was validated for use in quiet conditions only. When CI provision started in Japan, the 67-S monosyllable test was also used for assessing the hearing outcomes for CI users. However, advances in CI systems have improved users’ speech perception dramatically [Citation3].
In 2004, the Japan Otological Society Cochlear Implantation Research Community developed a new Japanese-language speech perception test battery for CI users. This test battery included the ‘difficult’ monosyllables that had been excluded from the 67-S and also assessed speech perception in noise. This test was named ‘CI-2004 (tentative version)’ and was widely used in many Japanese hospitals as the standard assessment tool for hearing outcomes after CI [Citation11,Citation15,Citation16]. However, this tentative version of the test was not validated against a large control group of people with normal hearing (NH) and people with hearing loss. Thus, its appropriateness as a Japanese speech perception test was not closely examined. To solve this problem, the Japan Otological Society established a working group for CI-2004 validation in 2016.
The original version of the CI-2004 test used a CD as an audio source and the answers were collected on paper, thus data collection and analysis were time consuming. To allow easier data collection and analysis, a computer-based test was desired. For this purpose, we developed iPad-based software for the Japanese monosyllable speech perception test, ‘iCI2004,’ which, as the name indicates, is based on the original version (CI-2004). The aim of the present study is to assess the usefulness of the iCI2004 as a tool for determining the hearing outcomes of Japanese-speaking people who use assistive hearing devices, including CIs, EAS, and hearing aids.
Materials and methods
Subjects
Seven universities and two medical centers participated in this study.
As the baseline data, the hearing threshold and Japanese monosyllable speech perception test results of control subjects with NH (n = 77) were collected. Their average age was 32.6 years old (range 7‒68 years). NH was defined as a pure tone average (PTA) for four frequencies (0.5, 1, 2, and 4 kHz) of under 20 dB bilaterally (average 5.6 dB, range −3.75 to 18.75 dB).
We collected data from 459 people with hearing loss: 226 unilateral CI users, 105 unilateral HA users, 18 bilateral CI users, 18 bilateral HA users, 38 bimodal (CI + HA) users, 28 unilateral electrical acoustic stimulation (EAS) users, 6 bilateral EAS users and 20 without hearing devices.
For unilateral CI patients, we collected data for 226 patients including the hearing thresholds in the implanted ear and monosyllable speech perception scores in quiet and in noise conditions. The average age of the CI patients was 45.6 years old (range 4–89 years). The average hearing threshold with CI was 30.6 dB (range 15.0‒51.25 dB). For unilateral HA patients, we collected data for 105 patients including the hearing thresholds of the ear with the HA and monosyllable speech perception scores in quiet and in noise conditions. The average age of HA patients was 51.2 years old (range 7‒91 years). The average hearing threshold with HA was 47.5 dB (range 21.25‒73.75 dB).
Software
This iPad-based Japanese monosyllable speech perception test software (iCI2004 monosyllable) has two components. The first component is the software for sound system diagnosis. To obtain accurate data, the sound-presenting loudspeaker and amplifier should be appropriately calibrated. The first software presents five kinds of 1/3 octave band noise (central frequencies of these calibration sounds are 200, 500, 1000, 2000, and 4000 Hz). First, the amplifier volume for the 1000 Hz calibration sound is adjusted to 60 dBA by measurement with a noise level meter (frequency weighting: A-weighting, time weighting: slow-weighting, Rion, Tokyo, Japan). Then, the noise level meter score for the same volume of each 1/3 octave band noises (200, 500, 2000, and 4000 Hz) is measured and input into the iPad. If the noise level meter scores are within the ranges shown in , the iPad gives a diagnosis of ‘Pass’ for the appropriate sound system.
Table 1. The sound-presenting loud speaker and amplifier diagnosis standards used in this study.
The other component is the test software. There are only 5 vowels and 17 consonants in Japanese. 100 monosyllables are formed either 5 vowels in isolation and/or 17 consonants combined with those five vowels. All consonant phonemes appear in consonant-vowel (CV) form as there is basically no consonant clusters as you see in Supplemental Table 1. The 60 Japanese monosyllables used in this test and the corresponding international phonetic alphabet for each monosyllable are listed in Supplemental Table 1.
Out of those 95 CV monosyllables, 60 were selected based on their high frequency in Japanese conversation for this test [Citation17]. To maintain compatibility with the CD version of the test, all audio data for 60 Japanese monosyllables, calibration sound (1000 Hz pure tone) and masking noise (weighted random noise JIS T 1201-2;2000) used in this iPad-based software were obtained from the original CD version in wav format.
This software allows us to collect an anonymous patient ID, age, gender, hearing thresholds with/without HAs or CI, and Japanese monosyllable speech perception test scores in quiet and in noise (Supplemental Figure 1). To avoid any learning effect, the 60 Japanese monosyllables are presented in random order. All data are collected via the iPad and were exported as a csv format file. The test can be performed in quiet or in different signal-to-noise ratio (SNR) conditions from +10 dB to −10 dB SNR. The software is available for purchase from the App store (Apple Inc, Cupertino, CA, USA).
Methods
Pure tone audiometry and/or free-field audiometry were performed to evaluate the hearing thresholds of each subject. The pure tone average (PTA) was calculated from the audiometric thresholds at four frequencies (0.5, 1, 2, and 4 kHz).
The Japanese monosyllable speech perception test was performed with the iPad-based software (iCI2004 monosyllable) described above. The sound level was calibrated to 65dBSPL by using the 1000 Hz pure tone calibration sound and the weighted random noise (JIS T 1201-2;2000). The speech signals were presented at a constant 65 dB sound pressure level (SPL). For testing in noise, the volume was set to a signal-to-noise ratio (SNR) of +10 dB, +5 dB, or 0 dB. Tests were performed in a free field, with the subject seated 1 m away from and facing the loudspeakers.
Prior to participation in this study, informed consent was obtained from all subjects or, if a minor, from their legal guardian. All procedures were approved by the Shinshu University Ethical Committee as well as the respective ethical committees of the other participating institutions.
Results
Normal-hearing control results
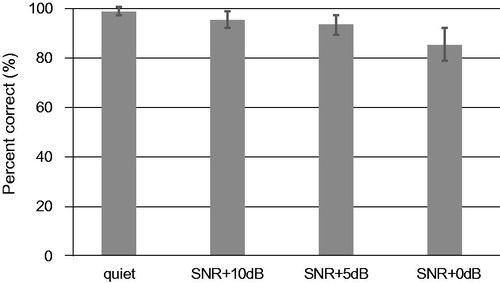
As the baseline data, we collected data from 77 NH control subjects. The demographics of the NH controls are summarized in Supplemental Table 2. The average scores in quiet and in noise are shown in . The average monosyllable speech perception score in quiet was 98.6 ± 1.7% (N = 77, 95% confidence interval (CI) of the average: 98.2‒99.0%). The average scores in noise were 95.2 ± 3.4% for SNR +10 dB, 93.1 ± 3.9% for SNR +5dB, and 85.3 ± 6.9% for SNR 0 dB (for SNR +10dB: N = 56, 95% CI: 91.8‒98.6%; SNR +5dB: N = 44, 95% CI: 89.2‒97.0%; SNR 0 dB: N = 43, 95% CI: 78.4‒92.2%). Thus, the subjects with NH could perceive the test sounds nearly perfectly in quiet and also achieved good perception even in noise.
Figure 1. Results for NH subjects in quiet and in noise. Error bars indicate the standard deviation for each condition.
It is noteworthy that the speech perception scores for some monosyllables used here were low even in the NH controls. Among the 60 monosyllables, 58 monosyllables could be perceived correctly by over 90% of the NH subjects in quiet. The most frequently misperceived monosyllable was ‘ne [ne]’, which was mistaken for ‘me [me]’ by 16 of 77 NH subjects. The second most frequently misperceived monosyllable was ‘bi [bji]’, which was mistaken for ‘ri [ɾji]’ by 8 of 77 NH subjects. Similarly, 54 of 60 monosyllables could be perceived correctly by over 90% of the NH subjects in the SNR + 10dB condition. The most frequently misperceived monosyllable in the SNR + 10dB condition was ‘bi [bji]’, which was again mistaken for ‘ri [ɾji]’ by 40 of 56 NH subjects. The next most frequently misperceived monosyllables were ‘ne [ne]’, which was mistaken for ‘me [me]’ by 27 of 56 NH subjects; ‘fu [ɸɯ]’, which was mistaken for ‘ku [kɯ]’ by 13 of 56 NH subjects; and ‘ru [ɾɯ]’, which was mistaken for ‘bu [bɯ]’ by 13 of 56 NH subjects. Similar misperceptions were observed in the SNR + 5dB and SNR 0 dB conditions. A summary of the correctly perceived subject ratios and error patterns for each monosyllable in quiet or in noise conditions are given in Supplemental Table 3.
Unilateral CI users
The demographic data for CI users are summarized in Supplemental Table 4.
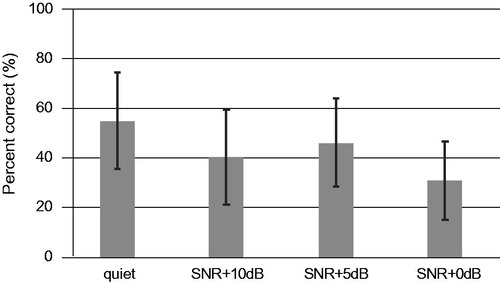
The average scores in quiet and in noise are shown in . The average score in quiet was 55.1 ± 19.6% (N = 226, 95% CI: 52.5‒57.7%). The average scores in noise were 40.3 ± 19.2% for SNR + 10dB (N = 103, 95% CI: 36.6‒44.0%). CI users were only tested in the more difficult SNR + 5dB and SNR0dB conditions if they performed well in the easier SNR + 10dB condition. This was accomplished by 11 CI users, who scored 46.1 ± 17.6% for SNR + 5dB, and 31.1 ± 15.7% for SNR 0 dB (SNR + 5dB: N = 11, 95% CI: 35.7‒56.5%; SNR 0 dB: N = 11, 95% CI: 21.8‒40.4%).
Figure 2. Results for CI users in quiet and in noise. Error bars indicate the standard deviation for each condition.
A summary of the correctly perceived subject ratios of unilateral CI users and error patterns for each monosyllable in quiet or in noise conditions are given in Supplemental Table 5. Among the 60 monosyllables, 44 monosyllables were perceived correctly by over 40% of CI users in quiet.
The most frequently misperceived monosyllable was ‘re [ɾe] ’, with only 20% of CI users correctly understanding this in quiet. It was mistaken for ‘ne [ne]’ or ‘me [me]’ by 80 and 50 of 226 CI users, respectively. The next most frequently misperceived monosyllables were ‘ge [ɡe] ’, ‘be [be] ’, and ‘po [po],’ with only 27.4% CI users understanding them correctly.
HA users
The demographic data of the HA users are summarized in Supplemental Table 6.
The average speech perception scores in quiet or in noise are shown in . The average monosyllable speech perception score in quiet was 40.6 ± 25.8% (N = 105, 95% CI: 35.7‒45.5%). Only 37 HA users received SNR + 10dB testing, because most of the HA users did not achieve good perception even in quiet. As partial results, those for HA users in SNR + 10dB conditions were 46.0 ± 24.5% (N = 37, 95% CI: 38.1‒53.9%).
Figure 3. A: All data for HA patients (in quiet: N = 105, SNR + 10dB: N = 37). B: Results for participants who performed testing both in quiet and in the SNR + 10dB condition (N = 35). Error bars indicate the standard deviation.
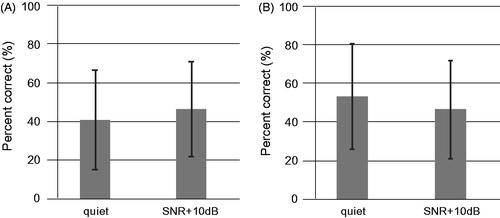
If we include only participants for whom data were available both in quiet and in the SNR + 10dB condition, the average correct score was 53.2 ± 27.2% for quiet and 46.3 ± 25.2% for the SNR + 10dB condition ().
A summary of the correctly perceived subject ratios for HA users and error patterns for each monosyllable in quiet and in noise are given in Supplemental Table 7. Among the 60 monosyllables, 49 monosyllables were perceived correctly by over 40% of HA users in quiet. The most frequent misperceived monosyllable was ‘cha [tɕa] ’, with only 30% of HA users understanding it correctly in quiet. It was mistaken for ‘sa [sa]’ and ‘ta [ta]’ by 19 and 12 of 105 HA users, respectively.
Discussion
In NH controls, all participants achieved almost perfect perception results both in quiet and in noise (in quiet: 98.6%; in noise: 95.2% in SNR + 10dB, 93.1% in SNR + 5dB, and 85.3% in SNR 0 dB). In addition, almost all age groups and genders showed nearly perfect perception (Supplemental Table 2). These results clearly indicate that the iCI2004 monosyllable test consisted of standard Japanese monosyllable sounds that could be perceived correctly by nearly all NH controls. Thus, this test is suitable to assess speech perception for Japanese language speakers.
As shown in Supplemental Table 3, some monosyllables were misperceived even by the NH control group. In quiet, the most frequently misperceived monosyllables were ‘ne [ne]’ (for ‘me [me] ’) and ‘bi [bji]’ (for ‘ri [ɾji] ’). Both ‘m [m]’ and ‘n [n]’ are nasal sounds with different articulation points. Similarly, both ‘b [bj]’ and ‘r [rj]’ are palatalized sounds with different articulation points. Thus, these pairs of sounds are similar. Interestingly, these misperceptions occurred unidirectionally: no NH subject misperceived them in the opposite direction (such as ‘me [me]’ for ‘ne [ne]’) in quiet.
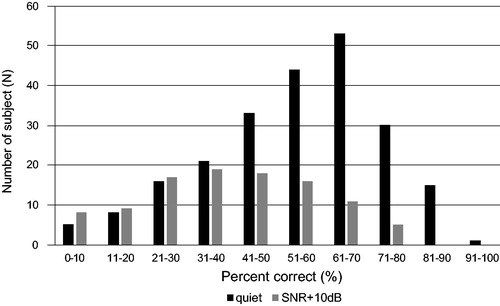
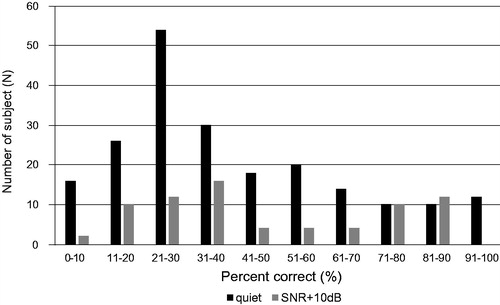
In CI users, the average speech perception scores were 55.1% in quiet and 40.3% in the SNR + 10dB condition. The highest scores were 91.7% correct in quiet and 76.7% in the SNR + 10dB condition. From the distribution of the scores, shown in , we conclude that the iCI2004 monosyllable speech perception test has a sufficient dynamic range for assessing the speech perception improvement in Japanese language CI users (). We recommend the test be performed in the SNR + 10dB condition only if the subject achieves a score of 60% or more in quiet.
Figure 4. Distribution of scores for CI users. (Quiet, n = 226; noise, n = 103).
The results are similar to those for other languages [Citation3,Citation4,Citation9]. In addition, CI users’ scores on the iCI2004 were slightly worse than those on the 67-S [Citation13,Citation15]. This result was expected because more difficult monosyllables were added in the iCI2004.
In HA users, the average scores were 40.6% in quiet and 46.0% in the SNR + 10dB condition. When we restricted the participant to those for whom testing was performed in both quiet and SNR + 10dB, the average correct scores were 53.2% in quiet and 46.3% in the SNR + 10dB condition.
These results were more widely distributed than those of the CI users (), which reflects the differences in hearing thresholds with HAs. Two HA users achieved perfect perception in quiet but none achieved a perfect score in the SNR + 10dB condition. For HA users, we recommends that the test be performed in SNR + 10dB conditions only if the subject achieves a score of 60% or more in quiet.
Figure 5. Distribution of the scores for HA users (quiet, n = 105; noise, n = 37).
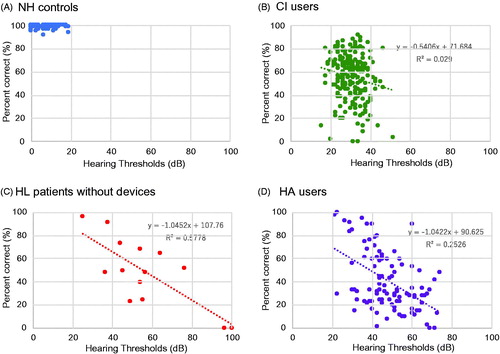
To assess the correlation between the hearing thresholds and iCI2004 monosyllable perception score, we plotted the hearing thresholds and monosyllable perception scores for each CI user and HA user (). We also plotted the data for the NH control group and the subjects with hearing loss but without any hearing devices (). The results clearly indicate that the scores on the iCI2004 were correlated with the hearing thresholds. Thus, scores on the iCI2004 reflect hearing thresholds and are an appropriate measure of hearing ability.
Figure 6. Correlation between hearing thresholds and iCI2004 scores for NH controls (A), CI users (B), people with hearing loss but without hearing devices (C), and HA users (D) in quiet.
One of the major advantages of this computer-based monosyllable speech perception test is that it is possible to analyze the data more easily than with the CD and paper test. For example, it is possible to create confusion matrices for CI users in this study and analyze their misperception tendencies (Supplemental Figure 2).
In conclusion, we developed iPad-based Japanese monosyllable speech perception test software and validated this software via testing on a large number of people with NH or people with hearing loss. The fundamental concept and basic system of this computer-based monosyllable speech perception software will be a powerful tool to develop iPad-based speech perception test software in other languages.
Supplemental Material
Download MS Word (1.4 MB)Acknowledgements
The authors thank all the participants for their time and effort. The authors also thank Dr. Nariaki Amano, and Dr. Kiyoshi Yonemoto for their audiological advice regarding appropriate loud speaker settings for the Japanese monosyllable speech perception test, and Michael Todd (MED-EL) for his great help in editing a version of this manuscript. This study was partly supported by the program on Open Innovation Platform with Enterprises, Research Institute and Academia (OPERA) from the Japan Science and Technology Agency (JST) grant number JPMJOP1722.
Disclosure statement
No potential conflicts of interest were reported by the author(s).
References
- Hirschfelder A, Gräbel S, Olze H. The impact of cochlear implantation on quality of life: the role of audiologic performance and variables. Otolaryngol Head Neck Surg. 2008;138(3):357–362.
- Baumgartner WD, Jappel A, Morera C, et al. Outcomes in adults implanted with the FLEXsoft electrode. Acta Otolaryngol. 2007;127(6):579–586.
- Krueger B, Joseph G, Rost U, et al. Performance groups in adult cochlear implant users: speech perception results from 1984 until today. Otol Neurotol. 2008;29(4):509–512.
- Sladen DP, Gifford RH, Haynes D, et al. Evaluation of a revised indication for determining adult cochlear implant candidacy. Laryngoscope. 2017;127(10):2368–2374.
- Skarzynski H, Lorens A, Piotrowska A, et al. Partial deafness cochlear implantation in children. Int J Pediatr Otorhinolaryngol. 2007;71(9):1407–1413.
- Lorens A, Polak M, Piotrowska A, et al. Outcomes of treatment of partial deafness with cochlear implantation: a DUET study. Laryngoscope. 2008;118(2):288–294.
- Erixon E, Rask-Andersen H. Hearing and Patient Satisfaction Among 19 patients who received implants intended for hybrid hearing: a two-year follow-up. Ear Hear. 2015;36(5):e271–e278.
- Rotteveel LJ, Snik AF, Cooper H, et al. Speech perception after cochlear implantation in 53 patients with otosclerosis: multicentre results. Audiol Neurootol. 2010;15(2):128–136.
- Li J, Ji F, Chen W, et al. Analysis of the performance of post-lingually deafened patients with Nurotron(®) Venus™ cochlear implants. Acta Otolaryngol. 2014;134(6):609–614.
- Usami S, Moteki H, Tsukada K, et al. Hearing preservation and clinical outcome of 32 consecutive electric acoustic stimulation (EAS) surgeries. Acta Otolaryngol. 2014;134(7):717–727.
- Moteki H, Nishio SY, Miyagawa M, et al. Long-term results of hearing preservation cochlear implant surgery in patients with residual low frequency hearing. Acta Otolaryngol. 2017;137(5):516–521.
- Fukuda S, Fukushima K, Toida N, et al. Monosyllable speech perception of Japanese hearing aid users with prelingual hearing loss: implications for surgical indication of cochlear implant. Int J Pediatr Otorhinolaryngol. 2003;67(10):1061–1107.
- Omichi R, Maeda Y, Sugaya A, et al. Outcomes of consonant-vowel monosyllable perception and word recognition after cochlear implantation in elderly Japanese patients. Acta Otolaryngol. 2015;135(11):1108–1112.
- Kanzaki J, Oda J. Speech audiometry procedure. Audiology Japan. 2003;46(6):621–637. In Japanese.
- Matsuda Y, Okuda T, Nakashima T, et al. Speech perception with two monosyllabic word lists in cochlear implant users: the CI 2004 monosyllable lists and 67-S lists. Audiology Japan. 2019;62(3):211–217. In Japanese.
- Iba M, Kumagai F, Kumakawa K, et al. Evaluation of speech perception for cochlear implant users using the Japanese speech recognition test battery, “CI. Audiology Japan. 2011;54(4):277–284. 2004”. In Japanese.
- Kodera K, Hiraishi M. Incidence of monosyllables in Japanese conversation. Audiology Japan. 2011;41:73–78. In Japanese.