
Abstract
Background
Lesions causing changes in the microstructure of the organ of Corti may lead to hearing impairment.
Aims/objectives
The aim of this study was to investigate the effect of various structural lesions on the organ of Corti and the auditory function.
Methods
A finite element method of the cochlea and the organ of Corti were established based on computed tomography scanning and anatomical data. We evaluated the accuracy of the model by comparing the simulation results to reported experimental data. We simulated and analyzed the impact of the lesions on the sound-sensing function of the cochlea by adjusting the biomaterial parameters of each component of the cochlea.
Results
In the explored frequency range, the stereocilia and outer hair cells and basilar membrane sclerosis resulted in 23.4%, 47.2%, and 57.8% reduction of basilar membrane displacement, respectively. Lesions of the basilar membrane and stereocilia and outer hair cells in the Corti caused a hearing response curve shift to higher frequencies and a decrease of the amplitude of the basilar membrane.
Conclusions and significance
Lesions of the internal structure of the Corti cause diminished movement of basement membrane and decreased sensorial function, which ultimately lead to hearing loss.
Chinese Abstract
背景:确定预后和随后进行面神经减压的过程已成为决定患者生活质量的重要因素。
目的:本研究基于神经电图(ENOG)时间和神经传导研究(NCS)对面瘫预后进行详细验证。
材料与方法:对368例面瘫患者的ENOG和NCS进行分析。将6 个月后的 House-Brackmann (HB) 量表用作表示结果。对鼻肌/上唇和鼻翼上提肌 (NL) 和眼轮匝肌 (OO) 肌肉进行ENOG, 对颞支、颧支和颊支进行 NCS。
结果:发病后 4-6 天在 OO 处进行的 ENOG 为 ≤10%(p = .002, 10.0 倍)并显示不利的结果(当标准为 ≥ 30% 时)。此外, 发病后 13-15 天对NL 进行的 ENOG为 <10%(p = .001, 10.5 倍)并显示不利的结果(当标准为 ≥30% 时)。
结论:结果表明, 在发病后 4-6 天对OO 的 进行的ENOG, 以及在发病后 13-15 天对NL进行的ENOG, 对急性周围性面瘫治疗结果具有较大的预后价值。
Introduction
According to the World Health Organization report, the number of people with hearing disabilities worldwide was almost 42 million in 1985, 120 million in 1995, 250 million in 2001, and nearly 300 million in 2014 [Citation1]. Hearing loss (HL) seriously affects people's daily life. Based on the pathogenesis, HL can be divided into conductive, sensorineural, and mixed HL [Citation2]. In most cases HL is sensorineural.
The lesion sites of sensorineural HL can be found in the cochlea, the auditory nerve, the subsequent auditory pathways, and the auditory cortex center. Among them, the cochlea is the most vulnerable site for sensorineural HL. Due to the complexity of the inner ear structure, the direct experimental study of the cochlea is challenging. Finite element model (FEM) simulations based on the mechanical theory provide alternative approaches to explore the cochlea sound-sensing function and the pathogenic mechanisms of cochlear dysfunction.
Lesions can diminish the actual function of the cochlea. The amplifying function of the cochlea increases the amplitude and auditory sensitivity of the basilar membrane (BM) [Citation3]. Lesions of the cochlea can impair this action. However, it cannot be ruled out that the lesions can cause changes in the microstructure of the organ of Corti itself, leading to hearing impairment. Scientists have achieved many results by using The Mechanical Theory, and FEM simulations have been applied to explore this hypothesis. Peterson and Bogert [Citation4] developed a one-dimensional linear model of the cochlea applying a ductal shape and a symmetrical distribution of the two cavities with the BM as an interface. Gan et al. [Citation5] developed a whole-ear model containing a linear cochlea, and the mechanical behavior of the middle ear and BM was analyzed during sound perception. Koike et al. [Citation6] developed a linear human cochlear model and analyzed the effect of external lymphatic fistula on cochlear vibration. Yao et al. [Citation7,Citation8] established a whole-ear model including a spiral shape cochlea and studied the impact of fissura ante fenestram sclerosis on hearing.
The effect of cochlear sound-sensing lesions on the BM has been studied primarily from the perspective of the cochlear macrostructure. However, cochlear lesions are not only located on the BM, but may occur in other sites, within the organ of Corti, such as the outer hair cells (OHC), the OHC stereocilia, etc. For this purpose, we established a FEM of the cochlea and the organ of Corti based on experimental data, simulating the kinetic response when the location of the lesion is located on the organ of Corti, and investigated the effects of macro and microstructural lesions on hearing, in order to explore the pathophysiology of sensorineural HL.
Materials and methods
Establishment of the macroscopical cochlear FEM
Geometric modeling of the cochlea
Computed tomography (CT) images of the human right ear were scanned with the aid of the third-generation medium-energy synchrotron light source CT scanning imaging technology and equipment from the Shanghai Institute of Applied Physics (scanning parameters: collimation 0.325 mm, rotation time 0.4 s, reconstruction layer thickness 0.325 mm, interval 0.25–0.5 mm, resolution 0.325 × 0.325 × 0.325 mm). These images were based on a fresh specimen of the human right ear provided by Zhongshan Hospital of Fudan University.
The following steps were conducted in order to develop the cochlear FEM:
Image processing: Since CT measurements are two-dimensional data, the cavity structure of the cochlea was processed using Mimics (Materialize NV, Leuven, Belgium) regularization in order to build it into a three-dimensional solid structure. The data of each structure inside the cochlea were obtained using the fact that different structures in the cochlea exhibit different gray values. Then, a Boolean operation was performed using the software's tools to generate a rough model of the cochlear structure. Finally, a file of the data of the cochlear could be obtained.
Smooth processing and 3D solid model building: We obtained a curved 3D cochlear model of the ear by importing the obtained rough 3D model into Geomagics (3D Systems, Morrisville, NC, USA), and using the software's own tools for local refinement, surface fitting, noise reduction, and surface extraction. We generated a format file of the model.
Model formation and analysis: The obtained files were imported into Comsol (Comsol, Stockholm, Sweden) to process some fine units and to optimize the adjustment of the solid model. Comsol is a multi-object field coupling software, capable of analyzing and studying through multiple interface compositions, with a fully developed architecture for various coupling analysis of cochlear models.
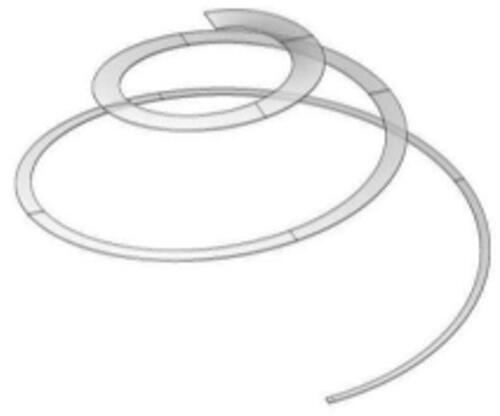
After the above data processing and model development process, the final numerical model of the cochlea was obtained. Compared with previous studies that modelled the cochlea as a straight line, the present model considers the real spiral shape of the cochlea, as shown in . The geometry of the BM structure is shown in .
Figure 1. Geometric modeling of the cochlea.

Figure 2. Geometric modeling of the BM.
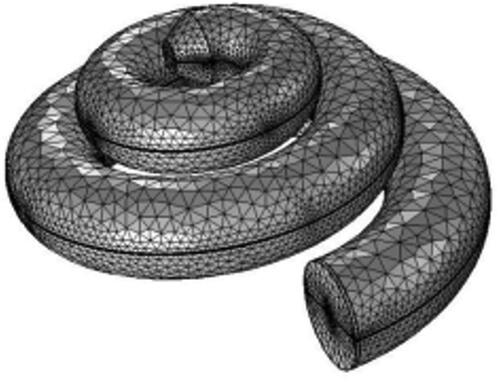
Comsol was used to select a suitable mesh with minimum computational error. At the same time, it also provided an adaptive mesh refinement function, which could refine the mesh for some boundary layers and local load locations to improve the accuracy of the calculation results. The final mesh of hexahedral cells is shown in .
Figure 3. Meshing of the cochlear spiral model.
The internal components of the model were modelled as linear elastic materials. Among them, a large value of elastic modulus was applied to the osseous spiral lamina. The BM has been shown to be anisotropic; therefore, different material properties were applied in three axes, x, y and z. The parameters of round window and oval window were taken mainly from the data used in the Gan modeling process [Citation9,Citation10]. The density of the lymphatic fluid in the cochlear cavity was adopted from the density of water, and a low viscosity compressible fluid with a damping factor of 1.0 × 10⁻⁴s was used in the model as shown in .
Table 1. Material parameters of the structures in the cochlea.
The outer ring of the cochlear model is connected to the surrounding temporal bone through various soft tissues and was assumed to be a fixed constraint. The model was mainly calculated for frequency domain analysis and contained only cochlear structures without middle ear structures, which have a certain gain effect on the sound pressure transmitted to the inner ear as shown in .
Figure 4. Middle ear sound pressure gain curve.
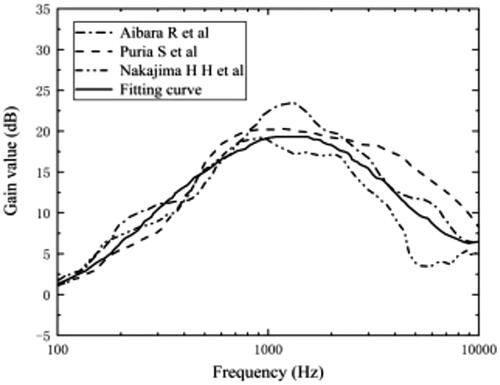
The middle ear amplifies the sound pressure intensity in all frequency bands, and the gain curve of the middle ear showed a trend of increasing and then decreasing with increasing frequency. The gain effect reaches its maximum value of about 20 dB at 1 kHz according to . Therefore, this paper the final sound pressure intensity on the oval window is obtained by adding the sound pressure in the external ear canal to the gain in the middle ear. For the validation of the model, the value of the sound pressure applied to the ear canal was set to 80 dB, and the frequencies measured were between 100 Hz and 20 kHz.
Establishment of organ of Corti FEM
Organ of Corti geometry modeling
The proposed model is a cross-section of the three-dimensional spiral cochlea. The structure is approximately considered as a plane strain state due to minor deformation. The location chosen for the organ of Corti is 2.5 mm–3.0 mm away from the base. The corresponding characteristic frequency (CF) of this section is nearly 16 kHz. The geometric data used in this paper are mainly from the experiments of Edge et al. [Citation11]. The geometric parameters of these structures are primarily shown in . These parameters are combined with the relative relations of various components in the organ of Corti to establish its geometric model.
Table 2. Geometric parameters of structures in Corti.
The modeling method with AutoCAD is shown in . The wireframe is imported into COMSOL. The corresponding entity is deleted to get the final picture of the organ of Corti’s geometry as shown in .
Figure 5. CAD wireframe of the organ of Corti.
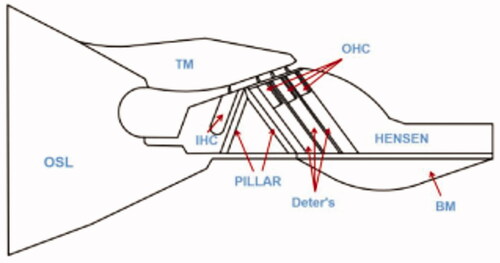
Various structures were assigned different material properties during modeling. A total of material properties corresponding to various components were specified in the FEM, and corresponding labels are rendered in the figure, shown in . The Young's modulus of individual segments of the model is based on the corresponding references [Citation12–14], as shown in , where IHC is the inner hair cell and RL is the reticular lamina.
Figure 6. The geometric shape of the organ of Corti. (1: OSL; 2: TM; 3: Hensen cells; 4: IHC; 5: Pillar cell; 6: Deter’s cell; 7: OHC; 8: BM; 9: OHC stereocilia; 10: RL).
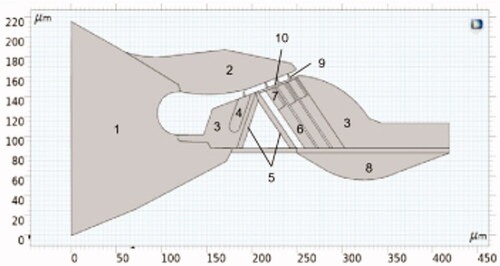
Table 3. Young's modulus, Poisson's ratio and mass density of various structures in Corti.
The left side of the organ of Corti connects the osseous spiral lamina (OSL) of the cochlea, whereas the right side of the cochlea is situated on the spiral ligament, leading to a small deformation. Therefore, the boundary condition of the model is that the left and right sides can be approximately regarded as fixed displacement boundary conditions. The connection between OHC stereocilia and tectorial membrane (TM) is assumed to be hinged. The cochlea is filled with lymphatic fluid, and when the cochlea senses a sound, the lymphatic fluid will generate a pressure wave, thus acting as a force on the BM. The model in this paper replaces the force of the lymphatic fluid acting on the BM by a uniform load along the y direction of the BM.
Meshing of the organ of Corti model
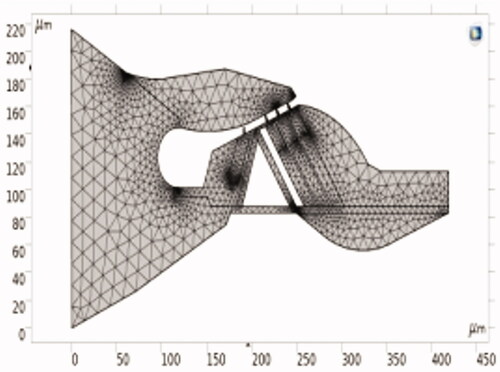
shows the mesh division of the FEM of the organ of Corti. The interface and curvature of different materials are divided more finely. The mesh consists of 8046 triangular elements and 1085 edge elements.
Figure 7. Meshing of the organ of Corti.
Results
Validation of the macroscopical cochlear model
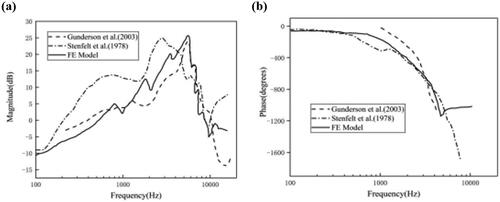
The selected cross-section was located 12 mm from the base of the cochlea with an applied sound pressure magnitude of 80 dB in the external auditory canal, and the frequency domain analysis curves of the response amplitude and response phase of the cross-section at this location were calculated. The response amplitude of the curve is the ratio of the displacement amplitude of the centerline of the BM at this cross-section to the displacement amplitude of the oval window. The response amplitude of the curve and the phase difference between BM and oval window center are shown in and in comparison with the experimental values obtained by Gunderson et al. [Citation15] and Stenfelt et al. [Citation16] (the amplitude values are normalized to the sound pressure values in the figures).
As seen on , the curve as a whole shows an upward trend until the applied frequency is 4 kHz. We observed a rapid decrease of the displacement response amplitude with increasing frequency. We found a minimum value around 9 kHz, which is about –5 dB, and a certain degree of pulling up after 10 kHz. We detected that after 10 kHz, the displacement amplitude is maintained at –3 dB or so. The amplitude response curves of the model do not differ much from the experimental results of Gunderson and Stenfelt in terms of displacement amplitude, optimum frequency, and overall trend.
Based on our observations the phase value obtained by the model does not vary much up to 1 kHz, with a value of about −50 degrees, as shown on . After that, it starts to decline slowly until 4 kHz when the phase starts to drop sharply and pulls up to some extent at high frequencies. The simulated phase data almost overlap with the experimental data until 4 kHz, and the overall trend of the curve is consistent.
Both the displacement response curve and phase data are in good agreement with the experimental values, so the model can be proved to be valid.
Validation of the organ of Corti model
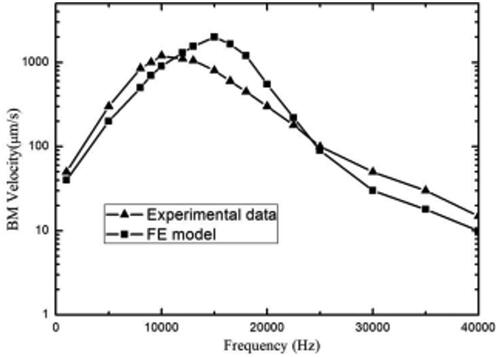
For the purpose of the model’s accuracy, a BM velocity experiment was performed and verified Experimental data obtained by Ren et al. [Citation17] were used for comparison. The sound pressure was 80 dB. The position of the BM speed measuring point is shown in .
Figure 8. The measuring point of the BM velocity.
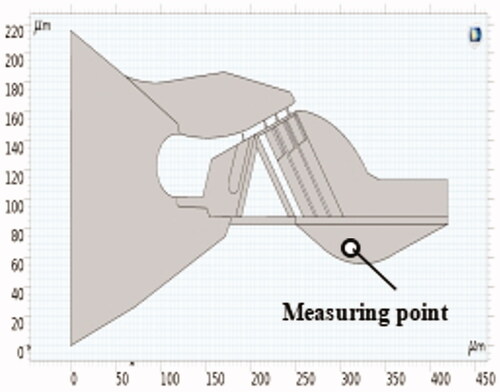
Figure 9. Comparison of experimental and simulated values. (a) Ratio of BM amplitude to oval window amplitude; (b) difference in phase angle between BM and oval window center.
The BM velocity obtained by the model is shown in . At first, the velocity increases and subsequently decreases with frequency rise. The CF of the BM velocity is 16 kHz, and the amplitude is about 1300 μm/s. By comparing the analysis with the experimental values of Ren and Nuttall, the numerical results of the measured position in this paper and the CF of the experimental data do not differ significantly. The difference in the magnitude of velocity is also small.
Figure 10. The simulation and experimental results of BM velocity.
Solution of BM pressure
The pressure value of the cross-section at 3.0 mm from the bottom of the cochlear model was calculated. The frequency range of calculation was 100 Hz to 70 kHz. The sound pressure intensity of the external ear canal was also selected as 80 dB. The pressure values were normalized to the sound pressure values. The frequency–pressure curve is shown in .
Figure 11. BM pressure curve at 3 mm from the basal of cochlea.
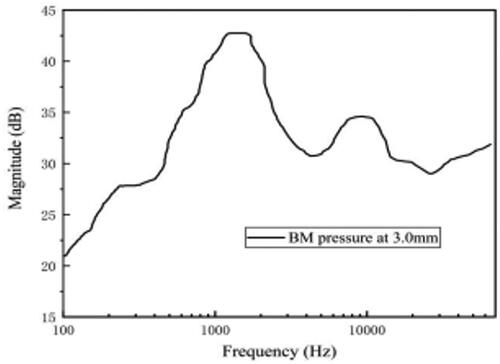
As shown in , the pressure curve of the BM varies mostly in the low-frequency range, and the sound pressure changes relatively little at high frequencies. Between 100 Hz and 1 kHz, the pressure amplitude increases with the increase of frequency, and there is a relatively smooth region between 200–400 Hz, reaching a maximum value of about 43 dB at about 1 kHz. After reaching the peak, the pressure amplitude starts to decrease rapidly and rebounds to a certain extent after 4 kHz, reaching a small peak at about 10 kHz with a peak value of about 35 dB. After that, the pressure value continues to decrease and flattens out after 15 kHz, remaining at about 30 dB.
Simulation of sensorineural deafness lesions
Many cases of sensorineural deafness are caused by cochlear damage from diseases such as pneumonia, and other factors such as ototoxicity, Ménière's disease or acoustic, etc. These diseases can damage the structure of the organ of Corti. It is generally believed that these diseases weaken the amplifying function of the OHC. However, the influence of changes in the internal structure of the organ of Corti caused by the lesions cannot be ruled out. Therefore, this effect is analyzed using the FEM of the organ of Corti established above. The main research objects are OHC, BM, and OHC stereocilia.
Discussion
The influence of OHC stereocilia lesion on hearing
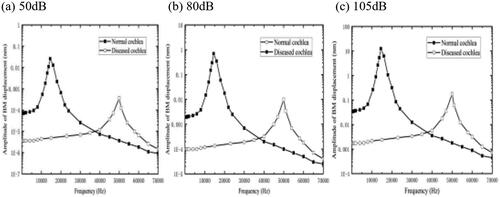
The noise will damage the organ of Corti in the cochlea, and the denaturation will be aggravated with the increase of noise intensity and time exposure. We modelled the deterioration in response to stimuli by increasing the elastic modulus of the OHC bundles [Citation18,Citation19], selecting a lesion OHC bundles modulus of 100 times than the original. The selected cross-section is 2.5–3.0 mm from the bottom of the cochlea. An acoustic pressure of 80 dB is applied to the external ear canal, and the calculation results are shown in . After that, the sound pressure value acting on the bottom of the BM is changed to 50 dB and 105 dB, the results are shown in and .
Figure 12. BM displacement frequency response curve after hardening of OHC bundles.
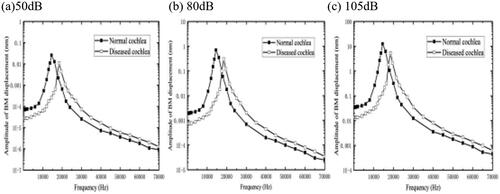
In our experiments, we found that the simulated CFs of the cochlear cross-section at 50 dB, 80 dB, and 105 dB are all about 16 kHz under normal physiological conditions, while the CF of the cochlear cross-section at this location increases to 20 kHz after the hardening of the OHC bundles. This leads to a shift of the CF of the cross-section to higher frequencies and a threshold shift phenomenon, which is consistent with the increase of the transverse stiffness of the cochlear cross-section. It indicates that the hardening of the OHC bundles will lead to the increase of transverse stiffness of the organ of Corti section. In the frequency range investigated, the BM displacement under the effect of different acoustic pressures decreased to a certain extent relatively to the normal physiological state, with a decrease value of about 23.4%. In addition, as the intensity of the applied acoustic pressure increased, the amplitude of the BM increased while the hearing value loss also increased. This indicates that the OHC bundles respond less to stimulation due to sclerosis, which causes HL, and the risk of HL increases with the rise of the acoustic pressure.
The influence of OHC lesion caused on hearing
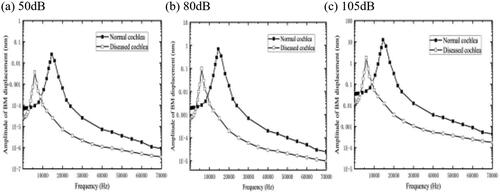
Noise can also damage the OHCs. To evaluate the effect of hardening of the OHCs on hearing function, we applied an increased elastic modulus of the OHCs to 100 times its normal value. A cross-section of 2.5 mm–3.0 mm from the base of the cochlea was selected, and an acoustic pressure of 80 dB was applied to the external auditory canal, and the calculated results are shown in . After that, the sound pressure value acting on the bottom of the BM is changed to 50 dB and 105 dB.
Figure 13. BM displacement frequency response curve after sclerosis of OHCs.
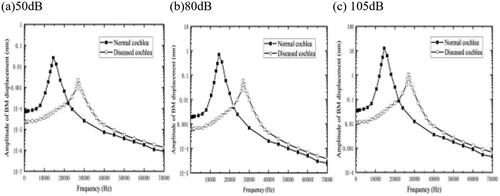
As we can see from , the CF of the BM after the lesion under the action of 50 dB, 80 dB, and 105 dB is around 28 kHz, a threshold shift occurs, and the shift of the CF to higher frequencies is greater compared to the OHC stereocilia sclerosis. This suggests that the effect of OHCs sclerosis on the lateral stiffness of the cochlear cross-section is greater relative to that of OHC bundles. In the frequency range explored, the BM displacement under the effect of different acoustic pressures is reduced more relative to the normal physiological state, with a decrease value of about 47.2%, which is significantly greater than the 23.4% decrease due damage of the OHC bundles, indicating that OHCs sclerosis also has a greater detrimental effect on hearing. Similarly, as the applied sound pressure intensity increases, the hearing value loss increases. In addition, sclerosis of the OHCs also leads to a decrease in stimulation of OHC bundles and thus HL.
Figure 14. BM displacement frequency response curve after hardening.
The influence of BM lesion caused on hearing
Otosclerosis is a common ear disease affecting the stapedial plate and cochlea. Crompton et al. [Citation20] found that inner ear sclerosis is associated with abnormal bone metabolism in the bone vagus. When the lesion occurs in the cochlea, it will lead to BM lesions and structural damage, which will lead to BM sclerosis and BM quality changes.
To predict the possible effect of such lesions, we increased the modulus of elasticity of the BMs by 100 times than the normal. Then, a cross-section of 2.5 mm–3.0 mm from the base of the cochlea was selected, and an acoustic pressure of 80 dB was applied to the external auditory canal. The sound pressure on the bottom of the BM was also tested with 50 dB and 105 dB.
The calculated results are shown in .
As seen on , there is a threshold shift in the BM amplitude with the increase of the acoustic pressure. It is worth noting that the CF shift of the BM is much larger compared to the shift generated by the change in elastic modulus of the OHCs and OHC bundles, which suggests that the BM contributes more to the transverse stiffness of the organ of Corti cross-section than the OHCs. The BM is the major component of the transverse stiffness of the organ of Corti cross-section. In the calculated frequency range, the displacement of BM under different sound pressure decreased by 57.8% compared with the normal physiological state. This shows that cochlear sclerosis will cause relatively large HL.
BM sclerosis is expected to change the properties of the BM. To test this hypothesis, we increased the mass by100 times its original size, and an acoustic pressure of 80 dB was applied in the external ear canal, as shown in . After that, the sound pressure on the base of the BM were also examined with 50 dB and 105 dB.
Figure 15. Displacement frequency response curve of BM mass change.
As is shown in , when the BM mass increased the frequency–response plot is shifted to the left, and the amplitude of the BM in the high-frequency region shows a reduction. There is a decline by 55.8%, which indicates that the HL in the high-frequency band caused the mass increase is serious.
Conclusions
This paper proposes a FEM of the cochlea and the organ of Corti developed to study the effects of cochlear lesions on hearing. Our findings indicate that:
Both macroscopic lesions of the BM and microscopic lesions of the OHCs and OHC bundles of the cochlea will cause a shift in the hearing response curve toward higher frequencies, with a concomitant decrease in basilar amplitude.
In the investigated frequency range, the maximum reduction of BM displacement is 23.4% after OHC stereocilia sclerosis, 47.2% after OHCs sclerosis, and 57.8% after BM sclerosis. The increase in BM mass is mainly reflected in the amplitude reduction of the BM in the high-frequency region, with a maximum reduction of 55.8%, indicating a serious HL in the high-frequency band.
Cochlear lesions result in reduced sound perception in the organ of Corti and ear HL occurs, and BM lesions have the greatest impact, which suggests that macroscopic support structures play a significant role in the sound perception process. The BM is also the main contributor to the transverse stiffness of the organ of Corti. As the sound pressure increases, the greater the effect of internal structural lesions of the organ of Corti on hearing, the greater the loss of hearing values.
Compliance with ethical standards
This study was compliant with ethical standards.
Disclosure statement
No potential conflict of interest was reported by the author(s).
Additional information
Funding
References
- Raal H, Mitchell M. Histopathology of profound sensorineural deafness. Ann N Y Acad Sci. 1983;405(405):459–484.
- Geleoc GSG, Holt JR. Sound strategies for hearing restoration. Science. 2014; 344(6184):1241062.
- Liberman MC, Gao J, He DZ, et al. Prestin is required for electromotility of the outer hair cell and for the cochlear amplifier. Nature. 2002; 419(6904):300–304.
- Peterson LC, Bogert BP. A dynamical theory of the cochlea. J Acoust Soc Am. 1950;22(3):369–381.
- Gan RZ, Cheng T, Dai C, et al. Finite element modeling of sound transmission with perforations of tympanic membrane. J Acoust Soc Am. 2009;126(1):243–253.
- Koike T, Sakamoto C, Sakashita T, et al. Effects of a perilymphatic fistula on the passive vibration response of the basilar membrane. Hear Res. 2012;283(1-2):117–125.
- Yao W, Chen Y. Numerical simulation based on the three-dimensional model of inner stereocilium. Appl Math Mech-Engl Ed. 2017;38(7):997–1006.
- Yao W, Zhong J, Duan M. Three-dimensional finite-element analysis of the cochlear hypoplasia. Acta Otolaryngol. 2018;138(11):961–965.
- Kapuria S, Steele CR, Puria S. Mechanics of the unusual basilar membrane in gerbil. AIP Conf. proc. 2011;1403:333–339.
- Zhang X, Gan RZ. Dynamic properties of human round window membrane in auditory frequencies running head: dynamic properties of round window membrane. Med Eng Phys. 2013;35(3):310–318.
- Edge RM, Evans BN, Pearce M, et al. Morphology of the unfixed cochlea. Hear Res. 1998;124(1-2):1–16.
- Andoh M, Nakajima C, Wada H. Phase of neural excitation relative to basilar membrane motion in the organ of Corti: theoretical considerations. J Acoust Soc Am. 2005;118(3 Pt 1):1554–1565.
- Cai HX, Shoelson B, Chadwick RS. Evidence of tectorial membrane radial motion in a propagating mode of a complex cochlear model. Proc Natl Acad Sci USA. 2004; 101(16):6243–6248.
- Zagadou BF, Barbone PE, Mountain DC. Elastic properties of organ of Corti tissues from point-stiffness measurement and inverse analysis. J Biomech. 2014;47(6):1270–1277.
- Gundersen T, Skarstein O, Sikkeland T. A study of the vibration of the basilar membrane in human temporal bone preparations by the use of the Mössbauer effect. Acta Otolaryngol. 1978;86(3-4):225–232.
- Stenfelt S, Puria S, Hato N, et al. Basilar membrane and osseous spiral lamina motion in human cadavers with air and bone conduction stimuli. Hear Res. 2003;181(1-2):131–143.
- Ren T, Nuttall AL. Basilar membrane vibration in the basal turn of the sensitive gerbil cochlea. Hear Res. 2001;151(1–2):48–60.
- Nakajima HH, Ravicz ME, Rosowski JJ, et al. Experimental and clinical studies of malleus fixation. Laryngoscope. 2005;115(1):147–154.
- Dai C, Cheng T, Wood MW, et al. Fixation and detachment of superior and anterior malleolar ligaments in human middle ear: experiment and modeling. Hear Res. 2007;230(1–2):24–33.
- Crompton M, Cadge BA, Ziff JL, et al. The epidemiology of otosclerosis in a British cohort. Otol Neurotol. 2019;40(1):22–30.