
Abstract
Background
Free fatty acids (FFAs) could induce inflammatory responses via various pathways. Ferroptosis is characterized by the accumulation of lipid peroxidation products and fatal reactive oxygen species derived from iron accumulation, which may be an upstream event in the inflammatory injuries.
Objectives
To investigate the involvement of ferroptosis during the FFAs-induced pathological hair cell inflammatory injuries and its underlying mechanisms.
Material and Methods
We utilized House Ear Institute-Organ of Corti 1 (HEI-OC1) cell line as an in vitro model. The palmitate acid (PA) was utilized as a substitute for FFA, with cotreatment with ferroptosis inducer RSL3 and ferroptosis inhibitor Fer-1. Cell viability, lactase dehydrogenase (LDH) release, the expressions of ferroptosis-related factors such as glutathione peroxidase-4 (GPX4), solute carrier family 7 member 11 (SLC7A11), as well as toll-like receptor 4 (TLR4), ferric ion and reactive oxygen species (ROS), and partial inflammatory cytokines were measured.
Results
PA treatment might induce ferroptosis in HEI-OC1 cells, manifested as decreased cell viability, upregulated LDH release, iron overload, and ROS accumulation. Several inflammatory cytokines including IL-1β, IL-6, IL-1β, IL-6, TNF-α, MCP-1, IL-13, IL-12 p40, CCL5, G-CSF, and GM-CSF were upregulated compared to the Ctr group, while GPX4 and SLC7A11 were downregulated. The expression of TLR4 in the inflammatory pathway was also upregulated. Besides, these changes were further exacerbated by RSL3 cotreatment and abolished by Fer-1 cotreatment.
Conclusions and Significance
Ferroptosis inhibition could alleviate the PA-induced inflammatory injuries via inactivation of TLR4 signaling pathway in HEI-OC1 cell line.
Chinese Abstract
背景:游离脂肪酸 (FFA) 可通过多种途径诱导炎症反应。铁死亡的特征是由铁积累导致的脂质过氧化产物积累和致命的反应性氧物质, 这可能是炎性损伤的上游事件。
目的:研究 FFA诱导的病理毛细胞炎症损伤过程中铁死亡的参与及其机制。
材料和方法:我们利用 House Ear Institute-Organ of Corti 1 (HEI-OC1) 细胞系作为体外模型。 棕榈酸 (PA) 被用作 FFA 的替代品, 用铁死亡诱导剂 RSL3 和 铁死亡抑制剂 Fer-1联合处理。 测量了细胞活力、乳糖酶脱氢酶 (LDH)释放、铁死亡相关因子如谷胱甘肽过氧化物酶-4(GPX4)的表达、溶质载体家族 7 成员 11 (SLC7A11)、 Toll 样受体 4 (TLR4)、铁离子和活性氧物质 (ROS)和部分炎症细胞因子。
结果:PA处理可能诱导HEI-OC1细胞发生铁死亡, 表现为细胞活力减少、上调的 LDH 释放、铁过载和 ROS 积累。 几种炎症细胞因子, 包括 IL-1β、IL-6、IL-1β、IL-6、TNF-α、MCP-1、IL-13、IL-12 p40、CCL5、G-CSF 和 GM-CSF, 与 Ctr 组相比较且被上调, 而 GPX4 和 SLC7A11则 被下调。 炎症通路中 TLR4 的表达也被上调。 此外, 这些变化因RSL3 联合处理而进一步加剧, 因Fer-1 联合处理而消除。
结论与意义:通过HEI-OC1 细胞系中 TLR4 信号通路失活, 铁死亡抑制可减轻PA诱导的炎症伤害。
Introduction
The concept of ferroptosis was firstly coined in 2012 by Dixon et al. [Citation1] and greatly enriched our understanding into non-apoptotic cell death pathways. It is characterized by the accumulation of lipid peroxidation (LPO) products and fatal reactive oxygen species (ROS) derived from iron accumulation. Intracellular iron overload results in redundant ROS, marked with elevated oxidizing species output by the Fenton reaction and decline of antioxidant defenses, including glutathione (GSH), superoxide dismutase (SOD), the glutathione peroxidase (GPx) enzyme system and cystine/glutamate antiporter system (system Xc-), underlying the similar mechanisms between ferroptosis and oxidative stress [Citation2]. Several key regulators such as glutathione peroxidase-4 (GPX4), solute carrier family 7 member 11 (SLC7A11/xCT), acyl-coenzyme A (CoA) synthetase long-chain family member 4 (ACSL4), lysophosphatidylcholine acyltransferase 3 (LPCAT3), prostaglandin-endoperoxide synthase 2 (PTGS2/COX-2), and nicotinamide adenine dinucleotide phosphate (NADPH) oxidase 1 (NOX1) play vital roles in the occurrence of ferroptosis [Citation3]. The currently used small molecules and drugs that induce ferroptosis mainly include the inhibition of system Xc- (erastin, sulfasalazine, and sorafenib) or GPX4 [RAS-selective lethal compounds 3 (RSL3), altretamine, ML162, ML210, DPI 7, DPI 10, FIN56] [Citation4]. Ferroptosis inhibitors including ferrostatin-1 (Fer-1), liproxstatin-1 (Lip-1) and deferoxamine (DFO) could function by inhibiting the accumulation of LPO and reducing intracellular iron [Citation2]. The fast-growing studies of ferroptosis have boosted a perspective for its usage in clinical therapeutics. As for the auditory system, some researchers have endeavored to illuminate the role of ferroptosis in cisplatin-induced or neomycin-induced ototoxicity [Citation5,Citation6]. The possible crosstalk between the role of ferroptosis in otitis media has also been elucidated, and decreased protein expression of tumor necrosis factor-α (TNF-α) was observed after DFO treatment [Citation7].
It was once thought that Hensen’s cells only played a role in supporting hair cells and stabilizing the three-dimensional structure of the organ of Corti. Some new characteristics of them have been gradually uncovered, including regulating hearing sensitivity and the cochlear partition’s stiffness, maintaining the inner ear lymph ion homeostasis, participating in the mechanical tuning of the cochlea, and facilitating the resolution of inflammatory responses in the inner ear [Citation8]. To the best of our knowledge, Hensen’s cells are the only supporting cells containing lipid droplets (LDs). After noise exposure, LDs are progressively hydrolyzed to produce free fatty acids (FFAs). However, a pivotal unanswered question is the function of LDs in Hensen’s cells and its significance for the organ of Corti as a whole.
A previous study found out that high concentrations of FFA could activate toll-like receptor 4 (TLR4)/NF-κB/interleukin 6 (IL-6) inflammatory signaling pathway by promoting the expression of Krüppel-like factor 7 (KLF7) in 3T3-L1 cells [Citation9]. Same results illustrating the participation of FFAs in inflammatory response were also observed in human umbilical vein endothelial cells (HUVECs) [Citation10] and HEK293 cells [Citation11]. Several studies also revealed the relation between ferroptosis and inflammation, where ferroptosis could induce TLR4 inflammatory responses through lipid damage-associated molecular patterns (DAMPs) [Citation12]. However, there is currently a significant paucity of knowledge regarding the underlying roles ferroptosis plays on the excessive FFA-induced ototoxicity. To help to fill this gap in knowledge, we first determined whether ferroptosis is involved in FFA-induced ototoxicity and aimed to investigate ferroptosis-dependent inflammatory response in auditory cells. Therein, the palmitate acid (PA) was utilized as a substitute for FFA.
Methods
HEI-OC1 cell line culture
House Ear Institute-Organ of Corti 1 (HEI-OC1) is a kind of immortalized cell line constructed by integrating the large T-antigen fragment of Simian virus 40 into the nucleus of mouse Corti’s organ progenitor cells for expression. It could express both cochlear hair cells and supporting cells markers, so has been commonly used in audiology research [Citation13]. The cell line was incubated in high-glucose Dulbecco’s modified Eagle’s medium (DMEM, 22320030, Gibco, Gaithersburg, MD, USA) supplemented with 10% fetal bovine serum (FBS, 16000044, Gibco, USA) under permissive conditions (33 °C, 10% CO2).
Free fatty acid/bovine serum albumin conjugates preparation
PA (P0500) and bovine serum albumin (BSA; A7030) were purchased from Sigma (Sigma-Aldrich, USA). PA-BSA conjugates were prepared on the basis of previous literature [Citation14]. The concentrations of PA used in this study ranged from physiological to pathophysiological conditions, including 0.1, 0.2, 0.25, 0.4, 0.5, 0.75, 1, 1.25, 1.5, 1.75, 2, and 3 mM. Then, the PA-BSA conjugates were incubated at 55 °C for 10 min. After cooling to room temperature (RT) and sterilizing by filtering using a 0.22 μm-diameter filter, the desired final concentrations were obtained by diluting in DMEM.
Drug treatments
The ferroptosis inducer RSL3 (S8155) and ferroptosis inhibitor Fer-1 (S7243) were purchased from Selleck Chemicals (Houston, TX, USA). The cell experiments were divided into one control group and three drug experimental groups. The cells in the control group (Ctr) did not receive any drug treatments. The cells in the PA stimulation group (PA) incubated overnight only with 0.75 mM PA. The drug treatment groups were pretreated with different concentrations of RSL3 (1, 2, 3, 5, and 10 μM) or Fer-1 (0.5, 2, 5, 8, 10, 15, 20, and 30 μM) two hours before 0.75 mM PA stimulation overnight. Both 5 μM of RSL3 and Fer-1 were determined for subsequent experiments. The experimental flow was manifested in .
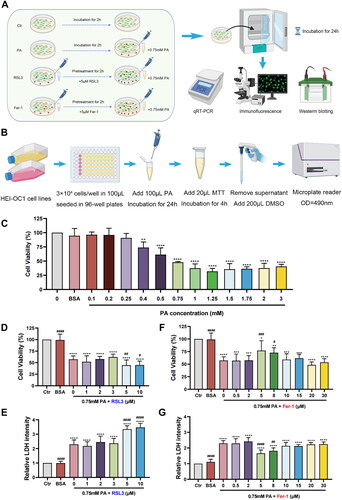
Figure 1. The influence of PA, ferroptosis inhibitor Fer-1, and ferroptosis inducer RSL3 on HEI-OC1 cell line. (A) The experimental flow of drug treatments. (B) The experimental flow of MTT assay. (C) Effects of different concentrations of PA on cell viability. The values are presented as means ± SD. n = 18 in each group. **p < .01, ****p < .0001, when compared to the Ctr group (0 mM PA). (D–E) Effects of 0.75mM PA cotreatment with different concentrations of RSL3 on cell viability (D) and LDH release (E). The values are presented as means ± SD. n = 12 in each group. **** p < .0001, when compared to the Ctr group; # p < .05, ##p < .01, ####p < .0001, when compared to the 0 μM RSL3 group. (F–G) Effects of 0.75mM PA cotreatment with different concentrations of Fer-1 on cell viability (F) and LDH release (G). The values are presented as means ± SD. n = 12 in each group. * p < .05, **p < .01, ***p < .001, **** p < .0001, when compared to the Ctr group; # p < .05, ## p < .01, ### p < .001, ####p < .0001, when compared to the 0 μM Fer-1 group.
Cell viability assay
Cell viability was determined by the 3- [4, 5-dimethylthiazol-2-yl]-2,5-dephenyl tetrazolium bromide (MTT; M2128, Sigma-Aldrich, USA). MTT was prepared as a 5 mg/mL stock solution in PBS (pH 7.2; PB2004Y, Haoyang Huake Biotechnology Co., Ltd., Tianjin, China) and filtered. The solution was stored at −20 °C and thawed at 4 °C before experiments. HEI-OC1 cells were seeded in 96-well plates in sextuplicate with 3 × 10⁴ cells/well in a 100 μL volume. After various concentrations of PA incubation for 24h, 20 μL of MTT solution was added to each well, and then the cells were incubated at 33 °C for 4 h. The supernatant was sucked away and replaced by 200 μL dimethylsulfoxide (DMSO; D806645, Macklin, China), and the plate was shaken slowly without light for 10 minutesutes. The absorbance was measured at 490 nm using a microplate reader (Spark 20 M, Tecan, Switzerland). The experimental flow of MTT assay was manifested in .
Lactase dehydrogenase release assay
Lactase dehydrogenase (LDH) release assay was detected by Cytotoxicity LDH Assay Kit (CK12, Dojindo Laboratory, Kumamoto, Japan) to measure cellular injury extents. HEI-OC1 cells were seeded overnight at the density of 2 × 10⁴ cells/well in 96-well plates. After different drug treatments, 100 μL working solution was added to each well and incubated for 30 min without light at RT. After adding 50 μL stop solution, the absorbance was estimated at 490 nm using a microplate reader (Spark 20 M, Tecan, Switzerland).
RNA extraction and quantitative real-time polymerase chain reaction analysis
A total of 4 × 10⁵ HEI-OC1 cells were seeded in 6-well plates. Total RNA was extracted using a RNeasy Mini Kit (74104, Qiagen, Dusseldorf, Germany) according to the manufacturer’s instructions. The extracted RNA was finally diluted to 100–500 ng/μL, and reverse transcribed to cDNA using PrimeScript™ RT reagent Kit with gDNA Eraser (RR047A, TaKaRa, Kusatsu, Japan). Quantitative real-time polymerase chain reaction (qRT-PCR) based on 2 × SYBR Green qPCR Master Mix (G3320, Servicebio, China) was performed using a Real-Time PCR system (CFX, Bio-Rad, USA). The quantitative primers used were listed in (Servicebio, China). The 2−ΔΔCt method was used to calculate the relative expression of the target gene [Citation15].
Table 1. Information of primers sequences.
Western blotting
HEI-OC1 cells were seeded at the density of 4 × 10⁵ cells/well in 6-well plates. Cells from the same treatment group in two wells were lysed with precooled RIPA lysis buffer (P0013B, Beyotime Biotech Inc., Shanghai, China) plus protease and phosphatase inhibitor cocktail (P1049, Beyotime, China) and phenylmethanesulfonyl fluoride (PMSF, ST506, Beyotime, China), and then synthesized into one sample. The total protein was quantified with a BCA Protein Assay Kit (23225, Thermo Scientific, Waltham, MA, USA). Added with 5× protein sample buffer (G2013, Servicebio, China), the protein was heated at 90 °C for 10 minutesutes. The protein samples were separated via 10% SDS–PAGE (G2003, Servicebio, China) and transferred to polyvinylidene fluoride membranes (PVDF, 0.45 μm pore diameter, IPVH00010, Merck Millipore Ltd., Darmstadt, Germany). The membranes were blocked in 8% fat-free milk powder (1:1000, G5002, Servicebio, China) for 4 h and probed with anti-GPX4 antibody (1:1000, ab125066, abcam, Cambridge, MA, USA), anti-SLC7A11 antibody (xCT, 1:1000, DF12509, Affinity Biosciences, Cincinnati, OH, USA) or anti-GAPDH antibody (1:2000, GB15002, Servicebio, China) overnight at 4 °C. The following day, the PVDF membranes were rinsed with TBST (T1081, Solarbio Science & Technology Co., Ltd., Beijing, China) three times for 5 min each, and then incubated in TBST with horseradish peroxidase (HRP)-conjugated goat anti-rabbit (1:5000, GB23303, Servicebio, China) or goat anti-mouse IgG (1:5000, GB25301, Servicebio, China) for 1 h at RT. The protein bands were detected using enhanced chemiluminescence (ECL) detection reagents (G2020, Servicebio, China) in a chemiluminescence apparatus (6100, CLINX Science Instruments, Shanghai, China).
Intracellular and mitochondrial ferric ion detection and reactive oxygen species measurement
FerroOrange (F374, Dojindo, Japan), Mito-FerroGreen (M489, Dojindo, Japan) and 2′,7′-dichlorodihydrofluorescein diacetate (DCFH-DA; C2938, Invitrogen, USA) were used according to the manufacturer’s instruction. A total of 8 × 10⁴ HEI-OC1 cells in a 200 μL volume were seeded on a dish for fluorescence imaging and cultured overnight under permissive conditions. A final working concentration of 1 μM FerroOrange, 5 μM Mito-FerroGreen, or 50 μM DCFH-DA was added for staining for 30 min at 37 °C without light after drug treatments. The staining results were acquired by a confocal microscope (LSM 980, Zeiss, Germany).
Luminex liquid suspension chip detection
Luminex liquid suspension chip detection was performed by Wayen Biotechnologies (Shanghai, China). The Bio-Plex Pro Mouse Cytokine Grp I Panel 23-plex (M60009RDPD, Bio-Rad Laboratories, Inc., Hercules, CA, USA) was used in conformity to the manufacturer’s instructions.
Immunofluorescence staining
HEI-OC1 cells were seeded under the same conditions as above. After drug treatments, the cells were soaked in turn in 4% PFA (SL1830, Coolaber, China) for 15 minutesutes, blocking buffer (12411, Cell Signaling, USA) for 1h, and anti-TLR4 antibody (ab13556, abcam, USA), anti-GPX4 antibody (ab125066, abcam, USA) and anti-IL-1β antibody (ab156791, abcam, USA), or anti-SLC7A11 antibody (DF12509, Affinity, USA) and anti-TNF-α antibody (ab1793, abcam, USA) overnight at 4 °C. Then, the cells were rinsed with 0.1 M PBS (PM5090, Coolaber, China) for three times with 10 min each, incubated with goat anti-rabbit 488 fluorescent secondary antibody (A-11034, Invitrogen, USA) or goat anti-mouse 647 fluorescent secondary antibody (A-21235, Invitrogen, USA) for 1 h at RT without light, and counterstained with DAPI (ZLI-9557, Zhongshan Golden Bridge, China) to label nuclei. The staining results were observed and captured by a confocal microscope (LSM 980, Zeiss, Germany).
Statistical analysis
The results were presented as means ± the standard deviation (SD). Significance levels were set as p values less than 0.05. GraphPad Prism 9.0 (GraphPad Software, La Jolla, CA, USA) and SPSS 23.0 (IBM Corporation, Armonk, NY, USA) were used for statistical analyses. Dunnett’s t-test was used to compare the experimental groups and the Ctr group or BSA group. Other data involved with more than two groups were analyzed by one-way analysis of variance (ANOVA). Statistical significance was set at p < .05.
Results
Free fatty acid induced cell death in HEI-OC1 cells
In order to validate the damage effects of PA to HEI-OC1 cell line, we elaborately designed the in vitro experiments. As is shown in , exposure to PA at different concentrations for 24 h resulted in a dose-dependent manner of changes in cell viability, identifying the cytotoxic effect of PA on HEI-OC1 cells. The damage of PA to cells started from 0.4 mM and continued to 3 mM. Based on these results, we ascertained 0.75 mM PA as an optimal concentration for the subsequent experiments, as the viability was significantly reduced to near 50% when compared to the Ctr group (0 mM, p < .0001).
Ferroptosis is involved in PA-induced cell damage
To determine if ferroptosis is involved in PA-induced outer hair cells damage, HEI-OC1 cells were pre-treated with increasing concentrations of ferroptosis inhibitor Fer-1 and inducer RSL3 for 2 h, followed by cotreatment with 0.75 mM PA for 24 h. As is shown in , the cytotoxic effects of 0.75 mM PA (cell viability = 57.32 ± 7.36; LDH release = 2.30 ± 0.30) were exacerbated with 5 μM (cell viability = 44.48 ± 11.36, p < .01; LDH release = 3.35 ± 0.24, p < .0001) and 10 μM RSL3 (cell viability= 44.88 ± 8.65, p < .05; LDH release = 3.47 ± 0.29, p < .0001). Besides, as is shown in , the cytotoxic effects of 0.75 mM PA (cell viability = 57.07 ± 6.60; LDH release = 2.30 ± 0.18) were abrogated after coculture with 5 μM (cell viability = 77.04 ± 19.55, p < .001; LDH release = 1.66 ± 0.21, p < .0001) and 8 μM Fer-1 (cell viability= 72.76 ± 9.87, p < .05; LDH release = 1.82 ± 0.19, p < .01). Accordingly, we chose 5 μM RSL3 and 5 μM Fer-1 to intervene in PA-induced cell cytotoxicity.
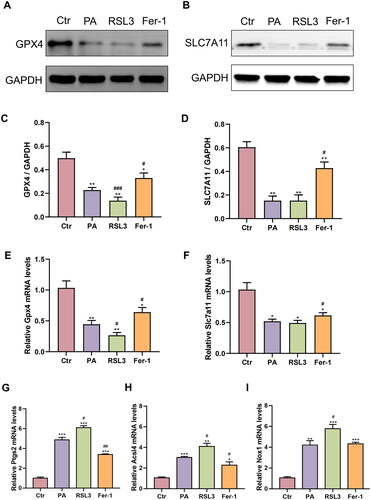
The results of Western blotting and qRT-PCR further elucidated the content changes of ferroptosis key factors. As is shown in , after PA treatment, the protein expression of GPX4 and SLC7A11 showed a synchronized downregulated trend (Ctr: GPX4/GAPDH = 0.50 ± 0.05, SLC7A11/GAPDH = 0.61 ± 0.05. PA: GPX4/GAPDH= 0.23 ± 0.02, p < .01; SLC7A11/GAPDH = 0.15 ± 0.04, p < .01). When compared to the PA group, RSL3 cotreatment significantly reduce GPX4 protein expression (0.14 ± 0.03, p < .001), while it had no effect on SLC7A11 protein expression (0.15 ± 0.05, p > 0.05). However, Fer-1 cotreatment reversed the downward trend, as evidenced by the increased protein levels of GPX4 (0.33 ± 0.04, p < .05) and SLC7A11 (0.43 ± 0.05, p < .05). At the transcriptional level (), mRNA expression levels of GPX4 and SLC7A11 in HEI-OC1 cells were significantly decreased after 0.75 mM PA treatment (Ctr:GPX4 = 1.04 ± 0.11, SLC7A11 = 1.04 ± 0.11. PA: GPX4 = 0.45 ± 0.06, p < .01; SLC7A11 = 0.52 ± 0.04, p < .05). The mRNA level of another three key factors of ferroptosis including PTGS2, ACSL4 and NOX1 () were upregulated after PA treatment (Ctr: PTGS2 = 1.00 ± 0.12, ACSL4 = 1.06 ± 0.09, NOX1 = 1.05 ± 0.11. PA: PTGS2 = 4.87 ± 0.25, p < .001; ACSL4 = 3.02 ± 0.11, p < .001; NOX1 = 4.21 ± 0.43, p < .01). After RSL3 cotreatment, GPX4 mRNA expression (0.27 ± 0.05, p < .05) was further downregulated, and PTGS2 (6.10 ± 0.20, p < .05), ACSL4 (4.10 ± 0.30, p < .05) and NOX1 mRNA expressions (5.78 ± 0.41, p < .05) were upregulated, while SLC7A11 mRNA expression was not significantly affected (0.49 ± 0.04, p > 0.05) when compared to the PA group. However, apart from NOX1 (4.33 ± 0.15, p > 0.05), the upregulation of PTGS2 (3.39 ± 0.07, p < .01) and ACSL4 (2.28 ± 0.33, p < .05) mRNA expressions and the downregulation of GPX4 (0.64 ± 0.08, p < .05) and SLC7A11 (0.62 ± 0.05, p < .05) mRNA expressions were mitigated by Fer-1 cotreatment when compared to the PA group. Combined the aforementioned results, we concluded that ferroptosis is involved in PA-induced cell damage.
Figure 2. The effects of PA, RSL3 and Fer-1 on the mRNA and protein expressions of ferroptosis key factors. (A,B) Representative images of original western blotting analysis of GPX4 (A) and SLC7A11 (B) protein expression. (C,D) Summarized data of GPX4 (C) and SLC7A11 (D) protein abundance relative to GAPDH. The values are presented as means ± SD. n = 4 in each group. * p < .05, ** p < .01, when compared to the Ctr group; # p < .05, ### p < .001, when compared to the PA group. (E–I) The mRNA expression levels of GPX4 (E), SLC7A11 (F), PTGS2 (G), ACSL4 (H), and NOX1 (I) after drug treatment. The values are presented as means ± SD. n = 4 in each group. * p < .05, ** p < .01, *** p < .001, when compared to the Ctr group; # p < .05, ## p < .01, when compared to the PA group.
Inhibition of ferroptosis alleviates iron overload and ROS accumulation after PA treatment
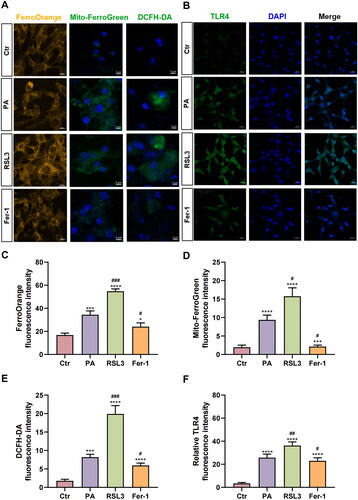
We measured the level of intracellular Fe2+ and mitochondrial Fe2+ by using FerroOrange and Mito-FerroGreen probes. After 0.75 mM PA treatment overnight, obvious intracellular and mitochondrial Fe2+ accumulation was observed when compared to the Ctr group (Ctr: FerroOrange = 16.84 ± 1.66, Mito-FerroGreen = 1.96 ± 0.57; PA: FerroOrange= 34.43 ± 3.36, p < .001; Mito-FerroGreen = 9.38 ± 1.29, p < .0001). RSL3 treatment (FerroOrange = 54.74 ± 2.12, p < .001; Mito-FerroGreen = 15.75 ± 2.30, p < .05) could significantly enhance while Fer-1 treatment (FerroOrange = 24.13 ± 3.23, p < .001; Mito-FerroGreen = 2.14 ± 0.40, p < .05) could ameliorate Fe2+ accumulation when compared to the PA group (). The production of total ROS was measured using DCFH-DA reagent (). In agreement with changes of iron overload, Fer-1 cotreatment could abolish the ROS level induced by PA treatment (Ctr = 1.78 ± 0.42, PA = 8.20 ± 0.78, RSL3 = 19.9 ± 2.26, Fer-1 = 5.95 ± 0.64; RSL3 vs PA, p < .001; Fer-1 vs PA, p < .05).
Figure 3. The effects of PA, RSL3 and Fer-1 on iron metabolism, ROS and the inflammatory factors expression. (A) The staining results of intracellular and mitochondrial Fe2+ and ROS of the four groups, manifested by FerroOrange (yellow), Mito-FerroGreen (green), DCFH-DA (green) and DAPI (blue). Scale bar = 10 μm (FerroOrange staining) or 5 μm (Mito-FerroGreen and DCFH-DA staining). (B) The immunofluorescence staining results of inflammatory factors TLR4 of the four groups. Green stands for TLR4 expression, while blue stands for DAPI. Scale bar = 20 μm. (C–F) Summarized data of immunofluorescence staining of FerroOrange (C), Mito-FerroGreen (D), DCFH-DA (E) and TLR4 (F) in the four groups. The values are presented as means ± SD. n = 6 in each group. * p < .05, *** p < .001, **** p < .0001, when compared to the Ctr group; # p < .05, ## p < .01, ### p < .001, when compared to the PA group.
Inhibition of ferroptosis reduced inflammatory response of PA-induced cell damage
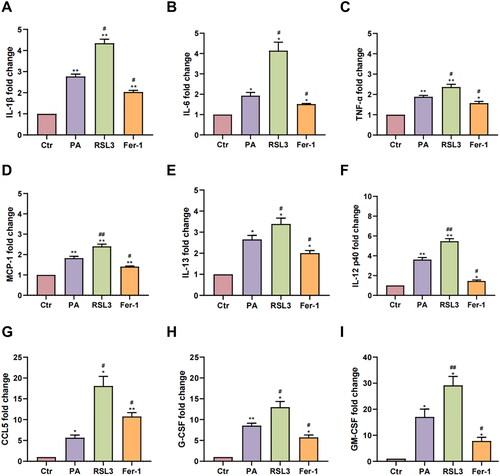
Immunofluorescence staining results of TLR4 (), one regulator of the inflammatory signaling pathway, revealed that 0.75 mM PA treatment upregulated TLR4 protein expression (Ctr = 3.42 ± 0.79, PA = 25.76 ± 0.78, p < .0001). RSL3 cotreatment further increased the expression (36.24 ± 3.20, p < .01), while Fer-1 cotreatment reduced its expression (22.97 ± 2.65, p < .05) when compared to the PA group, indicating that inducing ferroptosis may trigger inflammation response. Besides, Luminex liquid suspension chip was used to evaluate 22 kinds of inflammatory factor in cell supernatants ( and Figure S1). Therein, a total of 9 inflammatory factors were observed with significant contents changes, that is, interleukin 1β (IL-1β), IL-6, TNF-α, monocyte chemoattractant protein-1 (MCP-1), interleukin 13 (IL-13), interleukin 12 p40 (IL-12 p40), chemokine ligand 5 (CCL5/RANTES), granulocyte colony stimulating factor (G-CSF), and granulocyte-macrophage colony-stimulating factor (GM-CSF). Compared to the Ctr group (1.00 ± 0.00), these inflammatory factor contents were significantly increased after PA treatment (IL-1β = 2.77 ± 0.12, p < .01, ; IL-6 = 1.93 ± 0.16, p < .05, ; TNF-α = 1.89 ± 0.07, p < .01, ; MCP-1 = 1.83 ± 0.09, p < .01, ; IL-13 = 2.66 ± 0.19, p < .05, ; IL-12 p40 = 3.61 ± 0.21, p < .01, ; CCL5 = 5.66 ± 0.65, p < .05, ; G-CSF = 8.54 ± 0.59, p < .01, ; GM-CSF = 17.06 ± 3.00, p < .05, ). These increases were significantly aggravated by RSL3 cotreatment (IL-1β = 4.34 ± 0.19, p < .05; IL-6 = 4.14 ± 0.42, p < .05; TNF-α = 2.37 ± 0.14, p < .05; MCP-1 = 2.40 ± 0.11, p < .01; IL-13 = 3.39 ± 0.28, p < .05; IL-12 p40 = 5.47 ± 0.27, p < .01; CCL5 = 18.07 ± 2.32, p < .05; G-CSF = 12.96 ± 1.39, p < .05; GM-CSF = 29.15 ± 3.44, p < .01). In contrast, their contents were significantly reduced in the Fer-1 group compared with the PA group (IL-1β = 2.04 ± 0.08, p < .05; IL-6 = 1.52 ± 0.03, p < .05; TNF-α = 1.57 ± 0.09, p < .05; MCP-1 = 1.41 ± 0.03, p < .05; IL-13 = 2.01 ± 0.12, p < .05; IL-12 p40 = 1.45 ± 0.10, p < .05; CCL5 = 10.77 ± 0.91, p < .05; G-CSF = 5.72 ± 0.57, p < .05; GM-CSF = 7.81 ± 1.40, p < .05).
Figure 4. The expression levels of inflammatory factors. (A–I) The expressions of IL-1β (A), IL-6 (B), TNF-α (C), MCP-1 (D), IL-13 (E), IL-12 p40 (F), CCL5 (G), G-CSF (H), and GM-CSF (I) after drug treatments. The values are presented as means ± SD. n = 3 in each group. * p < .05, ** p < .01, when compared to the Ctr group; # p < .05, ## p < .01, when compared to the PA group.
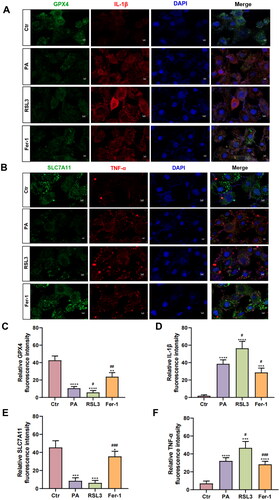
Besides, co-expressed immunofluorescence staining of ferroptosis key factor and inflammatory factor further identified the relationship between ferroptosis and inflammation (). RSL3 could downregulate the protein expression of GPX4 (PA = 10.60 ± 1.89, RSL3 = 5.77 ± 2.21, p < .05, ). Meanwhile, the expression of IL-1β (PA = 38.58 ± 4.64, RSL3 = 56.35 ± 7.99, p < .05, ) and TNF-α (PA = 32.10 ± 3.74, RSL3 = 46.79 ± 7.12, p < .001, ) were triggered. Likewise, Fer-1 could ameliorate the expression of these inflammatory factors when compared to the PA group (GPX4 = 23.80 ± 4.68, p < .01, ; IL-1β = 28.64 ± 5.07, p < .05 ; SLC7A11 = 35.58 ± 5.75, p < .001, ; TNF-α = 28.33 ± 3.47, p < .001, ).
Figure 5. The immunofluorescence staining results of ferroptosis key factor and inflammatory factors. (A) The immunofluorescence staining results of GPX4 (green) and IL-1β (red). Blue stands for DAPI. Scale bar = 5 μm. (B) The immunofluorescence staining results of SLC7A11 (green) and TNF-α (red). Blue stands for DAPI. Scale bar = 5 μm. (C–F) Summarized data of immunofluorescence staining of GPX4 (C), IL-1β (D), SLC7A11 (E), and TNF-α (F) in the four groups. The values are presented as means ± SD. n = 6 in each group. * p < .05, ** p < .01, *** p < .001, **** p < .0001, when compared to the Ctr group; # p < .05, ## p < .01, ### p < .001, when compared to the PA group.
Taken together, these results hinted that ferroptosis-dependent inflammatory response participates in PA-induced cell damage.
Discussion
In this study, we constructed an in vitro cell line model to preliminarily elucidate the influence of PA on HEI-OC1 cell line and the latent mechanisms. We found out that PA stimulation could cause cytotoxic damage to HEI-OC1 cells in a dose-dependent manner, the expression of inflammatory factors such as TLR4 and several cytokines to increase, and ferroptosis-related factors such as GPX4 and SLC7A11 to decrease. Ferroptosis inducer RSL3 and inhibitor Fer-1 could aggravate or mitigate these injuries. We concluded that ferroptosis inhibition could alleviate the PA-induced inflammatory injuries via inactivation of TLR4 signaling pathway in HEI-OC1 cell line.
Ferroptosis is mainly caused by the imbalance between the production and degradation of lipid ROS in the cell. Critical to the homeostasis of lipid oxidation-reduction reaction are system Xc- and GPX4 pathway. System Xc- is a heterodimer comprising of a light chain subunit SLC7A11 and a heavy chain subunit SLC3A2 [Citation16]. SLC7A11 functions as a cystine/glutamate antiporter to transport extracellular cystine into the cytosol for GSH biosynthesis and antioxidant defense, which serves as a promising therapeutic target in multiple cancer therapy [Citation17]. GPX4 belongs to the family of GPxs. It can utilize GSH as the reductant to directly eliminate toxic lipid hydroperoxides into lipid alcohols. The inhibition of GPX4 have been proposed to trigger ferroptosis in multiple diseases, including acute renal failure, osteoarthritis, gastric cancer and stroke. In this study, PA treatment decreased GPX4 and SLC7A11 expression at both mRNA and protein level, while ferroptosis inhibitors Fer-1 restored PA-blocked GPX4 and SLC7A11 expression, suggesting that loss of GPX4/SLC7A11-mediated antioxidant defense is implicated in PA-induced ferroptosis in HEI-OC1 cells. Besides, ACSL4 is a central enzyme ligating coenzyme A to polyunsaturated fatty acids (PUFA) to trigger phospholipids synthesis [Citation18]. PTGS2 encodes COX-2, which is the rate-limiting enzyme for the conversion of arachidonic acid (AA) to prostaglandins (PGs), and responsible for amplifying inflammation through recruitment of macrophages [Citation2]. Immune cell-mediated inflammation induced by NOX1 elicited the release of ROS, which is also regarded as ferroptosis-related molecules. Our results showed that these ferroptosis-related factors also participate in PA-induced ferroptosis, and upregulation of ACSL4 and PTGS2 mRNA were markedly prevented by Fer-1 treatment.
Iron abundance is an essential indicator for monitoring ferroptosis [Citation4]. The production of iron-mediated ROS mediated by the Fenton reaction, referred to the oxidation from Fe2+ to Fe3+ through reaction with H2O2, or the oxidation of iron-binding enzymes during the absorption, storage, utilization and outflow of iron metabolism may elicit LPO, and ultimately result in ferroptosis. For iron overburden validation, we utilized the FerroOrange staining to evaluate intracellular Fe2+ and the Mito-FerroGreen staining to reflect mitochondrial Fe2+. We found out that PA treatment induced a significant increase in both intracellular and mitochondrial Fe2+ level in HEI-OC1 cells, which could be remarkably reversed by Fer-1 cotreatment or enhanced by RSL3 cotreatment. Accumulation of ROS is another hallmark of ferroptosis [Citation19]. The production of ROS during iron metabolism causes LPO. We observed obvious production of ROS in HEI-OC1 cells after PA treatment, which was also influenced by inhibition or inducement of ferroptosis. These results furtherly demonstrated that ferroptosis is involved in PA-induced cell damage.
It is widely believed that TLR4 plays a pivotal role in noise-induced inner ear inflammation, and the activation of TLR4 could trigger downstream expression of inflammatory cytokines including TNF-α, IL-1β, and IL-6 [Citation11]. To the best of our knowledge, the relationship between TLR4 and ferroptosis in noise or FFA induced inner ear damage remains elusive. However, multiple metabolic enzymes during ferroptosis have emerged as essential regulators of crucial cellular processes in the context of inflammation. Studies on other disease models including ischemia-reperfusion injury, hippocampal neuron injury, nonalcoholic steatohepatitis, and sepsis-induced cardiac dysfunction have elucidated that ferroptosis may be an upstream event in the TLR4 inflammatory response [Citation20]. Based on our results of cell supernatant contents and protein expression of inflammatory factors, we uncovered ferroptosis-dependent TLR4 inflammatory response is involved in PA-induced HEI-OC1 cell loss. The expressions of IL-1β, IL-6, TNF-α, MCP-1, IL-13, IL-12 p40, CCL5, G-CSF, and GM-CSF were increased following PA treatment, which were further upregulated upon treatment with RSL3 and downregulated after Fer-1 cotreatment. Collectively, Fer-1 alleviated inflammatory responses at least partially via TLR4 signaling pathway, hinting that ferroptosis inhibition suppresses the subsequent immune cell infiltration and inflammatory response. Our findings also suggested that ferroptosis inhibitor Fer-1 might serve as a potential otoprotectant for the protection of NIHL.
Of note, these results were conducted based on cell line models, which was an initial exploration in this field. First and foremost, further in vivo animal models are required to verify the role of ferroptosis in NIHL and the otoprotective effects of Fer-1. Besides, some techniques such as RNA-silencing or knock-in/out gene editing would be conducive in mining underlying exact mechanisms.
Supplemental Material
Download TIFF Image (1.2 MB)Acknowledgements
HEI-OC1 auditory cells were kindly provided by Prof. Xi Shi from Artificial Auditory Laboratory of Jiangsu Province, Xuzhou Medical University. The original sources to draw experimental flows were obtained from BioRender.com.
Disclosure statement
All authors approved the final manuscript and the submission to this journal. No potential conflict of interest was reported by the author(s).
Data availability statement
Data generated or analyzed during this study are available from the corresponding author on request.
Additional information
Funding
References
- Dixon SJ, Lemberg KM, Lamprecht MR, et al. Ferroptosis: an iron-dependent form of nonapoptotic cell death. Cell. 2012;149(5):1060–1072.
- Xie Y, Hou W, Song X, et al. Ferroptosis: process and function. Cell Death Differ. 2016;23(3):369–379.
- Stockwell BR, Friedmann Angeli JP, Bayir H, et al. Ferroptosis: a regulated cell death nexus linking metabolism, redox biology, and disease. Cell. 2017;171(2):273–285.
- Yan HF, Zou T, Tuo QZ, et al. Ferroptosis: mechanisms and links with diseases. Signal Transduct Target Ther. 2021;6(1):49.
- Wang W, Ma P, Gao W, et al. Nrf2 knockout affected the ferroptosis signaling pathway against Cisplatin-Induced hair Cell-Like HEI-OC1 cell death. Oxid Med Cell Longev. 2022;2022:2210733.
- Zheng Z, Tang D, Zhao L, et al. Liproxstatin-1 protects hair Cell-Like HEI-OC1 cells and cochlear hair cells against neomycin ototoxicity. Oxid Med Cell Longev. 2020;2020:1782659.
- Yan B, Xie D, Wu Y, et al. Ferroptosis is involved in PGPS-induced otitis media in C57BL/6 mice. Cell Death Discov. 2022;8(1):217.
- Kalinec F, Webster P, Maricle A, et al. Glucocorticoid-stimulated, transcription-independent release of annexin A1 by cochlear hensen cells. Br J Pharmacol. 2009;158(7):1820–1834.
- Zhang M, Wang C, Wu J, et al. The effect and mechanism of KLF7 in the TLR4/NF-kappaB/IL-6 inflammatory signal pathway of adipocytes. Mediators Inflamm. 2018;2018:1756494.
- Chen L, Yu CX, Song B, et al. Free fatty acids mediates human umbilical vein endothelial cells inflammation through toll-like receptor-4. Eur Rev Med Pharmacol Sci. 2018;22(8):2421–2431.
- Degirmenci I, Ozbayer C, Kebapci MN, et al. Common variants of genes encoding TLR4 and TLR4 pathway members TIRAP and IRAK1 are effective on MCP1, IL6, IL1beta, and TNFalpha levels in type 2 diabetes and insulin resistance. Inflamm Res. 2019;68(9):801–814.
- Guerrero-Hue M, Garcia-Caballero C, Palomino-Antolin A, et al. Curcumin reduces renal damage associated with rhabdomyolysis by decreasing ferroptosis-mediated cell death. Faseb J. 2019;33(8):8961–8975.
- Kalinec G, Thein P, Park C, et al. HEI-OC1 cells as a model for investigating drug cytotoxicity. Hear Res. 2016;335:105–117.
- Kim S, Kim C, Park S. Mdivi-1 protects adult rat hippocampal neural stem cells against Palmitate-Induced oxidative stress and apoptosis. IJMS. 2017;18(9):1947.
- Chen XM, Liu YH, Ji SF, et al. Protective effect of ginsenoside Rd on military aviation noise-induced cochlear hair cell damage in Guinea pigs. Environ Sci Pollut Res Int. 2023;30(9):23965–23981.
- Koppula P, Zhuang L, Gan B. Cystine transporter SLC7A11/xCT in cancer: ferroptosis, nutrient dependency, and cancer therapy. Protein Cell. 2021;12(8):599–620.
- Zhang Y, Guo S, Wang S, et al. LncRNA OIP5-AS1 inhibits ferroptosis in prostate cancer with long-term cadmium exposure through miR-128-3p/SLC7A11 signaling. Ecotoxicol Environ Saf. 2021;220:112376.
- Conrad M, Pratt DA. The chemical basis of ferroptosis. Nat Chem Biol. 2019;15(12):1137–1147.
- Chu J, Liu CX, Song R, et al. Ferrostatin-1 protects HT-22 cells from oxidative toxicity. Neural Regen Res. 2020;15(3):528–536.
- Zhu K, Zhu X, Sun S, et al. Inhibition of TLR4 prevents hippocampal hypoxic-ischemic injury by regulating ferroptosis in neonatal rats. Exp Neurol. 2021;345:113828.