
Abstract
Oxidative stress can lead to tissue damage in the body, resulting in conditions that may lead to heart failure. Carbonyl proteins and malondialdehyde are common markers for determining oxidative stress. In this study, a high-performance liquid chromatography with ultraviolet‐visible (HPLC–UV–Vis) method was developed for both carbonyl proteins and malondialdehyde and compared with common spectrophotometric methods. The HPLC–UV–Vis method for determining carbonyl proteins showed a linear correlation in a range of 0.05–1.6 µg.mL−1 (correlation coefficient: 0.9939). The limits of detection and quantitation were determined to be 1.7 and 5.1 pmol on-column, respectively. The HPLC–UV–Vis method for malondialdehyde exhibited a linear correlation in the range of 0.04–13.6 µg.mL−1 (correlation coefficient: 0.9982) with limits of detection and quantitation of 1.5 and 4.5 pmol on-column, respectively. As a proof of concept, the applicability of the methods for both marker substances was investigated in chicken heart tissue as a complex matrix sample. To simulate oxidative stress, the tissue was treated with hydrogen peroxide as the oxidizing agent. Samples prepared with hydrogen peroxide showed increased carbonyl protein and malondialdehyde levels when compared to non-oxidized samples and samples treated additionally with the antioxidant Trolox. Regarding oxidative stress, similar results were achieved when compared with common spectrophotometric methods. However, HPLC–UV–Vis presented higher reproducibility and accuracy. The developed methods for both markers enable rapid and simple investigation of possible antioxidant effects on tissue samples.
Introduction
Reactive oxygen and nitrogen species (ROS and RNS) are mainly involved in oxidative stress effects. They are able to cause genotoxic damage, cell dysfunction or inactivation of enzymes by oxidizing structures such as proteins, lipids, and DNA, resulting in tissue damage (Han et al. Citation2014; Rjiba-Touati et al. Citation2016). Even though ROS and RNS show mediation effects at a physiological level, their excess leads to cell structure oxidation (Zhou et al. Citation2015).
Oxidative stress is defined as an imbalance between free radicals and antioxidants. The latter counteract the radicals under physiological conditions (Betteridge Citation2000). Due to the resulting tissue damage caused by high radical levels, diseases like diabetes (Oberley Citation1988; Baynes Citation1991), Alzheimer (Selkoe Citation2001; Sultana et al. Citation2013) and heart failure (Giordano Citation2005; Tsutsui et al. Citation2011; Pani et al. Citation2015) can develop.
For the investigation of oxidative stress and its resulting effects on a molecular level, there are approved markers. The most common in tissue are carbonyl proteins as markers for protein oxidation and malondialdehyde as markers for lipid peroxidation (Venardos et al. Citation2004).
Malondialdehyde is mainly measured spectrophotometrically as a thiobarbituric acid derivative and determined applying a molar extinction coefficient of 1.56 × 10⁵/M/cm for the chromophore (Pikul and Leszczynski Citation1986; Noeman et al. Citation2011; Olszewska-Słonina et al. Citation2011; Rjiba-Touati et al. Citation2016). In addition, there are different high-performance liquid chromatography methods with ultraviolet–visible (HPLC–UV–Vis) detection to determine malondialdehyde in body fluids and tissue by using 2,4-dinitrophenylhydrazine or thiobarbituric acid as reagent (Cini and Moretti Citation1995; Khoschsorur et al. Citation2000; Sim et al. Citation2003; Ying et al. Citation2008). Carbonyl proteins are usually determined via a spectrophotometric method by using 2,4-dinitrophenylhydrazine for derivatization and its molar extinction coefficient of 22.0 mM−1/cm for calculation (Cini and Moretti Citation1995; Noeman et al. Citation2011; Mesquita et al. Citation2014; Rjiba-Touati et al. Citation2016). However, for carbonyl protein quantification in tissue, no HPLC–UV–Vis method at all was found in literature. There are HPLC–UV–Vis methods existing only for the detection of simple aldehydes and ketones without applications in complex matrices or tissue (Barth et al. Citation1991; Wang et al. Citation2009).
Additionally, the measurements identified in literature on carbonyl protein and malondialdehyde detection were carried out in different tissues (heart, kidney, liver, blood) and the results were calculated in different units. Thus, these methods were difficult to compare.
The aim of this work was to develop an HPLC–UV–Vis method for both carbonyl protein and malondialdehyde determination in tissue and in further consequence to compare it with common spectrophotometric methods. For these investigations, heart tissue was chosen. The simulation of oxidative stress was performed by applying hydrogen peroxide. This imitation of ROS was carried out before with bovine serum albumin (Adams et al. Citation2001; Mesquita et al. Citation2014) for carbonyl proteins and with human cells for malondialdehyde analysis (Rác et al. Citation2015). As the counter actor of this oxidant, the antioxidative vitamin E analog Trolox was applied in order to test a possible antioxidative effect in tissue samples. For better comparison, the methods were optimized so that the same samples were applied for both spectrophotometric and HPLC–UV–Vis determination. For all methods, the analytical parameters were investigated and all results were calculated in nmol.g−1 tissue. Finally, the methods were compared considering outcome, reproducibility, accuracy and linearity.
Experimental
Materials and reagents
All chemicals and reagents were of analytical grade and were applied without further purification.
Ethanol, ammonium acetate, acetonitrile, 1-butanol, HPLC-grade water, hydrogen peroxide and hydrochloride acid were obtained from Merck (Darmstadt, Germany). HPLC-grade water was used during all experiments. 2-Thiobarbituric acid, butylated hydroxytoluene, ethyl acetate, trichloroacetic acid solution, 2,4-dinitrophenylhydrazine, malondialdehyde tetra-butylammonium salt, guanidine-hydrochloride, tris(hydroxymethyl)aminomethane (Tris) and 6-hydroxy-2,5,7,8,-tetramethylchromane-2-carboxylic acid (Trolox) were obtained from Sigma-Aldrich (Vienna, Austria). NaCl, KCl, KH2PO4, MgSO4, CaCl2, NaHCO3 and dextrose were obtained from Roth (Karlsruhe, Germany). Chicken hearts were purchased at a local supermarket.
Instrumentation
Spectrophotometric analysis was carried out with a Shimadzu UV-1800 spectrophotometer. For HPLC analysis, an Agilent Technologies 1260 Infinity Quat Pump VL, a Merck-Hitachi LaChrom L-7400 UV-detector and a LiChroCart RP-18 endcapped (5 µm) column (250-4) were used. The mobile phase was composed of 100 mM ammonium acetate buffer and acetonitrile at a ratio of 50 + 50 (v/v) at an applied flow of 1 mL.min−1. Samples were injected via a 100 µL loop. The detection wavelength was set to 370 nm for investigation of carbonyl protein samples and to 532 nm for malondialdehyde samples.
For evaluation of the peak areas, the Agilent ChemStation software was used. 2,4-Dinitrophenylhydrazine in the range of 0.05–1.6 µg.mL−1 and malondialdehyde in the range of 0.04–13.6 µg.mL−1 were determined by using six concentrations. Each concentration was measured twice on three different days (n = 6) to obtain the calibration plot and accuracy. Limits of detection and quantitation were calculated at signal-to-noise ratios of 3:1 and 9:1, respectively.
To achieve accurate determination, external standards were freshly prepared daily and investigated. The results were calculated via 2,4-dinitrophenylhydrazine and malondialdehyde calibration plots in nmol.g−1 wet tissue. For better comparison, basal values were set as 100% and oxidized values were calculated as percentages compared to the basal values.
Preparation of incubation solutions
The heart tissue was incubated with water, Krebs–Ringer solution or Trolox, which was mixed with either water for basal values or hydrogen peroxide for oxidized values 1 + 1 (v/v). Krebs–Ringer stock solution was prepared with 2.37 M NaCl, 0.094 M KCl, 0.024 M KH2PO4, 0.023 M MgSO4 and 0.05 M CaCl2. The final used Krebs–Ringer solution was composed of 100 mL Krebs–Ringer stock solution, 0.05 M NaHCO3 and 0.023 M dextrose, diluted with water to 2 L.
Trolox was used at the concentration of 3 mM in water. The hydrogen peroxide solution was diluted to 10% from 30%. The final concentration of hydrogen peroxide in the applied mixtures was 5%. All solutions were filtered through a 0.45 µm membrane and stored at 4 °C.
Preparation of heart tissue
Chicken hearts were sliced into pieces (about 0.5 cm) with a razor blade. Visible blood vessels and conjunctive tissue were not used. To minimize effects through the different surface of the tissue, mixtures of all pieces were applied for each experiment.
About 2 g of the heart pieces were stored for 60 min, each in 10 mL of one of the different solutions described above. Then the solutions were decanted and the tissue was placed in 10 mL water for 5 min in order to avoid solvent residues on the tissue. This washing step was repeated. For homogenization, the hearts were frozen in liquid nitrogen and pestled afterwards. The final powdery tissue was placed in Eppendorf tubes in 100 mg quantities and stored at –20 °C. Before starting the derivatization, the pestled heart tissue was mixed with 1 mL Tris buffer (10 mM, pH 7.4 with hydrochloric acid), vortexed and centrifuged with 6500 rpm at 4 °C for 30 min. The supernatant was used for all further work.
Analysis of lipid peroxidation
Two hundred microliters of supernatant were mixed with 200 µL 0.05% butylated hydroxytoluene in Tris-HCl (10 mM, pH 7.4) and vortexed. Afterwards, 500 µL 10 mM thiobarbituric acid in 0.5 M HCl were added. In case of blank values, only 0.5 M HCl was used. The mixture was vortexed and allowed to react at 80 °C in a water bath. After 60 min, the samples were placed on ice for 10 min and malondialdehyde was extracted with 1 mL butanol. After vigorous vortexing, the emulsion was separated by centrifugation. The butanol phases of both sample and blank values were investigated in the spectrophotometer at 532 nm, applying pure butanol as the background. For calculations, the blank value was subtracted from the sample value. The same samples were injected into the HPLC system and analyzed using the parameters described above.
Analysis of carbonyl proteins
Two hundred microliters supernatant were mixed with 500 µL of 5 mM 2,4-dinitrophenylhydrazine in 2.5 M HCl. For blank values, 500 µL pure 2.5 M HCl were used instead of the 2,4-dinitrophenylhydrazine reagent. The mixture was allowed to react for 90 min in the dark at room temperature. Samples were vortexed every 20 min. Afterward, 1 mL of 20% trichloroacetic acid solution was added, the samples were put on ice for 10 min and then centrifuged for 20 min at 6500 rpm and 4 °C. The supernatant was decanted and the remaining pellet was washed with 1 mL of ethanol/ethyl acetate (1 + 1; v + v) and again centrifuged and decanted. This washing step was carried out three times to remove free 2,4-dinitrophenylhydrazine. The final pellet was dried with nitrogen and resolved in 1 mL of 6 M guanidine HCl overnight.
Spectrophotometric detection was carried out the next day at a wavelength of 370 nm. Pure 6 M guanidine HCl was applied as background. The blank value was subtracted from the sample value for calculations. The samples were injected into the HPLC system for analysis.
Results and discussion
Optimization of tissue preparation
The sample preparation was optimized considering homogenization, extraction and the applied amount of heart tissue. Final homogenization was accomplished by liquid nitrogen freezing and pestling. Furthermore, different extraction attempts were done with Tris buffer and KCl buffer each with 10 and 150 mM at room temperature and at 37 °C. The best results were achieved using 10 mM Tris buffer. No differences between temperatures were observed. Hence, extraction at room temperature was carried out in subsequent measurements.
The optimization was also done for the applied amount of pulverized heart tissue. 100, 200, and 500 mg were extracted with 1 mL Tris buffer and analyzed. Applying 100 mg led to the best evaluable peaks and showed the easiest practical handling. In further measurements, the heart tissue was prepared and stored in tubes in amounts of 100 mg each. The tissue sample of each tube was extracted with 1 mL 10 mM Tris buffer and used for one carbonyl protein and one malondialdehyde assay including blank values.
Optimization of the derivatization
Based on methods found in literature, the optimization was carried out considering single steps. For carbonyl protein analysis, the sample was mixed with the 2,4-dinitrophenylhydrazine reagent, precipitated with trichloroacetic acid solution, washed and afterwards the resulting pellet was redissolved with guanidine HCl. 2,4-Dinitrophenylhydrazine reagent was tested in 5 and 10 mM dissolved in 0.5 M HCl or 2.5 M HCl. The best solubility was achieved with 5 mM 2,4-dinitrophenylhydrazine in 2.5 M HCl. However, this solution showed stability problems. The application of a 2,4-dinitrophenylhydrazine solution led to significant lower results after 24 h. Therefore it was prepared freshly every day before performing the carbonyl protein assay.
Furthermore, the resolving time (10 min, 1 h, 5 h, and overnight) of the pellet in 1 mL of 6 M guanidine HCl was tested. The dissolution of the pellet overnight led to the best results with the best reproducibility.
For malondialdehyde analysis, the sample reacted with thiobarbituric acid and the chromophore was extracted with butanol. The thiobarbituric acid reagent was first used at a concentration of 120 mM in 0.5 M HCl. Due to solubility problems, different molarities of thiobarbituric acid were investigated. The concentration with the best stability and satisfactory results was 10 mM which was used in subsequent measurements.
The reaction of thiobarbituric acid with the heart tissue was carried out for one hour at room temperature, at 40 °C, and at 80 °C. Heating led to the highest amount of detectable product, but also to a blank value containing small peaks. In order to avoid this, butylated hydroxytoluene was applied against autooxidation as reported elsewhere (Pikul and Leszczynski Citation1986). The extraction of the adduct in the reaction mixture with n-butanol and cooling with ice after the reaction time of 1 h also led to better blank values. The best results were achieved using this approach.
HPLC–UV–Vis method development and optimization
The HPLC–UV–Vis method was developed and optimized in a way that allows application for both carbonyl protein and malondialdehyde quantification. Only the wavelength has to be altered from 370 nm for carbonyl proteins to 532 nm for the malondialdehyde measurement series for detection purposes.
Reversed-phase and HILIC columns were tested. The mobile phase was studied with different ratios of acetonitrile and water or acetonitrile and ammonium acetate buffer. The latter was applied at concentrations of 10, 50, and 100 mM. Additives such as 2% glacial acetic acid and 0.01%–0.1% trifluoroacetic acid were also examined. The pH value of the investigated mobile phases was varied from 3.7 to 6.9. The best results were achieved using the LiChroCart RP-18 endcapped (5 µm) column (250-4) and a mobile phase containing acetonitrile and 0.1 M ammonium acetate buffer at a ratio of 50 + 50 (v + v) without additives and a 100 µL loop. Both methods were validated with standard substances (2,4-dinitrophenylhydrazine and malondialdehyde). shows a summary of the optimized analytical parameters.
Table 1. Summary of the analytical parameters.
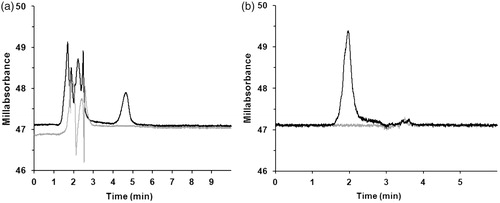
With this approach, carbonyl proteins were detected at a retention time of about 4.5 min and malondialdehyde at a retention time of about 2 min. shows the corresponding chromatograms of carbonyl proteins and malondialdehyde in heart tissue.
Figure 1. Typical heart tissue chromatograms of (a) carbonyl proteins in guanidine detected after reaction with 2,4-dinitrophenylhydrazine at 370 nm and (b) malondialdehyde in butanol detected after reaction with thiobarbituric acid at 532 nm including blanks (gray lines). The mobile phase was pH 6.9 100 mM ammonium acetate buffer and acetonitrile (1 + 1). The stationary phase was a reverse phase C18 column.
Determination of lipid peroxidation
Malondialdehyde analysis was carried out according to the formerly described method. Different hearts (n = 2) were used and the assay was repeated four times. The average detected concentration of malondialdehyde in non-oxidized tissue was 51.96 ± 2.27 nmol.g−1 tissue with spectrophotometric detection and 48.03 ± 1.34 nmol.g−1 tissue with HPLC–UV–Vis. These results agree well with values previously found in rat tissue (liver 22, heart 49, kidney 42 nmol.g−1 wet tissue) (Noeman et al. Citation2011). shows the increase of malondialdehyde in heart tissue compared to the non-oxidized levels as percentages when treated with 5% hydrogen peroxide.
Figure 2. Increase of malondialdehyde in heart tissue following treatment with 5% hydrogen peroxide.
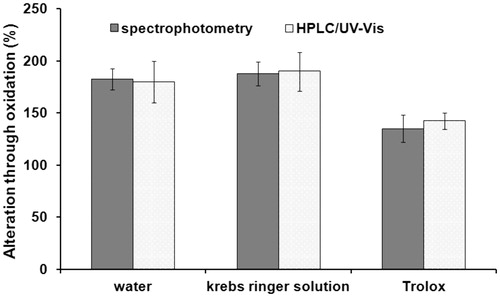
Both the water- and Krebs–Ringer solution-mixture showed an increase of malondialdehyde of about 180%. This indicates that an oxidation of tissue samples through the applied hydrogen peroxide occurred. On the other hand, the mixture with Trolox resulted only in an increase of 140%. The reduced increase shows the expected antioxidative effect of Trolox. Similar results were achieved by spectrophotometry and HPLC–UV–Vis.
Determination of carbonyl proteins
Carbonyl protein investigation was performed as described above. In these measurements, two hearts (same hearts as for malondialdehyde determination) were used and the assay was repeated four times. The mean concentration of carbonyl proteins in non-oxidized tissue was 25.12 ± 0.97 nmol.g−1 tissue with spectrophotometric detection and 1.53 ± 0.04 nmol.g−1 tissue with HPLC–UV–Vis. The detected values of carbonyl proteins were on average 10 times lower with HPLC–UV–Vis. This can be a hint to the higher specificity of the HPLC–UV–Vis method compared to spectrophotometry. Comparing these results with previous spectrophotometrically determined values in rat tissue (liver 20, heart 23, kidney 19 nmol.g−1 wet tissue), similar quantities are found (Noeman et al. Citation2011).
displays the increase of carbonyl proteins in heart tissue as percentages compared to the basal value of non-oxidized heart tissue.
Figure 3. Increase of carbonyl proteins in heart tissue following treatment with 5% hydrogen peroxide.
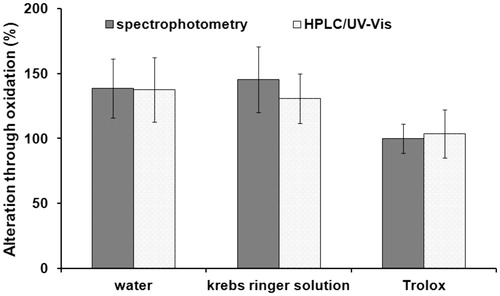
Again, water- and Krebs–Ringer solution-mixture did not block the oxidizing effect of hydrogen peroxide. Carbonyl proteins in this tissue were increased by approximately 140%. No oxidation took place in the tissue treated with Trolox-mixture. These carbonyl protein values remained near the basal value of 100%, even though they were exposed to an oxidative milieu. HPLC–UV–Vis and spectrophotometry showed similar results when comparing the increase as a percentage.
Conclusion
An HPLC–UV–Vis method was developed for the determination of carbonyl proteins and malondialdehyde in heart tissue. The determinations showed the expected increase through application of the oxidant hydrogen peroxide and a reduction of this effect through the utilization of the antioxidant Trolox. This confirms the applicability of the method in tissue for the investigation of possible antioxidative effects. Compared to common spectrophotometric methods, the HPLC–UV–Vis method showed similar results considering the increase of carbonyl proteins and malondialdehyde calculated as percentages. The results point out the accuracy of the developed HPLC–UV–Vis method. Overall, the results of this study indicate that there are some differences between the HPLC–UV–Vis and spectrophotometry methods for both markers. HPLC–UV–Vis has advantages considering reproducibility and accuracy, as well as a higher specificity, especially for carbonyl proteins. Additionally, this approach can be used as a reliable and simple tool for pre-investigation of the effect of antioxidants in tissue.
Disclosure statement
The authors declare that they have no conflicts of interest.
References
- Adams, S., P. Green, R. Claxton, S. Simcox, M. V. Williams, K. Walsh, and C. Leeuwenburgh. 2001. Reactive carbonyl formation by oxidative and non-oxidative pathways. Frontiers in Bioscience 6 (1):a17–a24. doi:10.2741/A581.
- Barth, R. C., W. J. Bashe, and T. V. Baker. 1991. Disinfection by-products: PFBOA/GC and DNPH/HPLC methods for the analysis of aldehydes and ketones. In Proceedings of Water Quality Technology Conference, American Water Works Association, 1349–1354. 2nd ed. Denver.
- Baynes, J. W. 1991. Role of oxidative stress in development of complications in diabetes. Diabetes 40 (4):405–412. doi:10.2337/diab.40.4.405.
- Betteridge, D. J. 2000. What is oxidative stress? Metabolism 49 (2):3–8. doi:10.1016/S0026-0495(00)80077-3.
- Cini, M., and A. Moretti. 1995. Studies on lipid peroxidation and protein oxidation in the aging brain. Neurobiology of Aging 16 (1):53–57. doi:10.1016/0197-4580(95)80007-E.
- Giordano, F. J. 2005. Oxygen, oxidative stress, hypoxia, and heart failure. Journal of Clinical Investigation 115 (3):500–508. doi:10.1172/JCI24408.
- Han, J., D. Wang, B. Yu, Y. Wang, H. Ren, B. Zhang, Y. Wang, and Q. Zheng. 2014. Cardioprotection against ischemia/reperfusion by licochalcone B in isolated rat hearts. Oxidative Medicine and Cellular Longevity 2014 (1):1–11. doi:10.1155/2014/134862.
- Khoschsorur, G. A., B. M. Winklhofer-Roob, H. Rabl, T. Auer, Z. Peng, and R. J. Schaur. 2000. Evaluation of a sensitive HPLC method for the determination of malondialdehyde, and application of the method to different biological materials. Chromatographia 52 (3-4):181–184. doi:10.1007/BF02490453.
- Mesquita, C. S., R. Oliveira, F. Bento, D. Geraldo, J. V. Rodrigues, and J. C. Marcos. 2014. Simplified 2,4-dinitrophenylhydrazine spectrophotometric assay for quantification of carbonyls in oxidized proteins. Analytical Biochemistry 458:69–71. doi:10.1016/j.ab.2014.04.034.
- Noeman, S. A., H. E. Hamooda, and A. A. Baalash. 2011. Biochemical study of oxidative stress markers in the liver, kidney and heart of high fat diet induced obesity in rats. Diabetology & Metabolic Syndrome 3 (1):17. doi:10.1186/1758-5996-3-17.
- Oberley, L. W. 1988. Free radicals and diabetes. Free Radical Biology and Medicine 5 (2):113–124. doi:10.1016/0891-5849(88)90036-6.
- Olszewska-Słonina, D. M., D. Mątewski, R. Czajkowski, K. J. Olszewski, A. Woźniak, G. Odrowąż-Sypniewska, K. Lis, D. Musiałkiewicz, and B. Kowaliszyn. 2011. The concentration of thiobarbituric acid reactive substances (TBARS) and paraoxonase activity in blood of patients with osteoarthrosis after endoprosthesis implantation. Medical Science Monitor 17 (9):CR498–504. doi:10.12659/MSM.881936.
- Pani, L., S. Pecorelli, G. Rosano, S. D. Anker, A. Peracino, L. Fregonese, K. Prasad, and G. Rasi. 2015. Steps forward in regulatory pathways for acute and chronic heart failure. European Journal of Heart Failure 17 (1):3–8. doi:10.1002/ejhf.209.
- Pikul, J., and D. E. Leszczynski. 1986. Butylated hydroxytoluene addition improves the thiobarbituric acid assay for malonaldehyde from chicken plasma fat. Food/Nahrung 30 (7):673–678.
- Rác, M., M. Křupka, S. Binder, M. Sedlářová, Z. Matušková, M. Raška, P. Pospíšil, and D. Hinderberger. 2015. Oxidative damage of U937 human leukemic cells caused by hydroxyl radical results in singlet oxygen formation. Plos One 10 (3):e0116958. doi:10.1371/journal.pone.0116958.
- Rjiba-Touati, K., I. Ayed-Boussema, Y. Guedri, A. Achour, H. Bacha, and S. Abid-Essefi. 2016. Effect of recombinant human erythropoietin on mitomycin C-induced oxidative stress and genotoxicity in rat kidney and heart tissues. Human & Experimental Toxicology 35 (1):53–62. doi:10.1177/0960327115577521.
- Selkoe, D. J. 2001. Alzheimer’s disease: genes, proteins, and therapy. Physiological Reviews 81 (2):741–766. doi:10.1152/physrev.2001.81.2.741.
- Sim, A. S., C. Salonikas, D. Naidoo, and D. E. Wilcken. 2003. Improved method for plasma malondialdehyde measurement by high-performance liquid chromatography using methyl malondialdehyde as an internal standard. Journal of Chromatography B 785 (2):337–344. doi:10.1016/S1570-0232(02)00956-X.
- Sultana, R., M. Perluigi, and D. Allan Butterfield. 2013. Lipid peroxidation triggers neurodegeneration: a redox proteomics view into the Alzheimer disease brain. Free Radical Biology and Medicine 62:157–169. doi:10.1016/j.freeradbiomed.2012.09.027.
- Tsutsui, H., S. Kinugawa, and S. Matsushima. 2011. Oxidative stress and heart failure. American Journal of Physiology-Heart and Circulatory Physiology 301 (6):H2181–H2190. doi:10.1152/ajpheart.00554.2011.
- Venardos, K., G. Harrison, J. Headrick, and A. Perkins. 2004. Selenium supplementation and ischemia–reperfusion injury in rats. Redox Report 9 (6):317–320. doi:10.1179/135100004225006803.
- Wang, H., X. Zhang, and Z. Chen. 2009. Development of DNPH/HPLC method for the measurement of carbonyl compounds in the aqueous phase: applications to laboratory simulation and field measurement. Environmental Chemistry 6 (5):389. doi:10.1071/EN09057.
- Ying, X-X., H-B. Li, Z-y. Chu, Y-J. Zhai, A-J. Leng, X. Liu, C. Xin, W-J. Zhang, and T-G. Kang. 2008. HPLC determination of malondialdehyde in ECV304 cell culture medium for measuring the antioxidant effect of vitexin-4″-O-glucoside. Archives of Pharmacal Research 31 (7):878–885. doi:10.1007/s12272-001-1241-2.
- Zhou, T., C.-C. Chuang, and L. Zuo. 2015. Molecular characterization of reactive oxygen species in myocardial ischemia-Reperfusion Injury. BioMed Research International 2015 (3):1–9. doi:10.1155/2015/864946.