
 ?Mathematical formulae have been encoded as MathML and are displayed in this HTML version using MathJax in order to improve their display. Uncheck the box to turn MathJax off. This feature requires Javascript. Click on a formula to zoom.
ABSTRACT
A framed field experiment combined with a latent class econometric approach was used to investigate how prestige-seeking behaviour influences food choices. We propose a theoretical framework to test conspicuous consumption of specialty food products. We test the hypothesis empirically by categorizing individuals into unobserved latent classes according to their general prestige-seeking behaviour. We find evidence of food consumption driven by prestige to the point of becoming a symbol of social status. The prestige-seeking behaviour seems to be motivated by invidious comparison or higher-class individuals seeking to differentiate themselves from lower-class individuals; and pecuniary emulation, or lower-class individuals buying prestigious goods in order to be perceived as members of a higher class. Findings from this study revealed that the effects of differentiating labelling attributes had a higher impact for individuals classified into classes with prestige-seeking behaviour to attain an elevated social status.
[‘Tell me what you eat, and I will tell you what you are’, Brillat-Savarin].
I. Introduction
Human beings are inherently prone to seek prestige or social status under several consumer settings (Berger, Rosenholtz, and Zelditch Citation1980). In general, theoretical models about social status rely on the assumption that the ‘social status’ itself provides individuals with utility (Veblen Citation2005). This concept is not new, and Veblen’s original idea was first published in 1899 (reprinted in 2005). Veblen (Citation2005) argues that individuals derive utility from showcasing their wealth to others. However, wealth and income are not directly observed by others, and hence it is the visual consumption of goods that displays wealth. The consumption of goods that seeks to demonstrate the purchase capacity and wealth of an individual is known as conspicuous consumption (Veblen Citation2005; Charles, Hurst, and Roussanov Citation2009). The two main motivations for conspicuous consumption are ‘invidious comparison’ and ‘pecuniary emulation’ (Bagwell and Bernheim Citation1996). Invidious comparison refers to higher-class individuals seeking to differentiate themselves from lower-class individuals; and pecuniary emulation refers to lower-class individuals seeking to be thought as members of a higher class. A prestige or social status effect exists if individuals or different classes of individuals are willing to pay a higher price for a functionally equivalent good in order to signal wealth (Bagwell and Bernheim Citation1996).
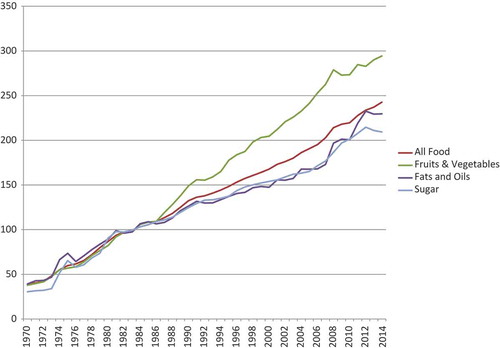
In the age of juicing trends and celebrities turning into clean-diet cookbook authors, the connection consumers make between health and food has become much stronger. A proliferation of food differentiation attributes has resulted in an explosion of studies examining consumer attitudes towards food production methods, policies, and technologies (Lusk and Briggeman Citation2009). Some of these attributes include organic production, local production, genetically modified food, health and nutritional benefits, environmentally friendly food, and socially responsible food, just to name a few. These food product claims provide consumers with additional benefits in a multiple array of functions. Consumers value food product claims and are, in many cases, willing to pay more for differentiating attributes (McCluskey and Loureiro Citation2003; Onozaka, Nurse, and McFadden Citation2010; Lusk and Briggeman Citation2009; Lusk, Norwood, and Pruitt Citation2006). As shows, in the mid-1980s, the prices of healthy fruits and vegetables started to increase more rapidly in relative terms compared to other food product categories such as fats and sugar. There is evidence in the literature linking food choices and diet quality with income. See, for example, Darmon and Drewnowski (Citation2008) for a recent review; however, little is known about how seemingly peripheral behaviour, namely prestige-seeking behaviour, affects, if at all, consumers’ valuations of food products. In order for conspicuous consumption to exist, there is a need for others to be aware of the purchase so that it signals status (Bagwell and Bernheim Citation1996). Consumers evaluate conspicuous goods based on quality attributes and the prestige and social status derived from consuming them. Dubois, Rucker, and Galinsky (Citation2012) proposed that even products not typically associated with conspicuous consumption (i.e. non-luxury goods) can be used to signal social status when a hierarchical relationship among people or products exists. In this context, it is possible that certain production methods and attributes of food products such as organic and other specialty designations have become fashionable and prestigious. Do consumers derive status utility from consuming those ‘specialty foods’ or perhaps by consuming them at specialty retail outlets with significant price premiums such as Whole Foods? If so, can consumers be segmented into latent classes related to their prestige-seeking behaviour and food purchases? This article investigates these questions using a framed field experiment. Although the majority of consumers purchase food products simply to satisfy nutritional needs, we find evidence of conspicuous consumption in food products motivated by invidious comparison or higher-class individuals seeking to differentiate themselves from lower-class individuals; and also motivated by pecuniary emulation, or lower-class individuals buying prestigious goods in order to be perceived as members of a higher class.
Figure 1. Consumer price index for selected food categories (1982–1984 = 100).
Source: Bureau of Labor Statistics.
In addition to intrinsic product attributes and prices, theoretical models of social status include the prestige of the products in the utility function. If prestige or status for a product exists, then for similar products in terms of functionality and with comparable quality, prestige-seeking individuals would exhibit a higher willingness to pay (WTP) for the prestigious items. Nelissen and Meijers (Citation2011) conducted a series of experiments to test whether a person wearing a brand-labelled shirt versus a non-labelled shirt would have any effects in the perception of their social status. They found that the conspicuous consumption of the branded shirt resulted in preferential treatment to the point of even generating financial benefits. One of the potential problems in designing an economic experiment for social status or prestige is that quality and price are highly correlated (i.e. higher quality products are usually more expensive). When it comes to food products, the attributes of specialty foods are often associated with quality differentials, and the quality variable is confounded with the social status. In the past, in order to disentangle quality and status, experimental methods have used identical products, manipulating the labels with varying prices or labelling attributes; thus the quality is controlled in the valuation of WTP, and any differentials are attributed to the social status or prestige. Plassmann et al. (Citation2008) conducted an experiment where subjects tasted identical bottles of wine labelled at different retail prices. Using functional magnetic resonance imaging (fMRI), they showed that subjects who tasted the wine labelled at a price of $90 reported not only higher flavour ratings compared to the same bottle of wine labelled at a price of $10 but also the medial orbitofrontal cortex (mOFC), a region of the brain associated with pleasantness of odours and flavour had higher activity with the higher-priced bottle of wine. The results of Plassmann et al. (Citation2008) are significant because they show that the perceptions of pleasantness have neurobiological roots and that human beings are inherently prone to derive pleasure from social status. This may provide an explanation as to why consumers report higher taste evaluations when eating more expensive meals (Just, Sığırcı, and Wansink Citation2014), that is, food taste better at fancy restaurants. Recent studies in wine have found that price is a signal for quality and individuals do show higher WTP for the products representing a higher social status (Lewis and Zalan Citation2014; Mastrobuoni, Peracchi, and Tetenov Citation2014; Ashton Citation2014). However, all of the above-mentioned wine studies use deception in their methods, a practice not allowed in economics (Cooper Citation2014). We propose a theoretical framework to avoid deception and econometrically account for quality and social status differences. The approach consists of keeping all food products with varying quality constant across all respondents, and separate participants into unobserved latent classes according to their prestige-seeking behaviour and compare WTP by each prestige-seeking class.
The overall objective of this article is to provide insight into the sources of unobserved preference heterogeneity among consumers and investigate the relationship between consumers’ prestige-seeking tendencies and their valuations for the marketable attributes of food, specifically information labelling and taste. To accomplish this, individuals will be segmented into unobserved latent classes based on their prestige-seeking consumption behaviour.
We contribute to the literature by providing a theoretical framework to test whether consumers derive status utility from consuming specialty food products. We test the hypothesis empirically by econometrically categorizing individuals into unobserved latent classes according to their general prestige-seeking behaviour. In order to reduce the sensitivity of factors driving class membership, a well-known and validated marketing scale based on respondents attitudes towards prestige and prominence of social status was used to determine class membership. The rest of the article proceeds as follows. Section II describes the experimental procedures. Section III presents the theoretical framework. Section IV shows the results and discussion. Section V summarizes and concludes.
II. Experimental procedures
A total of 201 participants (nonstudents) from a midsize city located at a large university campus participated in the study in February 2014. There were nine sessions with average participation ranging from n = 22 to n = 25 subjects per session. While recruiting a sample chock full of college students may have been convenient and less expensive, one of the objectives during the recruitment process was to attract a sample that was representative of grocery shoppers. Towards this end, a series of advertisements were issued in a local newspaper prior to the experiments and email correspondence was established with potential interested parties. Upon arrival, participants were checked in and were asked to read and sign a consent form. Contingent on the individual signing the consent form, they were next seated and provided with a participant identification number which secured anonymity, a participation packet which included the questionnaire and a description of the auction procedures.
After explaining the procedures and answering any initial questions, two practice rounds of auctions were completed and participants filled out a short quiz that tested their knowledge of the procedures. Next, participants were asked to submit bids in a sealed-bid second-price Vickrey auction (Vickrey Citation1961) for each food product. In a second-price auction, the second-highest bid is the market price and the highest bidder purchases the auctioned good at the market price. All subjects submitted bids for a baseline round, where no information was provided about any of the products. Then, half of the subjects participated in a blind tasting as the treatment and the other half of the sample received labelling information about each product. Only one of the bidding rounds was selected to be binding. Participants in all sessions bid on eight vegetable products that varied in production method and colour: organically produced green lettuce, organically produced red lettuce, conventionally produced green lettuce; conventionally produced red lettuce, hydroponically produced red lettuce, hydroponically produced green lettuce, hydroponically produced red-and-green mixed lettuce, and spinach. Hydroponic mixed lettuce was a red-and-green variety that had been planted together and grew intertwined with one another to form one head of lettuce. Lettuce was used in the study because it is familiar to most consumers, available in different product forms and attributes and also to fit budget constraints. Spinach was used as a substitute for lettuce. The seven heads of lettuce and one bunch of spinach were laid out on a table at the back of the room and randomly given an identification number.
During the first round of vegetable auctions, the baseline round, all of the products were displayed on the auction table at the back of the room and participants were able to pick up and examine each product before submitting their bids. Participants had to self-identify the products since no information was provided about any of the products. Then, they were asked to submit their bid such that it was exactly equal to their maximum WTP value for each vegetable product. Bids from this first vegetable auction round were considered the baseline level of bids, against which all subsequent bids were compared. Participants assigned to the blind tasting treatment tasted samples of each of the auction goods and, following the completion of a tasting report, asked to examine the auction products once again and submit bids for the vegetable products. Subjects who received labelling information as the treatment were given a sheet of paper with bullet points about the production methods of the products. While the subjects reviewed the handout, labels that identified the products were placed in front of each of the eight vegetable products on the auction table. Now, participants knew the production method (organic, conventional, or hydroponic production) and colour of each lettuce product (red, green, and mixed). After reading the labelling information of the products, participants were asked to examine the auction table as they did in the baseline round and submit bids once again for all eight products.
Following each group’s treatment, one of the two vegetable auction rounds in each session was randomly chosen to be binding and the bids for the binding product in that round were sorted from highest to lowest. A second-price Vickrey auction mechanism was used in which the highest bidder became the buyer and paid the market price (which was the second-highest bid) for the product (Vickrey Citation1961). Participants were made aware that the vegetable auction rounds were binding and if they became a buyer, an amount equivalent to the market price would be deducted from their $30 compensation fee and they would receive the binding product to take home.
While the buyer and market price of the vegetable auctions were being determined, subjects in all sessions filled out a questionnaire that collected information about demographics (including age, household size, income, employment, marital status, education, and race) and vegetable-buying behaviour (purchase outlet, frequency, importance of factors when purchasing lettuce, etc.). In addition, participants answered scale-style questions that related to perceptions of their individual prestige-sensitivity and seeking behaviour using a validated scale measure (Eastman, Goldsmith, and Flynn Citation1999). Finally, after the completion of the questionnaire, the buyer(s), the market price, and the binding product and round were announced.
III. Theoretical framework
The traditional approach to model the consumption of conspicuous products (Bagwell and Bernheim Citation1996) assumes that an individual i, consumes an amount x of a conspicuous product which is evaluated according to its quality q, where . The individual has resources R, which can be high (H) or low (L), so that
and the individual allocates total expenditures on conspicuous goods, denoted by c. The total consumption of conspicuous and inconspicuous consumption is denoted by z. The individuals face a resource constraint of the form
, where
, expenditures of the conspicuous good reduce total expenditures; and
, higher resources allow for higher total expenditures. Total utility for individuals with each type of resources
is then given by
, and W denotes all other factors entering the utility function. Note that in the utility specification quality varies in the range
, hence the consumption of the conspicuous product is determined by
.
is the maximum amount a consumer is willing to pay for
. The prestige or social status would be found if higher WTP values exist for a fixed level of quality
. For a non-conspicuous (i.e. unbranded) product
with the same level of quality as the conspicuous product
,
. Traditional experimental methods in the literature hold quality at a fixed level
, and evaluate WTP based on manipulation of the labels by using different ‘brands’ or prices, which imply higher levels of prestige for some of the products at a fixed quality level. As discussed before, this construct is considered deceptive, a practice banned in the economics literature (Cooper Citation2014). We proposed to use several food products with varying quality
and segment individuals into latent classes according to their prestige-seeking behaviour using a validated marketing scale, and evaluate the WTP for each latent class. Then,
,
and individuals in a latent class
who tend to derive more utility for prestige
, would be hypothesized to have higher WTP values for the same products than individuals in a class
with lower utility for prestige
.
In order to gain information about consumers’ prestige-related behaviour, an extensively validated prestige-seeking scale was included in the questionnaire (Eastman, Goldsmith, and Flynn Citation1999). Consumers indicate the degree to which they agree or disagree, or approve or disapprove with each scale item. The prestige-sensitivity scale is a subscale within the price perception scale, developed and validated by Lichtenstein, Ridgway, and Netemeyer (Citation1993) and also documented in Bearden and Netemeyer (Citation2011). The prestige-sensitivity scale helps to identify the individual’s proneness to purchase goods for the ‘feelings of prominence and status’ (Eastman, Goldsmith, and Flynn Citation1999; Lichtenstein, Ridgway, and Netemeyer Citation1993). Participants’ responses to the prestige scale are used in a latent class analysis (LCA) to identify and characterize subgroups of different types of consumers within the sample.
LCA operates off the premise that a population can be categorized into unobserved subgroups according to certain indicators. It uses a combination of classical regression and Bayesian analysis to estimate the probability of an individual belonging to one of those subgroups, also called a latent class, based on similar observed variables (Lanza, Tan, and Bray Citation2013; Greene Citation2012). Individuals are divided into S latent classes s = 1, …, S, defined from a number of j = 1, …, J observed variables, also known as the indicators. The number of possible outcomes associated with the variable j is denoted by Mj for individuals i = 1, …, n. The observable data are the individual i’s observed responses to the J scale-response indicators and behavioural variables and represented by vector Xi = (Xi1, …, XiJ), where the possible outcomes of Xij are known as m and m = 1, …, Mj. Let act as an indicator function that is equal to 1 if the response to indicator j = m, and 0 otherwise. The probability density function of an individual demonstrating a specific membership profile is given as:
where the distribution and parameters of the indicator variables, , is equal to the probability of individual i qualifying for membership in class s
, multiplied by the associated conditional probability density function (
) for all classes. The density function is further defined as the product of the indicator (J) and possible outcome (Mj) vectors. The parameters of the density function, (
, represents the indicator-response probabilities of a specific response, mj to the indicator variable j, given the individual’s membership in class s. Therefore, if the observed indicators, X, and the number of latent classes, S, are known, then the idea is to solve for the parameters
. This can be done through the following likelihood function for
:
The parameters can be estimated through the expectation–maximization (EM) algorithm because the individual’s class membership is uncertain and thus may be regarded as missing data (Dempster, Laird, and Rubin Citation1977). The log-likelihood is specified as:
The EM algorithm can be used on the after imprinting random initial estimates of
and
on a Bayesian calculation of the posterior probability, all in an effort to determine the class membership parameters,
. The first step is to use a Bayesian approach for determining the class membership probability that individual i belongs to class s, given the observed k indicators:
Next, applying the random initial estimates yields an estimated value, , for the unknown class membership probabilities
. Following this estimation, the second part of the EM algorithm is the maximization of the
with respect to
, subject to
,
and
. This maximization yields maximum likelihood estimates of
and
for s = 1, …, S, useful for recalculating the posterior probabilities.
Because the actual number of prestige-seeking latent classes is unknown, certain criterion tests are used to gain a more accurate estimation of S. In general, Akaike’s information criterion (AIC) favours larger models (Akaike Citation1973), and the Bayesian information criterion (BIC) accounts for sample size and favours more parsimonious models (Schwarz Citation1978), and the adjusted BIC (Sclove Citation1987) are the primary methods for estimating which level of S is most appropriate. The final posterior probability estimates are used to sort individuals into the S latent classes by comparing the highest individual-specific posterior probabilities. For example, individual i has membership to class k if
for all s ≠ k.
WTP is then made a function of intrinsic product characteristics and behavioural characteristics of individuals, treatments (either tasting or labelling information), and interaction effects of the latent classes as , where WTP*itj is the latent value of individual i’s bid in treatment t for product j, WTPitj is the observed bid value, vitj is a set of observed product characteristics, socio-economic characteristics, and treatment indicators, η is a vector of random intercepts, β is a vector of random coefficients, θ is a vector of constant coefficients, S are latent class interaction effects, and εisj is a random error term. Since WTP is censored at zero, the model is estimated using a random parameters Tobit framework, which is specified as:
where WTP*itj is an column vector of latent values associated with each bid,
represents an
column vector of 1s,
denotes the mean intercept for the pool of observations submitted by individual i,
takes the form of a scalar that represents the grand mean of observations from all individuals, and
captures the variation or deviation of the mean intercept for individual i from the grand mean. It is assumed that the random intercepts are distributed with a zero mean and variance
. The coefficients vector
is the sum of the grand mean coefficient vector
, and the respondent deviation αi, which captures variation in coefficients between individuals, and the x1,i is a (T × J) × K matrix of K random covariates. Within the same individual, these deviations are distributed with a zero mean vector and a variance–covariance matrix
. Consequently, the random coefficients follow a multivariate normal distribution, so that
and
if i = j. In addition, x2,i represents a (T × J) × L matrix of L fixed covariates, θ is a vector of constant coefficients across individuals, and the term εi is a normally distributed random vector with mean zero and common variance matrix
. Finally, it is assumed that α, μ, e, and x are uncorrelated within and across individuals (Swamy Citation1970; Moeltner and Layton Citation2002).
IV. Results and discussion
The LCA used responses from the prestige-seeking marketing scale indicators, weekly exercise behaviour, and weekly fruit and vegetable expenditures to define a number of S existing classes where S was estimated for a range of 2–9 classes. The information criteria (IC) produced contradictory results for the optimal number of classes – the minimum BIC suggested a two-class model, while the minimum adjusted BIC and AIC proposed a four-class model. Dziak et al. (Citation2012) suggests that when ICs differ, AIC frequently tends to favour a large model (overfitting), whereas BIC presents risks because it often supports a smaller model (underfitting). The contradictory model selection criteria is a limitation of the analysis, and since for small sample sizes as in our case, the error is usually underfitting, the preferred criterion is the one with lower rates of underfitting, in this case the AIC (Dziak et al. Citation2012).
contains the estimated class membership and indicator-response probabilities for the selected four-class prestige model. Participants were categorized based on their responses to questions about their general buying behaviour as it pertains to feelings of prominence, prestige, and status using an extensively validated marketing scale (Eastman, Goldsmith, and Flynn Citation1999; Lichtenstein, Ridgway, and Netemeyer Citation1993). Information about participants’ weekly exercise and weekly fruit and vegetable spending habits were also used to define the latent classes. Approximately 12% of the participants are members of Class 1, about 69% of the sample is represented by Class 2, 9% are members of Class 3, and another 9% are members of Class 4. Relative to the other classes, consumers in Class 1 were the most active, as they had the highest probability of exercising four times per week or more. However, they also demonstrated the lowest probability of high fruit and vegetable consumption (more than $50 per week). Consumers in this class largely agreed with statements regarding others’ perceptions of them by the type, price, or brand of the products they buy, but low probabilities were observed in the indicators that asked about gaining personal satisfaction through their purchases of prestigious products. Prestige for individuals in class 1, however, is only attained in consuming expensive products. For example, there was a relatively high probability that individuals in Class 1 thought that people notice when they buy the most expensive brand of a product (91.30%), it says something to people when you buy the high-priced version of a product (95.65%), and that others make judgments about them based on the kinds of products and brands they buy (78.26%), an a very low probability of deriving prestige from inexpensive products (4.00%). The average income of consumers in Class 1, $38,043, was the lowest of all classes. Their relatively low income compared to the other three classes, but high regard towards what others thought of them through their materialistic purchases for expensive products led to Class 1 being named ‘Ambitious Shoppers’.
Table 1. Latent class parameter estimates for four-class model for prestige scale.
In contrast, consumers in Class 2 (69.48% of participants) were least likely to be concerned about prestige when they purchase goods. For instance, there is a 0% probability that individuals in this class were emotionally affected by buying higher priced brands. Additionally, only 1.37% of Class 2 agreed that they enjoy the prestige of buying a high-priced product and only 2.74% agreed that even for a relatively inexpensive product, buying a costly brand was impressive. Compared to the other classes, members of Class 2 were least concerned about what others thought about them in relation to their purchases. Their exercising habits were most similar to Class 1, while their fruit and vegetable buying behaviour was most analogous to Class 3’s habits. As a result of their disinterest in prestige, members of Class 2 were labelled as ‘Utilitarian Buyers’, referring to the fact that they are more concerned about the functionality of the products and not concerned about the social status or prestige of the purchase.
Individuals in Class 3 (9.19% of participants) were relatively least likely to exercise four or more times per week, but compared to the other classes they were likely to spend more than $50 on fruits and vegetables each week. Compared to the other classes, consumers in Class 3 had the highest average annual income, $57,307. They also exhibited relatively high prestige-seeking behaviour, but only for expensive luxury brands. For example, there was a 69.23% probability that expensive luxury brands of a product make them feel good about themselves and there was a 46.15% chance that buying the most expensive brand of a product makes individuals in Class 3 feel classy. Given their relatively high incomes and preference towards expensive brands, Class 3 was named the ‘Affluent Elitists’.
All individuals in Class 4 (9.26% of participants) were likely to feel an increase in self-esteem and enjoy the garnered prestige after buying high-priced products. Additionally, there was an estimated 47% probability that consumers in this class agreed that even for a relatively inexpensive product, buying a costly brand was impressive. Compared to the other classes, consumers in Class 4 were most concerned that their friends would think they were cheap if they consistently bought the lowest priced version of a product. As a result of their high regard towards prestige-seeking consumption behaviour, Class 4 was named the ‘Prestige Lovers’.
contains the demographic and behavioural characteristics of each latent class, as well as for all participants and the U.S. population. The sample is fairly similar to the U.S. population except for education and income; these differences are expected since our target sample was grocery shoppers. As expected according to the theoretical framework proposed, the average WTP across all products was lowest for individuals classified in the Utilitarian Class ($1.41/head of lettuce), as they were uninterested with prestige and were more concerned with the functionality of the products they purchase. All other classes associated with higher prestige-seeking behaviour had higher WTP values across all products ($1.61, $1.60, and $1.48 for Ambitious Shoppers, Affluent Elitist, and Prestige Lovers, respectively). The latent classes differed in some demographic characteristics. Recall that the class membership was based on the behavioural aspects related to prestige seeking. Income is an important factor in driving consumption of conspicuous products and it was found to differ across latent classes. The latent classes also differed by age. This result seems to be in line with recent work linking Millennial’s self-image and conspicuous consumption and materialism (Grotts and Johnson Citation2013; Eastman, Iyer, and Thomas Citation2013). This is particularly important for younger individuals since social media is often used as a way to showcase the consumption of conspicuous goods in order to project a positive self-image (Bergman et al. Citation2011). The relative low income and high regard for prestige in expensive products, along with higher WTP values across all products for the Ambitious Shopper’s class provides some evidence that the motivations for their prestige-seeking behaviour are in line with the concept of pecuniary emulation, or seeking to be thought of as belonging to a higher social status. Both the Affluent Elitists and the Prestige Lovers classes are motivated for social status derived from invidious comparison or a desire to differentiate themselves from lower social strata individuals. The main difference between Affluent Elitists and Prestige Lovers is that Affluent Elitists believe that status is mainly achieved by purchasing luxury and expensive goods, while Prestige Lovers believe that status can be achieved even with relatively inexpensive purchases.
Table 2. Demographic and behavioural characteristics of participants by latent class.
contains the parameter estimates of the random parameter Tobit model in which Classes 1, 3, and 4 (Ambitious Shoppers, Affluent Elitists, and Prestige Lovers, respectively) were compared to Class 2 (Utilitarian Buyers were as the baseline). The general results show consumers were willing to pay price premiums for organic ($0.11) and mixed lettuce ($0.09) and discounted red lettuce by nearly $0.21. Even though Ambitious Shoppers exhibited higher WTP across all products and hence showing signs of prestige, relative to the Utilitarian Buyers in Class 2, the Ambitious Shoppers in Class 1 expressed significant discounts of around $0.17 and $0.27 for organically grown lettuce and red lettuce, respectively. Although the signs on these variables for Class 1 are negative, the effect was heterogeneous – which means that consumers in this class acted differently with regard towards these product attributes. A possible explanation is that since they derive status only from expensive and luxury products, then saving money in inexpensive products increases the budget allocation for conspicuous consumption as explained in our theoretical framework. The differences in perceptions and heterogeneous valuations of WTP towards the organic attribute are in line with research showing different motivations for the consumption of organic food (Hughner et al. Citation2007). The information treatment ignited a $0.20 increase in WTP among the Ambitious Shoppers suggesting they do react to labelling information conveying prestige. The significance of the standard deviations of the interaction effect between Class 1 and the information treatment indicates that although information had a positive effect on WTP, consumers responded differently to the information. In fact, the significance of the standard deviations of all of the random parameters for Class 1 indicates that the Ambitious Shoppers responded differently to the product attributes and treatment indicators within their own class. These results are in agreement with previous work showing that consumers value food labels (Onozaka, Nurse, and McFadden Citation2011) but that valuations are heterogeneous across consumers (Lusk and Briggeman Citation2009).
Table 3. Random parameters Tobit estimates for WTP for lettuce products: Utilitarian Buyers as baseline.
Relative to the Utilitarian Buyers, the Affluent Elitists indicate premiums of approximately $0.27 for organic lettuce. Despite the significantly positive effect of organic lettuce on WTP, consumers’ preferences for this attribute were heterogeneous within the class. The significantly positive effects of the blind tasting and production information treatments on WTP are also worth discussing. The blind tasting treatment caused a $0.31 increase in WTP for lettuce, while the labelling information treatment encouraged an increase of nearly $0.43 in WTP for the Affluent Elitists in Class 3. While the Affluent Elitists responded differently to tasting lettuce, they all acted upon labelling information homogeneously. The effect seen from the labelling information treatment is larger for the Affluent Elitist than the Ambitious Shoppers, which could be attributed to the Affluent Elitist’s higher incomes. That is, although both classes increased their WTP after learning about the production methods of the lettuce products, the higher income levels of the Affluent Elitists resulted in larger premium than the Ambitious Shoppers. These results suggest that the Ambitious Shoppers want to purchase lettuce based on its labelling information but may not be able to afford it, whereas the Affluent Elitists may not be as concerned by the price of food products.
The Prestige Lovers class only expressed a significant premium of around $0.18 for organic lettuce, which was homogeneous throughout the class. In other words, all Prestige Lovers responded the same way to organic lettuce. Perhaps this effect is because Prestige Lovers associate organic food with prestige and something that is to be coveted (Aertsens et al. Citation2009). Other factors that are significant influences on individuals’ valuations of lettuce are household size, which positive affects WTP, and average weekly fruit and vegetable expenditures, which significantly decrease consumers’ valuations of lettuce.
V. Summary and concluding remarks
This study used a framed field experiment to investigate how consumers’ preferences for prestige and social status are related to their WTP for differentiating attributes of food products. The literature shows evidence linking food choices and diet quality with income (Darmon and Drewnowski Citation2008). Following the conjecture that having a healthy lifestyle or consuming healthy food may be associated with prestige and social status, individuals in this study were classified into separate latent classes according to their prestige- and social status-seeking behaviour. The majority of the participants (69.48%) were classified as ‘Utilitarian Buyers’ who purchase goods based on their functionality and are not concerned with the prestige or social status of food products. In addition, there were three other latent classes found and based on their characteristics they were described as ‘Ambitious Shoppers’ (12.07% of participants), ‘Affluent Elitists’ (9.19% of participants), or ‘Prestige Lovers’ (9.26% of participants). Evidence was found of prestige-seeking behaviour motivated by invidious comparison and pecuniary emulation as described by Bagwell and Bernheim (Citation1996). The relative low-income and high regard for prestige, along with higher WTP values across all products for the Ambitious Shopper’s class provides some evidence that the motivations for their prestige-seeking behaviour are in line with the concept of pecuniary emulation, or seeking to be thought of as belonging to a higher social status. Both the Affluent Elitists and the Prestige Lovers classes are motivated for social status derived from invidious comparison or a desire to differentiate themselves from individuals from lower social status. The main difference between Affluent Elitists and Prestige Lovers is that Affluent Elitists believe that status is mainly achieved by purchasing luxury and expensive goods, while Prestige Lovers believe that status can be achieved even with relatively inexpensive purchases. A random parameters Tobit model allowed for comparisons to be made between classes and their WTP for different information labelling and the taste of the food products. Findings from this study revealed that the effects of differentiating labelling attributes had a higher impact for individuals classified into classes with prestige-seeking behaviour to attain an elevated social status. It is possible that prestige-seeking individuals may be more likely to be early adopters of new production technologies or practices since they are more responsive to labelling attributes. In line with extensive literature of food values, each latent class responded positively to labelling information, implying that sellers may be able to boost premium prices of prestige-seeking individuals through customer education and marketing. The increasing gap in food prices associated with diet quality may be reflecting the reality of a lower purchase capacity by low-income consumers. As shows, in the mid-1980s, the prices of healthy fruits and vegetables started to increase more rapidly in relative terms compared to other food product categories such as fats and sugar. While nutritional policies promote the consumption of high-quality healthy food products (DGA Citation2010), the reality is that the cost of healthy and nutritious food may be too high for some consumers to bear, deeming health promotion policies ineffective. It is precisely that cost differential in food that has opened the door for food to become a symbol of social status.
Disclosure statement
No potential conflict of interest was reported by the authors.
References
- Aertsens, J., W. Verbeke, K. Mondelaers, and V. H. Guido. 2009. “Personal Determinants of Organic Food Consumption: A Review.” British Food Journal 111 (10): 1140–1167. doi:10.1108/00070700910992961.
- Akaike, H. 1973. “Information Theory and an Extension of the Maximum Likelihood Principle.” Second International Symposium on Information Theory, Budapest, 1973, 267–281.
- Ashton, R. H.. 2014. “Wine as an Experience Good: Price Versus Enjoyment in Blind Tastings of Expensive and Inexpensive Wines.” Journal of Wine Economics 9 (2): 171–182. doi:10.1017/jwe.2014.7.
- Bagwell, L. S., and B. D. Bernheim. 1996. “Veblen Effects in a Theory of Conspicuous Consumption.” American Economic Review 86 (3): 349–373. doi:10.2307/2118201.
- Bearden, W. O., and R. G. Netemeyer. 2011. Handbook of Marketing Scales: Multi-Item Measures for Marketing and Consumer Behavior Research. Association for Consumer Research Series. Thousand Oaks, CA: Sage Publications.
- Berger, J., S. J. Rosenholtz, and M. Zelditch Jr. 1980. “Status Organizing Processes.” Annual Review of Sociology 6: 479–508. doi:10.1146/annurev.so.06.080180.002403.
- Bergman, S. M., M. E. Fearrington, S. W. Davenport, and J. Z. Bergman. 2011. “Millennials, Narcissism, and Social Networking: What Narcissists Do on Social Networking Sites and Why.” Personality and Individual Differences 50 (5): 706–711. doi:10.1016/j.paid.2010.12.022.
- Charles, K. K., E. Hurst, and N. Roussanov. 2009. “Conspicuous Consumption and Race.” The Quarterly Journal of Economics 124 (2): 425–467. doi:10.1162/qjec.2009.124.2.425.
- Cooper, D. J.. 2014. “A Note on Deception in Economic Experiments.” Journal of Wine Economics 9 (2): 111–114. doi:10.1017/jwe.2014.18.
- Darmon, N., and A. Drewnowski. 2008. “Does Social Class Predict Diet Quality?” The American Journal of Clinical Nutrition 87 (5): 1107–1117.
- Dempster, A. P., N. M. Laird, and D. B. Rubin. 1977. “Maximum Likelihood from Incomplete Data via the EM Algorithm.” Journal of the Royal Statistical Society. Series B (Methodological) 39 (1): 1–38. doi:10.2307/2984875.
- DGA, Dietary Guidelines Advisory Committee. 2010. “Report of the Dietary Guidelines Advisory Committee on the Dietary Guidelines for Americans, 2010, to the Secretary of Agriculture and the Secretary of Health and Human Services.” Washington, DC: Agricultural Research Service.
- Dubois, D., D. D. Rucker, and A. D. Galinsky. 2012. “Super Size Me: Product Size as a Signal of Status.” Journal of Consumer Research 38 (6): 1047–1062. doi:10.1086/661890.
- Dziak, J. J., D. L. Coffman, S. T. Lanza, and L. Runze. 2012. Sensitivity and Specificity of Information Criteria. The Methodology Center and Department of Statistics, Penn State, The Pennsylvania State University. State College, PA.
- Eastman, J., R. Iyer, and S. Thomas. 2013. “The Impact of Status Consumption on Shopping Styles: An Exploratory Look at the Millennial Generation.” Marketing Management Journal 23 (1): 57–73.
- Eastman, J. K., R. E. Goldsmith, and L. R. Flynn. 1999. “Status Consumption in Consumer Behavior: Scale Development and Validation.” Journal of Marketing Theory and Practice 7 (3): 41–52. doi:10.1080/10696679.1999.11501839.
- Greene, W. H. 2012. Econometric Analysis. Boston: Prentice Hall.
- Grotts, A. S., and T. W. Johnson. 2013. “Millennial Consumers’ Status Consumption of Handbags.” Journal of Fashion Marketing and Management: An International Journal 17 (3): 280–293. doi:10.1108/JFMM-10-2011-0067.
- Hughner, R. S., P. McDonagh, A. Prothero, C. J. Shultz, and J. Stanton. 2007. “Who are Organic Food Consumers? A Compilation and Review of Why People Purchase Organic Food.” Journal of Consumer Behaviour 6 (2–3): 94–110. doi:10.1002/cb.210.
- Just, D. R., Ö. Sığırcı, and B. Wansink. 2014. “Lower Buffet Prices Lead to Less Taste Satisfaction.” Journal of Sensory Studies 29 (5): 362–370. doi:10.1111/joss.12117.
- Lanza, S. T., X. Tan, and B. C. Bray. 2013. “Latent Class Analysis with Distal Outcomes: A Flexible Model-Based Approach.” Structural Equation Modeling: A Multidisciplinary Journal 20 (1): 1–26. doi:10.1080/10705511.2013.742377.
- Lewis, G., and T. Zalan. 2014. “Strategic Implications of the Relationship Between Price and Willingness to Pay: Evidence from a Wine-Tasting Experiment.” Journal of Wine Economics 9 (2): 115–134. doi:10.1017/jwe.2014.9.
- Lichtenstein, D. R., N. M. Ridgway, and R. G. Netemeyer. 1993. “Price Perceptions and Consumer Shopping Behavior: A Field Study.” Journal of Marketing Research 30 (2): 234–245. doi:10.2307/3172830.
- Lusk, J. L., and B. C. Briggeman. 2009. “Food Values.” American Journal of Agricultural Economics 91 (1): 184–196. doi:10.1111/j.1467-8276.2008.01175.x.
- Lusk, J. L., F. Bailey Norwood, and J. Ross Pruitt. 2006. “Consumer Demand for a Ban on Antibiotic Drug Use in Pork Production.” American Journal of Agricultural Economics 88 (4): 1015–1033. doi:10.1111/j.1467-8276.2006.00913.x.
- Mastrobuoni, G., F. Peracchi, and A. Tetenov. 2014. “Price as a Signal of Product Quality: Some Experimental Evidence.” Journal of Wine Economics 9 (2): 135–152. doi:10.1017/jwe.2014.17.
- McCluskey, J. J., and M. L. Loureiro. 2003. “Consumer Preferences and Willingness to Pay for Food Labeling: A Discussion of Empirical Studies.” Journal of Food Distribution Research 34: 3.
- Moeltner, K., and D. F. Layton. 2002. “A Censored Random Coefficients Model for Pooled Survey Data with Application to the Estimation of Power Outage Costs.” Review of Economics and Statistics 84 (3): 552–561. doi:10.1162/003465302320259547.
- Nelissen, R. M. A., and M. H. C. Meijers. 2011. “Social Benefits of Luxury Brands as Costly Signals of Wealth and Status.” Evolution and Human Behavior 32 (5): 343–355. doi:10.1016/j.evolhumbehav.2010.12.002.
- Onozaka, Y., G. Nurse, and D. T. McFadden. 2010. “Local Food Consumers: How Motivations and Perceptions Translate to Buying Behavior.” Choices 25: 1.
- Onozaka, Y., G. Nurse, and M. Dawn Thilmany. 2011. “Defining Sustainable Food Market Segments: Do Motivations and Values Vary by Shopping Locale?” American Journal of Agricultural Economics 93 (2): 583–589.
- Plassmann, H., J. O’Doherty, B. Shiv, and A. Rangel. 2008. “Marketing Actions can Modulate Neural Representations of Experienced Pleasantness.” Proceedings of the National Academy of Sciences 105 (3): 1050–1054. doi:10.1073/pnas.0706929105.
- Schwarz, G. 1978. “Estimating the Dimension of a Model.” 461–464. doi:10.1214/aos/1176344136.
- Sclove, S. L.. 1987. “Application of Model-Selection Criteria to Some Problems in Multivariate Analysis.” Psychometrika 52 (3): 333–343. doi:10.1007/BF02294360.
- Swamy, P. A. V. B. 1970. “Efficient Inference in a Random Coefficient Regression Model.” Econometrica 38 (2): 311–323. doi:10.2307/1913012.
- Veblen, T. 2005. The Theory of the Leisure Class: An Economic Study of Institutions. Delhi: Aakar Books. Original edition, 1899.
- Vickrey, W. 1961. “Counterspeculation, Auctions, and Competitive Sealed Tenders.” The Journal of Finance 16 (1): 8–37. doi:10.2307/2977633.