?Mathematical formulae have been encoded as MathML and are displayed in this HTML version using MathJax in order to improve their display. Uncheck the box to turn MathJax off. This feature requires Javascript. Click on a formula to zoom.
ABSTRACT
Competition is often observed between heterogenous teams. Heterogeneity in ability is critical for the effectiveness of different tournament designs. I investigate how the presence of a dominant competitor or superstar does affect the decisions of other competitors in team contests. In particular, I use novel data from top-level professional basketball to investigate the consequences of superstar presence on effort and risk-taking of teams in rank-order contests. To identify the effect, I exploit exogenous variation in superstar dominance, induced by an institutional reform. My results demonstrate that the effect of competing with a superstar on effort does depend on the level of superstar dominance and the number of dominant teams in the contest. For tournaments with a single and clearly dominant superstar team, I find a sizable and significant negative effect of superstar presence on effort of other competing teams. Reduced dominance by the superstar, however, is found to result in a positive peer effect. I also present results for a robust association between competing with a superstar and risk-taking, indicating that a dominant superstar decreases risk-taking. Presence of a weak superstar, however, is estimated to increase risk-taking among other competitors.
1. Introduction
Economic decision-making often involves strategic interactions within groups of competitors. Before elections, heterogeneous parties compete for voters, companies compete for contracts or engage in patent contests. Within companies, too, working groups make strategic decisions about effort and risk-taking under competitive incentive systems. Designing efficient and effort maximizing contests requires the understanding of the effects of contestants’ heterogeneity on effort or risk-taking.
Contest design with heterogeneous contestants has been a central focus of the theoretical literature (Lazear and Rosen Citation1981; Baik Citation1994; Groh et al. Citation2012; Stracke et al. Citation2015). Competitors are typically heterogenous in terms of ability or status (Lazear and Rosen Citation1981; Rosen Citation1986).Footnote1 The presence of a superstar (Rosen Citation1981) in a competition represents extreme heterogeneity, which can result in negative incentive effects (Brown Citation2011).
The key contribution of my analysis is the novel focus on superstar effects in team settings. Empirical evidence to date exists primarily for individual decision makers in contests with superstars. Studying how teams respond to the presence of a dominant competitor is relevant in a variety of contexts, including political contests, inter- and intra-firm competition, or litigation involving teams of lawyers. Due to the abundance of information (Frick Citation2003) and clear incentive structures, sports represent an ideal environment to analyse team decisions (Bar-Eli, Krumer, and Morgulev Citation2020). In particular, I use data from international basketball to study teams’ effort or risk-taking decisions when competing with a dominant superstar team. I define a superstar as a vastly dominant and highly respected team in men’s professional basketball.
I compare effort and risk-takingFootnote2 decisions in round-robin groups with (treatment) and without (control groups) a superstar. Exploiting fundamental changes in the institutional environment, I make an attempt to estimate the effect of changes in superstar dominance on team decisions. Since basketball’s introduction to the Olympics in (Berlin), the United States (U.S.A), by far, represents the most successful nation. From
, men’s Team U.S.A has suffered only
(
%) losses in
games at the Olympics, making it rational to assume that Team U.S.A will win every game it plays. The superstar status of Team U.S.A has changed over time, most notably due to a fundamental reform coming into effect at the
Olympics. This reform allowed professional players from the most prolific professional US league to compete at the Olympics, so Team U.S.A can be expected to win every game. Simultaneous political changes substantially weakened the strongest competitors of Team U.S.A.
Promotion procedures in firms are often designed as rank-order tournaments (Baker, Jensen, and Murphy Citation1988; Ehrenberg and Bognanno Citation1990; Waldman Citation2013) in order to find the most able candidate, while maximizing total effort of contestants. Superstar effects are relevant when incentive performance-based payment schemes in firms are implemented. Procurement auctions are designed to find the most (cost) efficient provider, while fostering competition in the particular market. Therefore, it is important to investigate how individual competitors or teams react to competing with a superior competitor.
Understanding effort and risk-taking by teams in highly heterogeneous competitions is also important in politics. Election campaigns are often fought between parties and interest groups rather than between individual candidates. Parties allocate resources (effort) and decide on the risk level of campaigns (Hamilton and Romano Citation1998; Klumpp and Polborn Citation2006; Kräkel, Nieken, and Przemeck Citation2014). The same applies to patent races or innovation processes (Boudreau, Lacetera, and Lakhani Citation2011). Designers of sports contests have to consider superstar effects in order to maintain a certain level of overall competitiveness. More generally, any competition among firms could be influenced by the vast superiority of one firm, which could lead to undesirable and inefficient outcomes (Chan, Li, and Pierce Citation2014).
Due to a lack of data or ideal conditions, there is still relatively little and inconclusive non-experimental evidence of superstar effects. Ammann, Horsch, and Oesch (Citation2016) find that competition with superstar CEOs has an incentive effect for other firms, as these firms then increase their stock market performance. Superstar presence in sports, however, is a well-known phenomenon (Jane Citation2014). Matthews, Sommers, and Peschiera (Citation2007) find that superstar presence reduces the effectiveness of financial incentives in competitions. Brown (Citation2011) demonstrates that the presence of a superstar reduces the performance of other competitors in top-level golf competitions. This effect diminishes in contests where the superstar is less dominant, so different degrees of superstar dominance may matter. In top-level gymnastics, Meissner, Rai, and Rotthoff (Citation2021) find a negative effect of superstar presence on performance and risk-taking.
The negative superstar effect in professional golf, however, is contested (Connolly and Rendleman Citation2016). Babington, Goerg, and Kitchens (Citation2020) find no robust superstar effect on performance in golf or skiing. Jane (Citation2014) finds a positive peer effect in swimming contests. Hill (Citation2012), Emerson and Hill (Citation2014), and Hill (Citation2014) find similar results for -metre sprinters in top-level track and field competitions. The absence of a sufficiently dominant superstar in these contexts could explain these findings.
Decision by teams in competitions may differ from individuals’ decisions. Teams provide the opportunity for free-riding, potentially reducing individual effort even more when the expected probability of winning is low. Lackner et al. (Citation2020) find that teams with free-rider potential respond strongly to heterogeneity in dynamic competitions. In contrast, within-team communication can be a disciplinary device (Sutter and Strassmair Citation2009), creating incentives for team members to increase effort. Kocher and Sutter (Citation2005) or Charness and Sutter (Citation2012) show that teams or groups of individuals can be more efficient decision makers than individuals. Investigating team decisions in contests with a dominant superstar will shed additional light on potentially countervailing effects.
My estimates confirm the effort-reducing effect of superstar presence in team contests with one clearly dominant competitor. Increasing superstar dominance will result in reduced effort for other competing teams. For tournaments without a clear superstar (or multiple superstars), I estimate the positive effect of superstar presence. I also estimate a significant effect of superstar presence on risk-taking of teams.
2. Data and institutional background
I draw on novel data for all first-stage round-robin games of Olympics and World Cup basketball tournaments from
–
, covering a total of
team-game level observations from
games in the highest level of international basketball competition.Footnote3 As the performance and decision-making of Team U.S.A will directly affect my estimates, I do not include games with Team U.S.A participating in my analysis. Data reflect box scores, provided by the Federation Internationale de Basketball (FIBA), the governing organization of international basketball.Footnote4 For years after
, when FIBA introduced the three-point attempt, box scores provide information on three-point attempts.
The Olympics (Barcelona) mark a key point of change in international basketball, as FIBA allowed professional players from the National Basketball Association (NBA) to compete at the Olympic and World Cups. Before
, only non-professional players were allowed to compete. The talent pool of Team U.S.A expanded dramatically, resulting in a substantial boost of dominance for Team U.S.A.
Team U.S.A’s superstar status was also reinforced by a second development. Prior to , it had strong competition from the Soviet Union and YugoslaviA. Due to political upheavals, the Soviet Union participated for the last time in the
Olympics, Yugoslavia in
. The newly formed national teams had to select their players from a much smaller talent pool, which permanently weakened them.
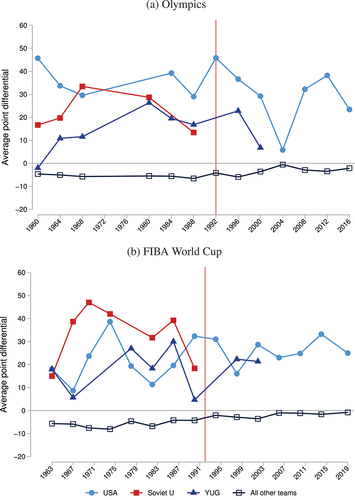
plots average winning margins for first-round round-robin games –
for the Soviet Union, Yugoslavia, U.S.A, and all other teams. The dominant position of Team U.S.A was contested by the Soviet Union and Yugoslavia before
. After
, Team U.S.A’s average point margin is characterized by more significant dominance, more so at Olympic Games than at FIBA World Championships.
Figure 1. Average point differentials: Team UAS and main competitors.
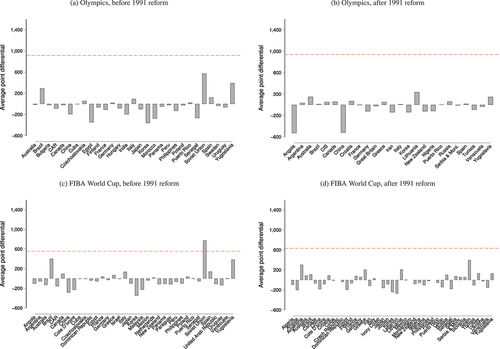
plots the cumulative point-differentials for all teams that participated in the Olympics tournaments (panels (a) and (b)) and FIBA World Cups (panels (c) and (d)) before and after . Again, Team U.S.A stood out after the
Olympics (panel (b)), and was henceforth nicknamed ‘dream team’ after dominating in previously unknown fashion. This dominant position is less clear for FIBA World Cups. Since
, Team U.S.A has won the gold medal in all but three Olympic basketball tournaments the team was competing in.Footnote5 However, Team U.S.A only finished
out of
FIBA World Cups in first place. In the
edition of the tournament, the US team finished only seventh out of
teams.
One possible reason for Team U.S.A’s lower dominance is the lower profile of this tournament: participating players receive lower financial compensation, worldwide media exposure is lower, and the prestige of a World Cup win is significantly lower than that of an Olympic win. I will take advantage of this difference and compare two competitions with different levels of superstar dominance. In principle, the FIBA World Cup tournaments can be considered as a kind of control or comparison group, since no significant superstar effect can be expected at these tournaments due to the lack of Team U.S.A dominance.
In the s, the vast majority of NBA players were of US nationality (Yang and Lin Citation2012). Team U.S.A’s supremacy may have weakened over time as the number of international players in the NBA steadily increased. At the same time, the quality of leagues around the world improved as basketball became more global.
3. Empirical approach and results
To measure effort of contestants, Berger and Nieken (Citation2014) use -minute penalties in handball, Nieken and Stegh (Citation2010) use two-minute penalties in hockey, and Deutscher et al. (Citation2013) focus on fouls and fair tackles to investigate positive and destructive effort in soccer. Lackner et al. (Citation2020) use personal fouls to measure effort in professional basketball. Their empirical results support the validity of personal fouls as an indicator of effort in basketball.
I use personal fouls by player-minute as the primary measure of team effort. Personal fouls will positively correlate with the defensive intensity. On the margin, higher defensive intensity should result more often in personal fouls due to more physical and intense defensive play. Defensive intensity will translate into turnovers and mistakes by the opposing team. Even when interpreted as sabotage (destructive effort), personal fouls still indicate a particular type of effort aimed at winning the game. Consequently, I consider personal fouls a valid indicator for effort in basketball. While Lackner et al. (Citation2020) provide a detailed discussion of fouls as an effort measure in basketball, my data do not allow investigating the link between fouls and win probabilities.
I refrain from using alternative effort proxies like (offensive) rebounds, assists, turnovers, or steals. These measures are much more problematic because they are all directly affected by the interaction of the two teams and consequently depend on relative effort. In addition, steals, turnovers, and (total) rebounds are not available for a substantial fraction of early tournaments in the sample period. Historical FIBA box score data only provide only basic performance statistics like points scored, personal fouls, throwing attempts, and minutes played. They lack sufficient information to construct ‘more modern’ effort proxies as used for NBA analytics (e.g. Floor Impact Counter). Section 4 presents results for three alternative (second-best) effort measures.
Information about the timing or type of fouls (offensive, defensive, or technical) is not available, making it impossible to exclude strategic end-of-game fouls or offensive fouls. Fouls could be a last resort when facing a far superior opponent, which makes it necessary to exclude all games involving Team U.S.A.
Multiple proxies for risk-taking in competitions have been considered: Risky shots in golf (Brown Citation2011), false starts in swimming (Jane Citation2014), strategic passes in jumping competitions (Böheim and Lackner Citation2015), pre-announced weights in weightlifting (Genakos and Pagliero Citation2012), the riskiness of a routine in gymnastics (Meissner, Rai, and Rotthoff Citation2021), or the relative frequency of three-point attempts in professional basketball (Grund, Höcker, and Zimmermann Citation2013; Böheim, Freudenthaler, and Lackner Citation2016, Citation2019). I measure risk-taking by the ratio of three-point attempts over two-point attempts. Although expected returns are identical, the variance in yield of a three-point attempt is larger than the one of a two-point attempt (mean-preserving spread).
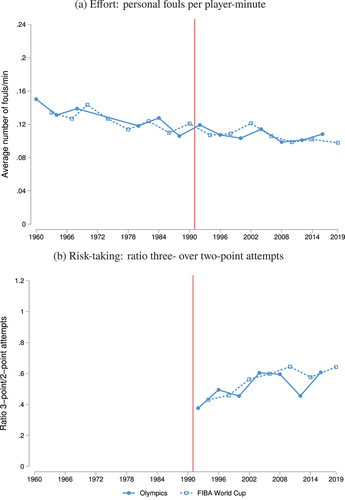
Panel (a) of indicates a downward trend for fouls per player-minute, but no structural break at FIBA’s reform. This erases potential concern that referees’ approach in the presence of NBA players may have changed. Panel (b) illustrates the relative frequency of three-point attempt after
. Three-point attempts become more frequent over time, reflecting their increasing importance in professional basketball.
Figure 2. Effort and risk-taking over time.
Since , international basketball contests resemble multi-stage tournaments. After a first round-robin stage, a winning team is determined in further stages. Olympics feature a first round-robin stage with two groups (
groups in
). FIBA World Cups feature an initial round-robin stage of
groups until
, and
, or even more, parallel groups in later years. Multiple teams advance from the initial group stage into later stages in both formats.
Teams seeded into the group of Team U.S.A should be affected by superstar presence. The main objective of any seeding procedure is to distribute teams equally into groups in terms of abilities. No group in round-robin competition should stand out in terms of average team seed. Seeding in international basketball is done according to FIBA rankings. Detailed information is only available for six tournaments from –
. During that period, the average FIBA ranking for groups with Team U.S.A is
,
for all other groups. The difference of
is not significant (p-val.
).
I do not expect a different picture for tournaments before . Seeding according to FIBA rankings ensures equally talented round-robin groups. Qualification into the next round will be independent of the group assignment. However, teams competing in a group with Team U.S.A have a significantly lower probability to qualify for the next round, as one qualifying spot for the next round is likely reserved for Team U.S.A. This ‘static’ (direct effect) within-group heterogeneity effect will be amplified by a dynamic forward-looking effect: The next opponent(s) for any team qualifying for the next round ranked behind Team U.S.A will be stronger, as the qualifying ranking will be lower due to the presence of Team U.S.A (indirect effect). Even if teams do qualify, they will face a stronger opponent in the next round. The second prize (qualifying behind Team U.S.A) loses value, reinforcing the negative superstar effect (Szymanski and Valletti Citation2005). Consequently, my estimates of the superstar effect are likely an upper bound.
I will consider all teams in the same groups as Team U.S.A as treated, that is, as affected by the presence of a more or less dominant superstar team. All other groups will act as control groups. To avoid bias from superstar team’s effort, which is likely to be low due to superior skill, or from Team U.S.A’s direct opponents, all matches involving Team U.S.A are excluded from the analysis.
3.1. Superstar presence and effort - fixed-effects approach
To account for possible unobserved heterogeneity, I first use a fixed-effects approach. I estimate the following model to measure association between superstar presence and effort:
where measures effort in terms of personal fouls per minute played for team-game
, in tournament
, and team-decade
.
is equal to
if the observed game is played in the same round-robin Team U.S.A competes in,
otherwise. Team-decade fixed-effects
control for unobserved team heterogeneity.Footnote6
Round-robin games vary in their relevance to competing teams. Some games are irrelevant to both teams (e.g. when a team is already eliminated), while others are highly relevant. Consequently, vector includes a continuous variable controlling for the win percentage before the observed game, the total number of games played, and binary variables indicating interactions between the probability of advancing in the group stage and the number of wins the observed team has less than the team with the most wins within the group. Since
is measured on the team-game level, I estimate standard errors clustered on the game level.
measures the changes in effort associated with competing in a group with Team U.S.A, while
, measures this association after the reform of
.
I also split the sample into tournaments where Team U.S.A was a weak or strong superstar (Brown Citation2011). Effort-reducing superstar effects should be strong when Team U.S.A was the dominant team. Consequently, I estimate an alternative specification of Model 1, with an interaction of and a binary variable indicating if Team U.S.A was perceived as weak in tournament
.Footnote7
Results from Model 1 are presented in . I estimate effort of teams competing in group U.S.A of Olympic tournaments to be fouls by player-minute higher than for teams in other round-robin groups (col. 1). In Olympic tournaments after
, teams seeded together with the superstar team exerted significantly less effort (
fouls per player-minute). This indicates a net-decrease in effort due to the strengthened superstar status of Team U.S.A after the reform of
. I estimate similar but weaker and insignificant association for FIBA World Cup tournaments (col. 2).
Table 1. Association of competing with a superstar and effort.
Splitting all Olympic tournaments after into events where Team U.S.A was either dominant or weak, I estimate a negative association of superstar presence of
personal fouls per player-minute. The estimated coefficient
is significant and positive (
-% level) at
(col. 3). So I estimate no decrease in effort for Olympic tournaments with a weak superstar, even after the reform of
. For FIBA World Cup tournaments, I find no association between superstar presence and effort, regardless of Team U.S.A’s level of dominance (col. 4).
3.2. Risk-taking
Empirical evidence on superstar effects on risk-taking in tournaments is scarce. Meissner, Rai, and Rotthoff (Citation2021) find a negative effect of superstar presence on risk-taking in top-level gymnastics. Investigating risk-taking in golf, Brown (Citation2011) finds no effects of superstar presence on risk-taking of contestants. Also, Hill (Citation2014) finds no superstar effects on risk-taking in top-level metre sprints. I analyse the effect of superstar presence on teams’ risk-taking in round-robin contests, focusing on the ratio of three-point to two-point throwing attempts (Grund, Höcker, and Zimmermann Citation2013). The higher this ration, the higher the associated risk. Teams move from the easier two-point attempts towards more risky three-point attempts. Three-point attempts were introduced by FIBA in
, and few box scores provide information before
. Consequently, I analyse teams’ risk-taking for tournaments after
by estimating
where is the ratio of three-point over two-point attempts from the field for team-game
, team-decade
, and tournament
.
is a binary variable indicating if the observed game is played in the round-robin group of Team U.S.A.
is equal to
if Team U.S.A is weak in the observed tournament
,
otherwise.Footnote8
includes teams’ win percentage before the observed game, the number of games played, and binary variables indicating interactions of the probability to advance to the next stage and the number of wins the observed team has accumulated less than the team ranked first in the group. Team-decade fixed-effects
account for unobserved team heterogeneity. Standard errors are clustered on the game level.
presents the results. The estimated coefficient indicates a negative and significant baseline association for competing in a group with Team U.S.A and risk-taking of
for Olympic tournaments (col. 1). For the interaction of competing in the group of Team U.S.A and the weak Team U.S.A dummy (
), I estimate a sizable positive association of
(significant at the
-% level). This is equivalent to a decrease in risk-taking of about
at the sample mean. Teams reduce risk-taking when seeded into the same group as the superstar team. Teams, however, increase risk in the presence of a weak superstar.
Table 2. Association of competing with a superstar and risk-taking.
For FIBA Wold Cups, I estimate a of
, however not statistically significant (col.
). I estimate no significant association for the interaction term for tournament with a weak superstar team. For the pooled sample, I estimate only a negative baseline association of
(significant at the 5-% level), as teams decrease risk-taking when competing in the same round-robin group as the superstar (col.
).
These results are consistent with Kräkel (Citation2008) who shows that it can be optimal for underdogs (e.g. non-superstars) to maximize win probabilities by reducing risk-taking (reversed likelyhood effect).Footnote9 This holds under the assumption of uneven tournaments, where competitors have different abilities, different cost-of-effort functions, and different preferences of winning. I consider this a plausible assumption, as teams have different effort costs and different preferences on what they consider a successful performance. Teams with less financial resources and a small staff of trainers may have a higher risk of injury or take longer to recover. While a strong team like Spain can only count a tournament win or reaching a later stage as a success, smaller nations should be satisfied with their participation.
Risk-taking is typically assumed to be costless with no additional negative consequences. In basketball, however, teams do have something to lose. Inferior tournaments performances will affect their FIBA rankings and impose costs on teams with who fail to meet performance standards. Thus, excessive risk-taking should not be the dominant strategy, as it is likely not costless.
Assuming that international basketball tournaments do resemble uneven tournaments, combined with the fact that overly excessive risk-taking will induce costs for underdogs, it is plausible to expect decreasing risk-taking for teams in the presence of a superstar. This may, however, change, if the level of superstar dominance decreases, as teams will increase risk to seize their increase chances to win the contest.
3.3. Change in Superstar Dominance and Effort
Section 3.1 demonstrates a negative association of superstar presence and effort or risk-taking, which is stronger in the presence of a more dominant superstar. Now I examine the effect of a substantial increase in superstar dominance on effort of Team U.S.A’s direct competitors by exploiting the FIBA’s reform by estimating the following difference-in-differences (DiD) model
where measures personal fouls per player-minute for team-game
, in tournament
.
is equal to
if game is played in the same round-robin group as Team U.S.A,
otherwise.
is equal to
if tournament
is observed after
,
if before.
includes the same control variables as in Section 3.1. I also estimate a dynamic version of Model 3:
where is a vector of binary variables indicating all three decades after the reform in
. The coefficients of interest
,
, and
measure the effect of the reform on effort of treated teams relative to the control group of teams not competing in the same group a Team U.S.A. Again, games with Team U.S.A competing are excluded. The timing (decades) is defined in analogy to Sections 3.1 and 3.2.
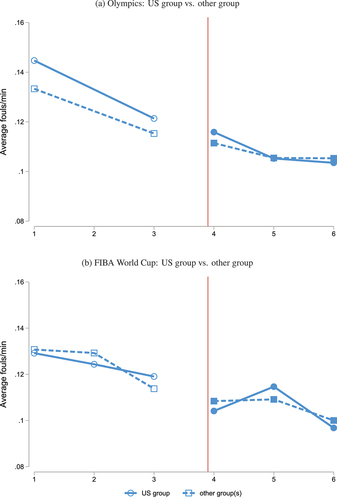
Plotting personal fouls per player-minute over time intervals around the reform in
, and 4 does not reject the parallel trend assumption. For further validation, I estimate an event-study version of Model 4 with pre-trends. The results presented in in the Appendix provide no evidence to reject the parallel trend assumption. Although my DiD approach is the best available approach for identifying a causal effect, one must be careful. Teams will change over time, as coaches and players are likely to be part of the national team for only a relatively small number of international tournaments.
Figure 3. Effort of treated and non-treated teams before and after the FIBA reform.
presents the results for models 3 and 4 for Olympics and FIBA World Cups from –
. Columns (
)–(
) present the effect of the
reform on effort for Olympic tournaments. Including all controls, I measure a significant and sizable negative effect of
fouls per player-minute in the static model (col.
) (
% on the sample mean). Compared to the reference period
–
, the dynamic specification yields no significant effect on teams’ effort when competing with the superstar after the reform in
–
. I estimate a significant negative effect of increased superstar dominance of
(
%) in
–
, and
(
%) for years
–
. The increase in superstar dominance needed one decade to develop a significant negative effect on effort of other competing teams. This effect is not weakening over time, although the number of international players competing in the NBA and contributing to national teams steadily increased.
Table 3. Effect of 1991 reform on effort – difference-in-difference estimates.
All estimated coefficients are insignificant and quantitatively close to for the FIBA World Cup sample (cols.
,
, and
). The dominance of Team U.S.A was much less developed in these tournaments. As three-point attempt statistics are unavailable for most tournaments before
, estimating Model 3 with a focus on risk-taking is not feasible.
4. Sensitivity analysis
Following previous attempts (Nieken and Stegh Citation2010; Deutscher et al. Citation2013; Berger and Nieken Citation2014; Lackner et al. Citation2020), I use personal fouls to measure effort. Estimating the effect of personal fouls on the probability of winning, and thus validating this effort measure, is difficult. Effort is endogenous and, thus, affected by intermediate scores and hence the probability of winning.
Personal fouls can also be interpreted as destructive effort or sabotage (Deutscher et al. Citation2013; Deutscher and Schneemann Citation2017). Both, however, are related: A foul, aimed at stopping the opponent from scoring as the only possible way left, does represent effort. In basketball, a high number of fouls is observed towards the end of games. These fouls are aimed at stopping the clock, which is a particular type of effort and the only way to keep chances of a win alive.
To test the robustness of my results, I introduce three alternative measures of effort. First, I use two proxies for (overall) offensive effort: The number of points scored by each team and the total number of points in the game. In addition, I introduce the number of throwing attempts from the field per player-minute for the observed team.Footnote10 Similar to points scored, the higher the number of throwing attempts, the higher is arguably a team’s (offensive) effort. All three statistics resemble second-best measures of team effort, as they are – to a large degree – resulting from efforts of both teams. Consequently, these statistics partly measure intermediate output rather than effort.
presents the results of estimating Model 1 with all three alternative effort measures, which confirm a negative superstar effect in Olympic tournaments. Male teams exert less effort (i.e. they score less) when grouped together with Team U.S.A after . Before the reform, I estimate a significant and positive peer effect of superstar presence (cols.
and
). For throwing attempts, I estimate a significant negative association between effort and superstar presence for post-
Olympics (col.
). For FIBA World Cup tournaments, I do not measure any significant associations (cols.
,
and
).
Table 4. Association of competing with a superstar and effort – alternative effort measures.
The approach presented in Section 3.1 relies on team-decade fixed-effects to control for unobserved team heterogeneity. Instead of team-decade fixed-effects, I estimate an alternative specification, including team and tournament fixed-effects. While yielding slightly different results in terms of magnitude of coefficients, all estimates presented in Sections 3.1 and 3.2 are confirmed. The corresponding tables are presented in (effort) and (risk-taking) of the Appendix.
5. Discussion and conclusion
Using novel data from international basketball competitions, I document Team U.S.A’s superstar status in mens’ basketball. Team U.S.A’s dominance of the Olympics and FIBA World Cups changed over time and was exacerbated by institutional reform.
Using a fixed-effects approach, I estimate a positive baseline association between superstar presence and effort. This association is reversed when superstar status of Team U.S.A was amplified in and afterwards. I estimate a significant decrease in effort for inferior teams that compete with the superstar team for post-
Olympics when Team U.S.A became more dominant. For FIBA World Cups, a tournament format where Team U.S.A was always less dominant, I find no indication of a superstar effect. Estimates from a diff-in-diff approach indicate a sizable negative effect of increased superstar dominance on effort of non-superstar teams after
.
I estimate a decrease in risk-taking of teams when competing with a strong superstar. For tournaments where Team U.S.A was weak, however, risk-taking of non-superstar teams increases. Again, I do not estimate a significant association of superstar presence and risk-taking for FIBA World Cups.
I provide first evidence on superstar effects in team competitions. My results confirm previously inconclusive (Connolly and Rendleman Citation2016; Babington, Goerg, and Kitchens Citation2020) and scarce evidence of a superstar effect on effort and risk-taking in non-experimental settings. I also find that superstar effects strongly depend on the degree of dominance of the superstar team. My estimates indicate that teams are unlikely to be able to serve as a means of mitigating potentially undesirable superstar effects.
These insights are relevant whenever groups or teams compete with each other: in intra- and inter-firm competition, in the design of election campaigns, or in competitions for innovations or patents. Although competitions of this type resemble international basketball tournaments in some respects, they differ in that while there may be direct competition with a dominant competitor, the typical dynamic structure of tournaments is typically not observed. However, in all similar competitions, ranked tournaments may still not provide optimal solutions in the presence of a superstar. Non-superstars will reduce their efforts if the superstar is sufficiently dominant, making the tournament design inefficient. However, if the superstar is less dominant, its effort is likely to increase.
I estimate that teams reduce risk-taking when competing with a dominant superstar. In the presence of a weak superstar, however, teams will take substantial risks to make up for deficits in abilities. These insights are of high relevance for environments where the willingness to incur risks is critical. For example, groups in financial markets may increase risk in reaction to dominant competitor.
Acknowledgement
I am grateful for funding by the Austrian National Bank, project number . Helpful comments by René Böheim, Brad Humphreys, Hendrik Sonnabend, Michael Weichselbaumer, as well as an anonymous reviewer are gratefully acknowledged. The usual disclaimer applies.
Disclosure statement
No potential conflict of interest was reported by the author.
Additional information
Funding
Notes
1 Scottie M. Pippen, member of the first men’s US basketball team which was nicknamed ‘Dream Team’ and dominated competition at the Olympic Games in BarcelonA. Retrieved November 11, 2021. http://www.nbA.com/bulls/history/pippen-recalls-dream-teams-journey-gold.html.
2 Effects of heterogeneity in abilities on effort in dynamic elimination contests (Sunde Citation2009; Ryvkin Citation2013; Stracke and Sunde Citation2014; Stracke et al. Citation2015; Brown and Minor Citation2014) or rank-order contests (Franke Citation2012; Deutscher et al. Citation2013; Berger and Nieken Citation2014) is well documented.
3 The Olympics (Munich) were hit by a terror attack, resulting in boycotts and withdrawals. In the
Olympics (Montreal) Team U.S.A and the Soviet Union were seeded into the same group. Also in
, Egypt withdrew after one game, severely affect the natural experiment observed. Consequently, the Olympic Games of
and
are not used.
4 All information and box scores for both types of tournaments are available at https://archive.fiba.com.
5 Team U.S.A did not win a gold medal in (Munich),
(Seoul) and
(Athens).
6 Decades are defined as [–
], [
–
], [
–
], [
–
], [
–
] and [
–
].
7 Team U.S.A is defined as weak in , when the NBA lockout resulted in lower-league players competing;
, when Team U.S.A lost preparation games before the Olympics (Athens) and played poorly throughout the tournament; the
FIBA World Cup, where Team U.S.A finishing only
; the
World Cup, after poor outings at the
World Cup and the
Olympics; and the
World Cup after when Team U.S.A was seeded
after multiple losses before the tournament and had a historically bad performance.
8 Consult Section 3.1 for the categorization of .
9 Kräkel (Citation2008) assumes heterogeneity in utility functions of contestants, which is plausible professional basketball teams. Teams likely have different objectives: Team U.S.A will only consider the title win a success, less able teams will have an incentive to give their best, and – at least – improve their FIBA ranking to qualify for future tournaments.
10 This approach is restricted to the years after . Official FIBA box score statistics before
do not report throwing attempts on a regular basis.
References
- Ammann, M., P. Horsch, and D. Oesch. 2016. “Competing with Superstars.” Management science 62 (10): 2842–2858. doi:10.1287/mnsc.2015.2266.
- Babington, M., S. J. Goerg, and C. Kitchens. 2020. “Do Tournaments with Superstars Encourage or Discourage Competition?” Journal of Sports Economics 21 (1): 44–63. doi:10.1177/1527002519859405.
- Baik, K. H. 1994. “Effort Levels in Contests with Two Asymmetric Players.” Southern Economic Journal 61 (2): 367–379. doi:10.2307/1059984.
- Baker, G. P., M. C. Jensen, and K. J. Murphy. 1988. “Compensation and Incentives: Practice Vs. Theory.” The Journal of Finance 43 (3): 593–616. doi:10.1111/j.1540-6261.1988.tb04593.x.
- Bar-Eli, M., A. Krumer, and E. Morgulev. 2020. “Ask Not What Economics Can Do for Sports-Ask What Sports Can Do for Economics.” Journal of Behavioral and Experimental Economics 89: 101597. doi:10.1016/j.socec.2020.101597.
- Berger, J., and P. Nieken. 2014. “Heterogeneous Contestants and the Intensity of Tournaments an Empirical Investigation.” Journal of Sports Economics 17 (7): 631–660. doi:10.1177/1527002514538639.
- Böheim, R., C. Freudenthaler, and M. Lackner (2016), ‘Gender Differences in Risk-Taking: Evidence from Professional Basketball’, IZA Discussion Papers .
- Böheim, R., C. Freudenthaler, and M. Lackner (2019), ‘Do Male Managers Increase Risk-Taking of Female Teams? Evidence from the NCAA’, CESifo Working Papers.
- Böheim, R., and M. Lackner. 2015. “Gender and Risk Taking: Evidence from Jumping Competitions.” Journal of the Royal Statistical Society: Series A (Statistics in Society) 178 (4): 883–902. doi:10.1111/rssA.12093.
- Boudreau, K. J., N. Lacetera, and K. R. Lakhani. 2011. “Incentives and Problem Uncertainty in Innovation Contests: An Empirical Analysis.” Management science 57 (5): 843–863. doi:10.1287/mnsc.1110.1322.
- Brown, J. 2011. “Quitters Never Win: The (Adverse) Incentive Effects of Competing with Superstars.” The Journal of Political Economy 119 (5): 982–1013. doi:10.1086/663306.
- Brown, J., and D. B. Minor. 2014. “Selecting the Best? Spillover and Shadows in Elimination Tournaments.” Management science 60 (12): 3087–3102. doi:10.1287/mnsc.2014.2014.
- Chan, T. Y., J. Li, and L. Pierce. 2014. “Compensation and Peer Effects in Competing Sales Teams.” Management science 69 (8): 1965–1984. doi:10.1287/mnsc.2013.1840.
- Charness, G., and M. Sutter. 2012. “Groups Make Better Self-Interested Decisions.” Journal of Economic Perspectives 26 (3): 157–176. doi:10.1257/jep.26.3.157.
- Connolly, R. A., and R. J. Rendleman Jr. 2016. “When Superstars Compete: New Evidence They are Not so Super After All.” SSRN Electronic Journal SSRN Journal.
- Deutscher, C., B. Frick, O. Gürtler, and J. Prinz. 2013. “Sabotage in Tournaments with Heterogeneous Contestants: Empirical Evidence from the Soccer Pitch.” The Scandinavian Journal of Economics 115 (4): 1138–1157. doi:10.1111/sjoe.12036.
- Deutscher, C., and S. Schneemann. 2017. “The Impact of Intermediate Information on Sabotage in Tournaments with Heterogeneous Contestants.” Managerial and Decision Economics 38 (2): 222–237. doi:10.1002/mde.2771.
- Ehrenberg, R. G., and M. L. Bognanno. 1990. “Do Tournaments Have Incentive Effects?” The Journal of Political Economy 98 (6): 1307–1324. doi:10.1086/261736.
- Emerson, J., and B. C. Hill. 2014. “Gender Differences in Competition: Running Performance in 1,500 Meter Tournaments.” Eastern Economic Journal 40 (4): 499–517. doi:10.1057/eej.2014.28.
- Franke, J. 2012. “The Incentive Effects of Levelling the Playing Field–An Empirical Analysis of Amateur Golf Tournaments.” Applied Economics 44 (9): 1193–1200. doi:10.1080/00036846.2010.537646.
- Frick, B. 2003. “Contest Theory and Sport.” Oxford Review of Economic Policy 19 (4): 512–529. doi:10.1093/oxrep/19.4.512.
- Genakos, C., and M. Pagliero. 2012. “Interim Rank, Risk Taking, and Performance in Dynamic Tournaments.” The Journal of Political Economy 120 (4): 782–813. doi:10.1086/668502.
- Groh, C., B. Moldovanu, A. Sela, and U. Sunde. 2012. “Optimal Seedings in Elimination Tournaments.” Economic Theory 49 (1): 59–80. doi:10.1007/s00199-008-0356-6.
- Grund, C., J. Höcker, and S. Zimmermann. 2013. “Incidence and Consequences of Risk Taking Behavior in Tournaments: Evidence from the Nba.” Economic inquiry 51 (2): 1489–1501. doi:10.1111/j.1465-7295.2012.00499.x.
- Hamilton, J., and R. E. Romano. 1998. “Equilibrium Assignments in Pairwise Team Contests: How to Form Political Slates and Tennis Teams.” European Journal of Political Economy 1 (14): 101–114. doi:10.1016/S0176-2680(97)00042-6.
- Hill, B. C. 2012. “The Heat is On: Tournament Structure, Peer Effects, and Performance.” Journal of Sports Economics 15 (4): 337–515. doi:10.1177/1527002512461156.
- Hill, B. C. 2014. “The Superstar Effect in 100-Meter Tournaments.” International Journal of Sport Finance 9 (2): 111–129.
- Jane, W. -J. 2014. “Peer Effects and Individual Performance: Evidence from Swimming Competitions.” Journal of Sports Economics 26 (5): 531–539. doi:10.1177/1527002514521429.
- Klumpp, T., and M. K. Polborn. 2006. “Primaries and the New Hampshire Effect.” Journal of Public Economics 90 (6–7): 1073–1114. doi:10.1016/j.jpubeco.2005.08.009.
- Kocher, M. G., and M. Sutter. 2005. “The Decision Maker Matters: Individual versus Group Behaviour in Experimental Beauty-Contest Games.” The Economic Journal 115 (500): 200–223. doi:10.1111/j.1468-0297.2004.00966.x.
- Kräkel, M. 2008. “Optimal Risk Taking in an Uneven Tournament Game with Risk Averse Players.” Journal of Mathematical Economics 44 (11): 1219–1231. doi:10.1016/j.jmateco.2008.02.002.
- Kräkel, M., P. Nieken, and J. Przemeck. 2014. “Risk Taking and Investing in Electoral Competition.” European Journal of Political Economy 33 (March 2014): 98–120. doi:10.1016/j.ejpoleco.2013.12.003.
- Lackner, M., R. Stracke, U. Sunde, and R. Winter-Ebmer. 2020. “Are Competitors Forward Looking in Strategic Interactions? Field Evidence from Multistage Tournaments.” Journal of Economic Behavior & Organization 179: 544–565. doi:10.1016/j.jebo.2020.09.012.
- Lazear, E. P., and S. Rosen. 1981. “Rank-Order Tournaments as Optimum Labor Contracts.” The Journal of Political Economy 89 (5): 841–864. doi:10.1086/261010.
- Matthews, P. H., P. M. Sommers, and F. J. Peschiera. 2007. “Incentives and Superstars on the LPGA Tour.” Applied Economics 39 (1): 87–94. doi:10.1080/00036840601004143.
- Meissner, L., A. Rai, and K. W. Rotthoff. 2021. “The Superstar Effect in Gymnastics.” Applied Economics 53 (24): 2791–2798. doi:10.1080/00036846.2020.1869170.
- Nieken, P., and M. Stegh (2010), ‘Incentive Effects in Asymmetric Tournaments Empirical Evidence from the German Hockey League’, University of Bonn, SFB/TR15 Discussion Paper No .305.
- Rosen, S. 1981. “The Economics of Superstars.” The American Economic Review 71 (5): 845–858.
- Rosen, S. 1986. “Prizes and Incentives in Elimination Tournaments.” The American Economic Review 76 (4): 701–715.
- Ryvkin, D. 2013. “Heterogeneity of Players and Aggregate Effort in Contests.” Journal of Economics & Management Strategy 22 (4): 728–743. doi:10.1111/jems.12028.
- Stracke, R., W. Höchtl, R. Kerschbamer, and U. Sunde. 2015. “Incentives and Selection in Promotion Contests: Is It Possible to Kill Two Birds with One Stone?” Managerial and Decision Economics 36 (5): 275–285. doi:10.1002/mde.2666.
- Stracke, R., and U. Sunde (2014), ‘Dynamic Incentive Effects of Heterogeneity in Multi-Stage Promotion Contests’, IZA Discussion Paper No. 8368.
- Sunde, U. 2009. “Heterogeneity and Performance in Tournaments: A Test for Incentive Effects Using Professional Tennis Data.” Applied Economics 41 (25): 3199–3208. doi:10.1080/00036840802243789.
- Sutter, M., and C. Strassmair. 2009. “Communication, Cooperation and Collusion in Team Tournaments – an Experimental Study.” Games and Economic Behavior 66 (1): 506–525. doi:10.1016/j.geb.2008.02.014.
- Szymanski, S., and T. M. Valletti. 2005. “Incentive Effects of Second Prizes.” European Journal of Political Economy 21 (2): 467–481. doi:10.1016/j.ejpoleco.2004.07.002.
- Waldman, M. 2013. “Classic Promotion Tournaments versus Market-Based Tournaments.” International Journal of Industrial Organization 31 (3): 198–210. doi:10.1016/j.ijindorg.2012.02.003.
- Yang, C. -H., and H. -Y. Lin. 2012. “Is There Salary Discrimination by Nationality in the Nba? Foreign Talent or Foreign Market.” Journal of Sports Economics 13 (1): 53–75. doi:10.1177/1527002510391617.
Appendix
Table A1. Association of competing with a superstar and effort – alternative specification.
Table A2. Association of competing with a superstar and risk-taking – alternative specification.
Table A3. Effect of 1991 reform on effort – alternative event-study model.
Figure A1. Cumulative point differentials for all teams.