
 ?Mathematical formulae have been encoded as MathML and are displayed in this HTML version using MathJax in order to improve their display. Uncheck the box to turn MathJax off. This feature requires Javascript. Click on a formula to zoom.
Abstract
Children under 15 years spend over six hours per day in school buildings and are particularly vulnerable to the effects of poor indoor air quality (IAQ). However long-term monitoring of indoor environmental conditions is limited in Australian schools. This study evaluates IAQ in ten Australian school classrooms in the temperate settings of Victoria. Temperature, relative humidity, CO2 concentration, PM2.5 and PM10 were monitored over a period of one year. The temperature and relative humidity values in the monitored classrooms ranged between 18.7°C and 23.8°C and 44–63 RH%, respectively, indicating that the conditions have been mechanically controlled. The average air change (ACH) rates in the 10 school classrooms varied considerably (range: 0.7–4.83 ACH). The ventilation rates ranged from 1.6 Ls−1 to 11.5 Ls−1 per person with 7 out of the 10 classrooms showing ventilation rates below the recommended minimum. This study points to the need for increasing ventilation rates in classrooms.
Introduction
Given the growing awareness of the adverse impacts of poor air quality there is an increasing interest in improving indoor air quality (IAQ) in school buildings. Children under 15 years constitute approximately 19% of the Australian population (ABS Citation2019). Students in Years 1–12 receive a minimum of 25 h of instruction per week and spend up to 1075 h indoors in school classrooms each year (DET Citation2017). This equates to approximately 25% of an average lifetime (Cheryan et al. Citation2014). Poor IAQ can cause acute and chronic health effects, and vulnerable members of the community such as children are particularly susceptible to adverse respiratory effects (Annesi-Maesano et al. Citation2012; Clausen, Toftum, and Bek€o Citation2009; Fsadni et al. Citation2018; Madureira et al. Citation2015; Paciência et al. Citation2019; Simoni et al. Citation2010). In a review that studied the effects of particulate matter (PM) on young children, short-term exposure to PM was found to adversely impact respiratory health; and for long-term exposure, fine particles (e.g. PM2.5) represented a higher risk factor than coarse particles (e.g. PM10) (Liu et al. Citation2018). Chatzidiakou et al. (Citation2014), found that adverse health impacts such as respiratory disease and illness-related absenteeism were reported at concentrations of NO2, O3 and CO below the current guidelines. Palumbo et al. (Citation2018) investigated the effect of classroom conditions in Europe and found increased risks for allergy and flulike symptoms in hot classrooms in the heating season, and reduced frequency of allergy symptoms with perceived good outdoor air quality. Given the number of hours that children spend in school classrooms, there is a growing concern about the conditions of indoor air quality in school buildings and how it impacts student health, well-being and learning ability (Csobod et al. Citation2014; Wargocki and Wyon Citation2013). Furthermore, the on-going Covid-19 pandemic has brought about an increased focus on indoor air quality in schools due to the significance of viral transmission via small airborne microdroplets.
Poor air quality also impacts the cognitive performance of students. Studies conducted on the schools in United States found a significant relationship between student achievement and behaviour and the thermal environment of a classroom, where air-conditioned schools consistently reported higher achievement (Weinstein Citation1979; Young et al. Citation2003). In a recent meta-analysis of 18 studies that investigated classroom thermal conditions and children performance, Wargocki, Porras-Salazar, and Contreras-Espinoza (Citation2019) noted that children’s performance can increase by 20% if classroom temperatures are lowered from 30°C to 20°C. In a more recent review of relationship between air quality and learning outcome of children, Wargocki et al. (Citation2020) found 12% improvement in the speed and 2% improvement with respect to error in the performance of psychological tests when CO2 concentration was reduced from 2100 to 900 ppm. More recent thermal comfort studies of New South Wales’ schools in Australia found neutral and preferred temperature for children lower than the same for adults (de Dear et al. Citation2015). Previous studies on child health and pollution in Australia (Barnett et al. Citation2005; Knibbs et al. Citation2018) typically rely on exposures measured through outdoor stations which do not adequately characterize the personal exposure to indoor air pollutants. Laiman et al. (Citation2014) investigated the particle concentration of 25 naturally ventilated schools in the humid subtropical Brisbane and found that overall air change rates during school hours were higher than the acceptable guideline of 0.7/h by ANSI/ASHRAE Standard 62.1. The air change rate was higher during warmer months compared to colder months. However, in the cool temperate Victoria, high indoor CO2 concentrations (> 2700 ppm) were found during winter due to inadequate ventilation (Luther and Atkinson Citation2012). This is in agreement with the New Zealand studies where ventilation rates were found to be 16 times lower than the recommended value and CO2 concentrations exceeded 3500 ppm (Wang et al. Citation2016). Luther, Horan, and Tokede (Citation2018) assessed 24 classrooms from six different schools during the winter period and found that air change rates, carbon dioxide exhalation rate and the number of students in the classroom are the three most important parameters for the CO2 concentration of a school classroom during its occupancy. None of the Australian studies performed longitudinal measurements of air quality parameters. Moreover, there has been an increasing tendency to retrofit naturally ventilated classrooms with air conditioning units due to community complaints about thermal discomfort during the summer. This study addresses these gaps in the literature. It investigates IAQ factors (i.e. CO2, PM) in school classrooms in the temperate setting of Victoria.
Methods
Ten classrooms in five schools (classrooms A and B from schools S1, S2, S3, S4 and S5) were selected for the study. Out of the five schools, four (S1, S2, S3, S4) are primary schools and one secondary school (S5). The study received ethics approval from the University and Department of Education and Training. This study did not include student perceptions of air quality using a questionnaire although subjective assessment through monitoring of student attention and concentration was part of the study. However, the focus of this paper is IAQ assessment through objective measurements. The IAQ parameters of air temperature, relative humidity, carbon dioxide (CO2) concentration levels, PM2.5 and PM10 concentration levels were continuously monitored for one school year from February to December 2019. Both long-term (i.e. one year) and weekly measurements were conducted. For the long-term monitoring, battery-operated data loggers (HOBO MX1102) were used and set to 15-minute sampling intervals (ASHRAE Citation2009). The sensors on these loggers were air temperature, relative humidity, carbon dioxide (CO2) concentration levels and the unit was placed on a wall at least 2m from the closest student table (DIN Citation2007) away from doors and windows, and installed at 1.2–1.5 m high close to breathing zone height of students and not directly underneath supply air diffusers. All the sensors were co-located in a room for cross comparison of their measurements and assess their consistency and reliability. Particulate matter was also monitored for one week during each of the four school terms (representing summer, autumn, winter and spring seasons) using an Aerocet handheld particle counter Model 531S. The datalogger, installed close to the HOBO datalogger at 1.0–1.2 m high, was programmed to record data at 15-minute sampling intervals. A TSI DustTrak 8533 was also placed adjacent to the Aerocet at table-top height of 0.85 mm, to provide comparative data and set the k factor required for Aerocet particle counter. Figure shows the typical setup in the classroom. Instrumentation specification is shown in Table and typical layout of equipment set up in the classroom is shown in Figure S1 in the supplementary files.
Figure 1. Typical equipment set up in the classroom.
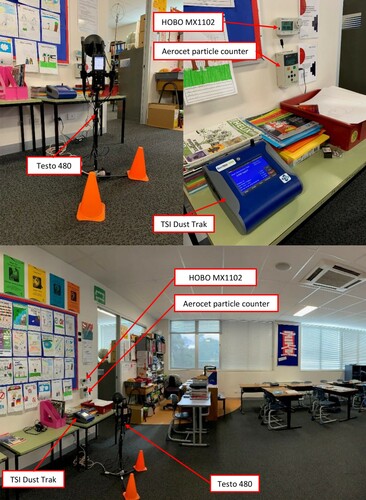
Table 1. Instrument specifications.
The air change rate (ACH) for each term was calculated. Three different methods namely build-up method, steady-state method and decay method are available for utilizing CO2 as a tracer gas for determining the air exchange rate in a given space (Hänninen Citation2013). At very low air change rates (which may be the case for some of the classrooms in this study), it can take long time to reach the steady state. However, for consistency across the school classrooms, the steady-state method was used for calculating the ACH in each classroom. Steady-state method uses the peak-analysis approach based on a mass balance model (Seppänen Citation2006; ASTM Citation2018; Roulet and Flavio Citation2002) as shown in Equation (1). The peak-analysis approach assumes that CO2 concentration reaches steady state in classrooms.
(1)
(1) where a = air change rate, h−1 N = number of people (occupants) in the space g = indoor CO2 generation rate per person, mLs−1 V = space volume, m3 Cs = Final (steady-state) CO2 concentration in the space, ppm Co = CO2 concentration in outdoor air.
In this study, the average CO2 concentration recorded in the classrooms during the school hours was used as the steady-state value of CO2 (Cs). CO2 concentration at Cape Grim (BoM and CSIRO Citation2018), was used as base outdoor concentration (Co). The values recorded at Cape Grim is 407 ppm (BoM and CSIRO Citation2018), and this is found to be equivalent to urban concentrations in Melbourne based on measurements conducted in 2004 by Coutts, Beringer, and Tapper (Citation2007). The CO2 generation rates of 0.00285 Ls−1 for children and 0.0052 L/s−1 for the teachers in the occupied classrooms were taken according to ASTM D6245 (Citation2018). These CO2 generation rates correspond to the average ages of 6–11 for students and 21–50 for the teachers, with an activity level 1.2 met (ASTM Citation2018, Table , p5). The air flow rates in ls−1 were calculated from the ACH.
Participating schools
Four of the schools are located in Melbourne area at distances of 3, 7, 13 and 17 kms from the central business district (see Figure S2 in supplementary files). School S1 is in regional Victoria (85 km from Melbourne). The locations belong to Cfb climate as per Koppen–Geiger classification system. Table S1 (supplementary file) shows the external weather conditions corresponding to the four school terms. Monthly average, minimum and maximum air temperatures and relative humidity recorded at 9 am and 3 pm are reported in the table. School S1 is in a residential suburban area south of Geelong CBD. School S2 is located in a residential suburban area southeast of the CBD next to a busy thoroughfare and a bus stop. School S3 is in an inner-city residential area east of the CBD. Similar to S2, School S4 is located in the residential suburban area northwest of the CBD but next to a minor residential road. School S5 is in a residential suburban area north of Melbourne CBD. The five school buildings were built in the last 10–20 years and the building structure and construction are typical of the school building stock in terms of age, typology and construction specification.All schools are provided with a mechanical air conditioning system. Classrooms in S2 and S3 were also equipped with supplementary electric convection heaters. Table shows the physical properties including area, volume, construction details and type of ventilation systems in each of the classrooms.
Table 2. School classroom characteristics.
Results
Indoor thermal conditions
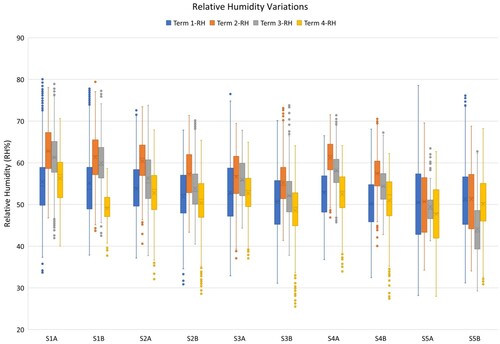
The school classrooms were continuously monitored for an academic year. The indoor air temperature and relative humidity of the 10 classrooms during school hours (from 9:00am to 3:30pm) across the four school terms are shown in Table S2. In Term 1, the average indoor air temperatures, were generally consistent across the 10 classrooms ranging from 21.8°C to 23.8°C with average relative humidity levels of 50–55 RH%. Lower average temperatures were measured in Terms 2 and 3, 18.9–21°C and 18.7–21.1°C, respectively, with corresponding humidity levels of 51–63 RH% and 44–61 RH%. Term 4 indoor conditions were similar to Term 1 with an average indoor temperature range of 20.1°C to 22.3°C and 49–56 RH%. The indoor air temperature and relative humidity profiles are shown in Figures and , respectively. The figure shows that the middle 50% of measured conditions for both indoor air temperatures and relative humidity levels are consistent across the four school terms in the 10 classrooms. Both mean and median measures are closely aligned. These indicate that the conditions in the monitored classrooms have been mechanically controlled.
Figure 2. Variations of air temperature in the school classrooms for four school terms during school hours (9:00am–3:30pm).
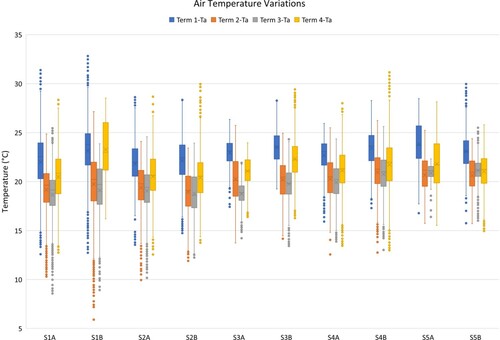
Figure 3. Variations of relative humidity in the school classrooms for four school terms during school hours (9:00am–3:30pm).
Air quality parameters
CO2 concentration levels
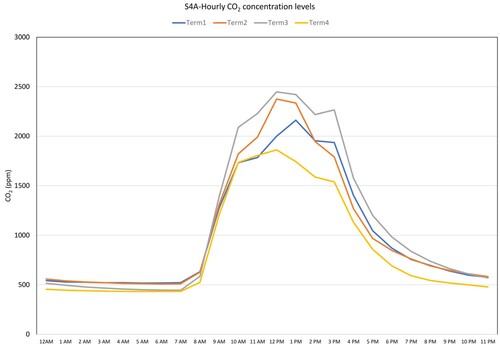
The CO2 concentration levels in the 10 classrooms across the four school terms are shown in Figure with mean values ranging from 657 to 2235 ppm (Table S2). The CO2 concentration levels varied significantly between the five schools with both classrooms in S3 and S5 showing the lowest levels, 912–1179 ppm in S3A and 925–977 ppm in S3B, 657–1019 ppm in S5B and 671–980 ppm in S5A, and similarly in S2B with 882–1247 ppm. Both classrooms in S4 showed the highest average CO2 concentration levels ranging from 1519 to 2235 ppm. However, all 10 classrooms showed maximum levels of CO2 concentrations over 1700ppm during school hours. The highest maximum CO2 concentration levels were recorded in both S4 classrooms ranging from 3415 to 5000 ppm across the four school terms. Both School S1 classrooms showed high maximum levels ranging from 3033 to 4216 ppm and both S2 classrooms also showed high maximum levels ranging from 1417 to 4195 ppm. Figures and show the hourly CO2 concentration levels averaged for each term for classrooms S3B (with lowest CO2 concentration levels) and S4A (with highest CO2 concentration levels), respectively. The concentration levels start building up from 9 am as classes begin and the highest levels were found during mid-day, just before the lunch break. Another peak was also observed around 3.30 pm just before school ends. These peak levels of CO2 concentration were similar across the five schools and typical in occupied schools. Based on the reported classroom occupancy and teacher records, operation of air conditioning systems, opening of windows as well leaving doors wide open may have contributed to the fluctuations and peak levels of the indoor CO2 concentration levels.
Figure 4. CO2 concentration levels in the school classrooms for four school terms during school hours (9:00am–3:30pm).
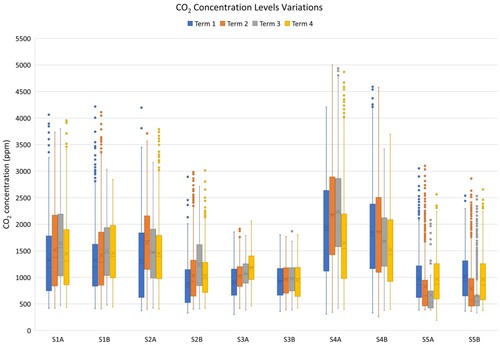
Figure 5. Hourly average CO2 concentration levels for S3B.
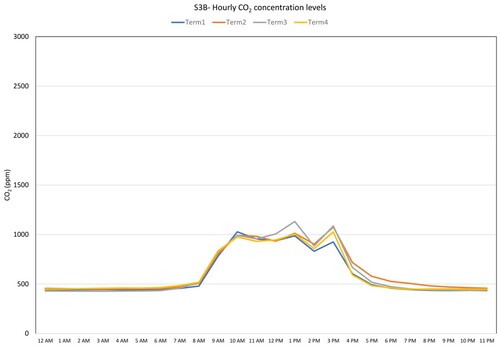
Figure 6. Hourly average CO2 concentration levels for S4A.
Calculation of ventilation rates
The six classrooms have floor area sizes ranging 55–81 m2 and volume of 165–220 m3 (Table ) occupied by 15–27 school children (Table ). The summary of the calculated air change rates (h−1) and air flow rates (l s−1) during school hours across the four school terms are shown in Tables and respectively. The calculated ventilation rates ranged from 0.7 ACH to 4.83 ACH. For S4 classrooms with the highest CO2 concentrations, the air change rates during the four terms were 0.7 ACH to 1.14 ACH. The S3B classroom in school S3 has air change rates of 2.85 ACH to 3.12 ACH. Highest ACH of 4.83 was observed in S5A classroom. The occupant behaviour in terms of opening and closing of doors and windows has a major influence on the ventilation rates. Windows and doors were left open in classroom S2B most of the time. Classroom S3B and S5A have the highest level of ACH rate throughout the year and as seen in Table . The teacher leaves the windows slightly open and also leaves the door to the corridors open most of the time for S2B and S3B enabling cross ventilation. Windows are closed in both S4A and S4B whereas doors are left open to the corridor in the first floor. This did not help in reducing the CO2 concentration levels. Comparing the ACH across the four terms, it can be seen that summer months (T1) have higher ACH than winter months (T3) in all the school classrooms except S5 which is a secondary school. In S5, both classrooms are situated in the ground floor. The doors which pen to outside are kept open frequently for students to move from one classroom to other during change of subjects.
Table 3. Calculated air change rates.
Table 4. Calculated ventilation rate values per student.
Table shows the ventilation rates per person. The average calculated ventilation rate per person ranged from 1.6 Ls−1 to 11.5 Ls−1. In comparison to the values found in a similar study in naturally ventilated classrooms in Brisbane (Laiman et al. Citation2014), the ventilation rates in this study were higher. However, ANSI/ASHRAE Standard 62.1 recommends 5 Ls−1·person as minimum ventilation rate for classrooms (ASHRAE Citation2016). The resulting ventilation rate per person in this study as shown in Table were <5 Ls−1 per student in majority of the classrooms except S5, indicating insufficient ventilation. School S4 shows average ventilation rates of 1.8–2.5 Ls−1 per student. Both classrooms in school S3 have ventilation rates ranging from 4.5 to 5.6 Ls−1 which marginally meet the minimum ASHRAE Standard 62.1 requirement. The classrooms in S3 also exceed the specified ventilation rate of 4 Ls−1 per child established in the SINPHONIE project (Csobod et al. Citation2014), whereas this specified rate marginally aligns with those found in S2, with average values ranging from 2.9 Ls−1 to 3.8 Ls−1.
Particulate matter
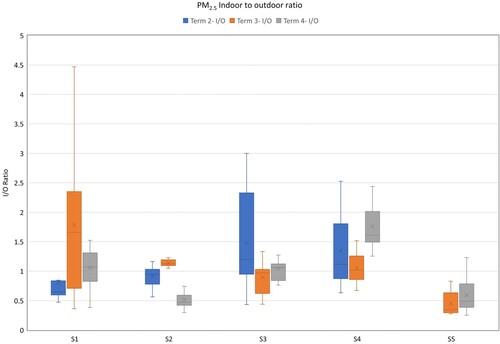
Figures and show the range of PM10 and PM2.5, respectively, during each one-week monitoring period. The PM levels varied considerably between the five schools. Mean PM2.5 levels ranged from 6.3 to 39.9 µg/m3 and mean PM10 levels ranged from 7.23 to 47.17 µg/m3 across the four terms. Term1 which is predominantly summer-autumn period showed higher levels of particles, particularly finer PM2.5 particles. External PM levels were also monitored for a day during Terms 2, 3 and 4 and the results are shown in Table S3 in supplementary files. The external weather conditions had significant influence on outdoor particle concentration levels and the lowest levels were observed during Term 2 (autumn/winter period) as a result of rainy days. The indoor–outdoor ratios (I/O) were calculated for room B in each school and this was estimated to be 0.5–4.5 and 0.2–16.6 for PM2.5 and PM10, respectively (Figures and ). The ratio was generally lower for S2 and S5 compared to S1, S3 and S4 suggesting lower indoor pollutant levels and possibly a tighter building envelope in S2. This also corresponds to the higher ventilation rates in S2 and S5 as shown in Tables and . The indoor PM levels depend on the HVAC system removal rate by ventilation and filtration, envelope tightness, the amount of pollutants already inside the room, number of occupants, type of activities, etc. (Cheong and Lau Citation2003).
Figure 7. PM10 levels in the schools during four school terms.
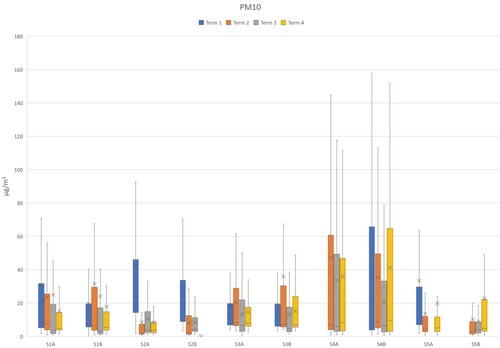
Figure 8. PM2.5 levels in the schools during four school terms.
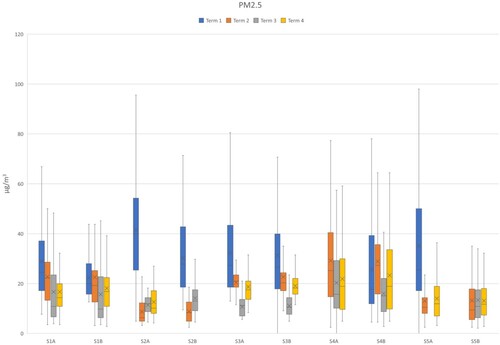
Figure 9. PM10 indoor–outdoor ratio.
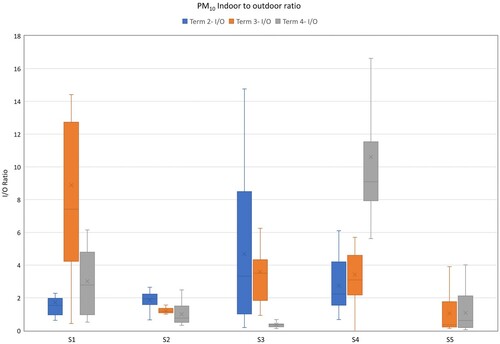
Figure 10. PM2.5 indoor–outdoor ratio.
Discussions
Indoor carbon dioxide (CO2) concentration measurements are commonly used as indicators of indoor ventilation in relation to the occupancy of the room. When concentration levels exceed 1000 ppm, insufficient ventilation and unacceptable conditions in relation to odours removal are indicated (ASTM Citation2018). Outdoor carbon dioxide (CO2) concentration levels typically range between 400 and 500 ppm, and typical indoor CO2 concentration levels range between 500 and 1500 ppm (Seppänen Citation2006). The commonly referenced guideline value for CO2 of 1000 ppm is based on the 650 ppm concentration difference with the outdoor CO2 concentration of 350 ppm (Seppänen Citation2006). However, with outdoor CO2 concentrations increasing (NOAA Citation2020), the indoor-outdoor concentration difference of 650 ppm would translate to a higher concentration than 1000 ppm. The difference of 480 ppm to 1833ppm above outdoor levels found in this study indicate that IAQ in these 10 school classrooms can be categorized as ‘Medium’ (IDA 2, 400–600 ppm) for S3 and S5; ‘Low’ (IDA 4, >1000 ppm) to ‘Acceptable’ (IDA 3, 600–1000 ppm) for S1 and S2; and ‘Low’ (IDA 4) with over 1000 ppm for S4, following the classifications of IAQ according to EN 13779 (CEN Citation2007). ASHRAE Standard 62.1 (2006) recommends a steady-state CO2 concentration in a space no greater than about 700 ppm above outdoor air levels with ventilation rate to be held to 5 Ls−1 per person for classrooms (age 9 plus). CIBSE BB101 (Citation2018) Guidelines stipulate that mechanical system must adhere to daily average of 1000 ppm and natural ventilation system cannot exceed a daily average of 1500 ppm. Australian Standard AS Citation1668.Citation2 (Citation2012) specifies a minimum floor area requirement per occupant and recommends minimum outdoor airflow rate between 10 and 12 Ls−1 per person. For example, minimum floor area of 2 m2 per person in classrooms and 12 Ls−1 per person serving persons up to 16 years of age. However, there is no information on minimum CO2 concentrations or other indoor air pollutants exposure levels. As cited in MOE (Citation2007), New Zealand standards (Citation1990) specifies 8 Ls−1 per person as fresh air requirement in a class with an estimated maximum occupancy of 50 students per 100 m2, and adopts the benchmark of 1000 ppm CO2 concentration levels.
Most of the previous studies on IAQ in school classrooms were conducted for a short period of time. This study investigated the indoor conditions in classrooms for a whole academic year representing four terms covering four seasons. The results in this study agree with other studies conducted in schools with markedly lower ventilation rates compared to the minimum recommended value as defined by ASHRAE Standard 62.1. In naturally ventilated schools in Portugal, ventilation rates of 2.4 Ls−1 per student were observed in winter (Canha et al. Citation2013). Similar results were also found in a study of primary schools in Greece, where average ventilation rates ranged from 0.8 Ls−1 to 2.4 Ls−1 per student in non-heating period and even lower ventilation rates of 0.1 Ls−1–1.1 Ls−1 per student during the heating period (Kalimeri et al. Citation2016). A study of school classrooms in northern Italy during the cold period found a median ventilation rate of 3.0 Ls−1 per student with a range of 0.7–7.7 Ls−1 per student (Rovelli et al. Citation2014). In a study of 140 classrooms in Southwestern United States, ventilation rates ranging 3.1–4.5 Ls−1 per person were found (Haverinen-Shaughnessy and Shaughnessy Citation2015). Hänninen et al. (Citation2017) in a study of Albanian classrooms observed average ventilation rates ranging from 0.8 to 3.6 (median 1.8) Ls−1 per student.
The ACH in this study varied significantly between schools with higher ACH observed in the summer months than winter months except in S5 which is a secondary school. Furthermore, two classrooms in the same schools showed different trends in different seasons. This shows that many other occupant-related factors such as the opening and closing of classroom doors and windows as well as operation of air conditioning systems may have contributed to the differences in air change rates. In Albanian schools, very low ventilation rates during the cold season were associated with the lack of heating and uncomfortable low temperature in classrooms (Hänninen et al. Citation2017). However, all the classrooms in this study were installed with heating system and some of them were retrofitted with split air conditioning systems which are switched on by the class teachers during the summer months. Yet, these artificial heating and cooling systems did not provide sufficient ventilation to the classrooms. Also, it was noted that in S2B and S3B, the class teachers left the windows slightly open throughout the year and this may be the reason for consistently higher ACH in those classrooms. For an average classroom size of 200 m3 volume and 24 students, 5 Ls−1 per person as recommended by ANSI/ASHRAE Standard 62 is equivalent to an air change rate of 2.16 ACH. This was met only for three out of the 10 classrooms investigated in this study.
PM2.5 levels were consistently high during the summer-autumn period in Term1 whereas PM10 was higher in Term1 only in S2 and S5. PM levels were generally higher in S4 that had the lowest ACH during the four seasons. WHO (Citation2006) recommends maximum levels of 20 µg/m3 per year and 50 µg/m3 per 24-hour for PM10 levels; for PM2.5, the recommended levels are not more than 10 µg/m−3 per year and 25 µg/m3 for 24 h. As there are no guidelines for the levels of indoor pollutants in Australia, outdoor (ambient) guidelines are normally used as a reference. It was found that 24 h average were within the WHO guidelines for all the schools. It was noted that I/O levels were lower for S2 and high for S4. This is mainly because outdoor PM levels were lower in S4. Outdoor PM2.5 levels increased in the morning drop-off period, afternoon pick-up time and also when students were outside playing in the playground. However, no consistent patterns were observed between various seasons. In a study involving two primary schools in Greece, Kalimeri et al. (Citation2016) found that I/O ratio for PM2.5 ranged from 0.3 to 7.9. The authors state that the high I/O ratio values can be attributed to either higher indoor levels due to resuspension from indoor activities or to the relatively low outdoor concentration during heating period. Rovelli et al. (Citation2014) in a study of seven schools in Milan found that the ratios between the five-day indoor and outdoor PM2.5 levels ranged from 0.48 to 1.50. The authors found that particle fractions affected by indoor resuspension phenomena are a concern in school classrooms. Trompetter et al. (Citation2018) investigated the effect of ventilation on PM levels in two classrooms in a New Zealand school, one ventilated and the other non-ventilated, for three weeks period during winter. PM10 concentration during school hours was found to be significantly higher, but PM10 concentrations were 66% lower in the ventilated classroom as compared to the unventilated control classroom. The authors noted that the increased PM10 was from the soil tracked in from outside on children’s footwear and re-suspended during activities within the classrooms and recommended that carpet cleaning and dust reducing carpet should be used to mitigate dust. High activity in densely occupied classroom spaces causes indoor generation of particles (Polidori et al. Citation2013). MacNeill et al. (Citation2016) found that traffic-related pollutant concentrations can significantly reduce by changing the timing of ventilation in schools located near major roads. Polidori et al. (Citation2013) state that for minimizing exposure of children to indoor pollutants originated from outside, highly effective air filtration devices may be installed in schools. Identification of specific sources of particles would require further control experiments targeting particular activities, extended to outside school hours.
Limitations
This study has limitations particularly associated with PM monitoring and subjective assessments of perceptions. Systematic monitoring of PM concentration levels with respect to indoor activities is required for a comprehensive understanding of indoor and outdoor pollutant sources. It was noted that PM concentration levels were influenced by the local activities within the room rather than outdoor sources. Close monitoring of PM levels with the existing HVAC system turned off can help to understand the main pollutant levels. Additionally, a questionnaire survey will help to understand how the students perceive the indoor environment. Using steady-state method for ventilation rate estimation is another limitation of this study. As steady state may not be reached and maintained in all the classrooms, this should be confirmed by plotting the time series CO2 concentration in each term in each of the classroom. Subsequently, ventilation rates should be estimated using build-up and decay methods to check the variability.
Conclusions
This paper investigated IAQ performance in schools using one-year long field monitoring of selected indoor environmental parameters, particularly CO2 and PM concentration levels in 10 classrooms in the temperate climate of Victoria, Australia. The monitoring of the classrooms provided a comprehensive understanding of the actual conditions of the classrooms in different school settings and an overview of the various physical and operational factors affecting ventilation rates and air quality in various seasons. The average CO2 concentration levels in the different classrooms ranged from 912 to 2235 ppm, while the maximum concentration levels reached up to 5000 ppm during certain times of the occupied hours. The ventilation rates were below the recommended standards in seven out of the 10 classrooms investigated. This was consistent across the season in the four school terms with slight improvement in ventilation during the summer months. The PM levels were within the guidelines stipulated by the World Health Organization and found to be very much influenced by the activities and movement of students inside the room, and the opening and closing of windows and doors. Future studies to investigate the sources of PM and practices to minimize particulate production in classrooms are proposed.
This study noted a performance gap between design expectations and building operation where classrooms were retrofitted with heating and cooling systems without any provision of fresh outdoor air. Currently, most schools rely on teachers opening the windows to provide fresh air to students. But that is not always practical during extreme weather events. Furthermore, extreme weather events such as heat waves, thunderstorms and bushfires, as well as planned burning prior to the fire season, are becoming more common due to climate change, resulting in phenomena such as increased smoke haze that affect IAQ in classrooms. An integrated approach is required for designing and operating the HVAC systems. Provision of mechanical or hybrid ventilation should be part of the standards for designing new schools. Such provision of mechanical ventilation caters for adverse weather conditions, when doors and windows are closed. The perceived cost associated with implementing mechanical ventilation strategy can be considered as a barrier, which will be outweighed by the long-term health and socio-economic benefits. It is important to provide clear instructions and operational guidelines for principals and teachers. A summary of the operational guidelines includes:
Checking if the artificial heating/cooling system has provision for ventilation, otherwise supplying fresh air through artificial ventilation or operable windows;
Installing CO2 monitor with traffic light system which can give some indication of when windows should be open;
Using CO2 controlled ventilation system where air exchange rate can be automatically reduced during low occupancy;
Leaving windows left open for 15–20 min during the break when outdoor temperature is not too high or too low.
The findings from this study will inform the operation and maintenance of classrooms and HVAC systems including provision of fresh air. The results of this study indicate the need to further investigate the indoor conditions and air quality in school classrooms for providing guidelines for building construction, envelope air tightness, cooling policy and ventilation standards. The observed poor ventilation in classrooms is likely to be associated with detrimental effects on health and cognitive performance of students. The next stage of the study involves subjective assessment by analysing student attention and concentration data and investigate how IAQ impacts the attention and concentration performance of the students.
Supplemental Material
Download MS Word (747.3 KB)Acknowledgements
This project was funded by the Victorian Department of Environment, Land, Water and Planning. We would like to thank the principals and teachers of the participating schools.
Disclosure statement
No potential conflict of interest was reported by the author(s).
Data availability
All data generated or analysed during this study are included in this article (and its supplementary information files).
Correction Statement
This article has been corrected with minor changes. These changes do not impact the academic content of the article.
Additional information
Funding
References
- ABS, Australian Bureau of Statistics. 2019. “Australian Demographic Statistics.” Last Accessed 10 February 2020. https://www.abs.gov.au/ausstats/[email protected]/0/1CD2B1952AFC5E7ACA257298000F2E76?OpenDocument.
- Annesi-Maesano, I., F. Lavaud, C. Raherison, C. Kopferschmitt, F. de Blay, D. Charpin, and D. Caillaud. 2012. “Poor air Quality in Classrooms Related to Asthma and Rhinitis in Primary Schoolchildren of the French 6 Cities Study.” Thorax 67 (8): 682–688.
- AS 1668.2-2012. “Standards Australia: The Use of Ventilation and Airconditioning in Buildings – Part 2.” In Mechanical Ventilation in Buildings, 125. Sydney: SAI Global under licence from Standard Australia.
- ASHRAE. 2009. Indoor Air Quality Guide: Best Practices for Design, Construction and Commissioning. Atlanta, GA: American Society of Heating, Refrigerating and Air-Conditioning Engineers, Inc. (ASHRAE).
- ASHRAE. 2016. ANSI/ASHRAE Standard 62.1-2016: Ventilation for Acceptable Indoor Air Quality, 60. Atlanta, GA: American Society of Heating Refrigerating and Air-conditioning Engineers (ASHRAE).
- ASTM D6245. 2018. Standard Guide for Using Indoor Carbon Dioxide Concentrations to Evaluate Indoor Air Quality and Ventilation. West Conshohocken, PA: ASTM International.
- Barnett, Adrian G., Gail M. Williams, Joel Schwartz, Anne H. Neller, Trudi L. Best, Anna L. Petroeschevsky, and Rod W. Simpson. 2005. “Air Pollution and Child Respiratory Health: A Case-Crossover Study in Australia and New Zealand.” American Journal of Respiratory and Critical Care Medicine 171: 11.
- BB101. 2018. “Guidelines on Ventilation, Thermal Comfort and Indoor Air Quality in Schools.” Version 1, August 2018, Education & Skill Funding Agency. Accessed 30 August 2021. https://www.gov.uk/government/publications/building-bulletin-101-ventilation-for-school-buildings.
- BoM and CSIRO. 2018. State of the Climate 2018. Accessed 27 July 2019. http://www.bom.gov.au/state-of-the-climate/index.shtml.
- Canha, N., S. M. Almeida, M. C. Freitas, M. Täubel, and Otto Hänninen. 2013. “Winter Ventilation Rates at Primary Schools: Comparison Between Portugal and Finland.” Journal of Toxicology and Environmental Health. Part A 76 (6): 400–408. doi:https://doi.org/10.1080/15287394.2013.765372.
- CEN. 2007. EN 13779-2007: Ventilation for non-Residential Buildings – Performance Requirements for Ventilation and Room-Conditioning Systems, 72. Brussels: European Committee for Standardization (CEN).
- Chatzidiakou, Lia, Dejan Mumovic, Alex J. Summerfield, Sung Min Hong, and Hector Altamirano-Medina. 2014. The Effects of Thermal Conditions and Indoor Air Quality on Health, Comfort and Cognitive Performance of Students, 41. London: The Bartlett, UCL Faculty of the Built Environment, UCL Institute for Environmental Design and Engineering.
- Cheong, K., and H. Lau. 2003. “Development and Application of an Indoor air Quality Audit to an air-Conditioned Tertiary Institutional Building in the Tropics.” Building and Environment 38 (4): 605–616.
- Cheryan, Sapna, Sianna A. Ziegler, Victoria C. Plaut, and Andrew N. Meltzoff. 2014. “Designing Classrooms to Maximize Student Achievement.” Policy Insights from the Behavioral and Brain Sciences 1 (1): 4–12.
- Clausen, G., J. Toftum, and G. Bek€o. 2009. “Indoor Environment and Children’s Health (IECH) e an Ongoing Epidemiological Investigation on the Association Between Indoor Environmental Factors in Homes and Kindergartens and Children’s Health and Wellbeing.” Paper read at 9th International Healthy building at Syracuse, NY.
- Coutts, A. M., J. Beringer, and N. J. Tapper. 2007. “Characteristics Influencing the Variability of Urban CO2 Fluxes in Melbourne, Australia.” Atmospheric Environment 41: 51–62.
- Csobod, E., I. Annesi-Maesano, P. Carrer, S. Kephalopoulos, J. Madureira, P. Rudnai, E. de O. Fernandes, et al. 2014. Final Report: Schools Indoor Pollution and Health Observatory Network in Europe (SINPHONIE), European Commission: Directorate General for Health and Consumers and Directorate General Joint Research Centre – Institute for Health and Consumer Protection, ISPRA (VA), Italy.
- de Dear, Richard, Jungsoo Kim, Christhina Candido, and Max Deuble. 2015. “Adaptive Thermal Comfort in Australian School Classrooms.” Building Research & Information 43 (3): 383–398.
- Department of Education and Training, Victoria. 2017. School Policy Advisory Guide–- School Hours. Accessed 14 November 2017. http://www.education.vic.gov.au/school/principals/spag/management/Pages/hours.aspx.
- DIN. 2007. DIN EN 15251:2007 Indoor Environmental Input Parameters for Design and Assessment of Energy Performance of Buildings Addressing Indoor Air Quality, Thermal Environment, Lighting and Acoustics, 54. Berlin: German Institute for Standardization (DIN).
- Fsadni, P., F. Bezzina, C. Fsadni, and S. Montefort. 2018. “Impact of School Air Quality on Children’s Respiratory Health.” Indian Journal of Occupational and Environmental Medicine 22 (3): 156–162.
- Hänninen, O. 2013. “Novel Second-Degree Solution to Single Zone Mass-Balance Equation Improves the use of Build-up Data in Estimating Ventilation Rates in Classrooms.” Journal of Chemical Health and Safety 20 (2): 14–19.
- Hänninen, Otto, Nuno Canha, Alexandra V. Kulinkina, Ilir Dume, Agron Deliu, Elida Mataj, Arben Lusati, Michal Krzyzanowski, and Andrey I. Egorov. 2017. “Analysis of CO2 Monitoring Data Demonstrates Poor Ventilation Rates in Albanian Schools During the Cold Season.” Air Quality, Atmosphere and Health 10: 773–782. doi:https://doi.org/10.1007/s11869-017-0469-9.
- Haverinen-Shaughnessy, U., and R. J. Shaughnessy. 2015. “Effects of Classroom Ventilation Rate and Temperature on Students.” Test Scores. PLoS ONE 10 (8): e0136165. doi:https://doi.org/10.1371/journal.pone.0136165.
- Kalimeri, Krystallia K, Dikaia E Saraga, Vasileios D Lazaridis, Nikolaos A Legkas, Dafni A Missia, Evangelos I Tolis, and John G Bartzis. 2016. “Indoor Air Quality Investigation of the School Environment and Estimated Health Risks: Two-Season Measurements in Primary Schools in Kozani, Greece.” Atmospheric Pollution Research 7 (6): 1128–1142.
- Knibbs, Luke D., Adriana M. Cortés de Waterman, Brett G. Toelle, Yuming Guo, Lyn Denison, Bin Jalaludin, Guy B. Marks, and Gail M. Williams. 2018. “The Australian Child Health and Air Pollution Study (ACHAPS): A National Population-Based Cross-Sectional Study of Long-Term Exposure to Outdoor air Pollution, Asthma, and Lung Function.” Environment International 120: 394–403.
- Laiman, Rusdin, Congrong He, Mandana Mazaheri, Samuel Clifford, Farhad Salimi, Leigh R Crilley, Megat Mokhtar, Megat Azman, and Lidia Morawska. 2014. “Characteristics of Ultrafine Particle Sources and Deposition Rates in Primary School Classrooms.” Atmospheric Environment 94: 28–35. doi:https://doi.org/10.1016/j.atmosenv.2014.05.013.
- Liu, Hai-Ying, Daniel Dunea, Stefania Iordache, and Alin Pohoata. 2018. “A Review of Airborne Particulate Matter Effects on Young Children’s Respiratory Symptoms and Diseases.” Atmosphere 9 (4): 150. Web.
- Luther, M., and S. E. Atkinson. 2012. “Measurement and Solutions to Thermal Comfort, CO2 and Ventilation Rates in Schools.” Paper presented to Healthy Buildings 2012: Proceedings of the 10th International conference of Healthy Buildings. 8–12 July 2012, Brisbane, QLD.
- Luther, M. B., P. Horan, and O. Tokede. 2018. “Investigating CO2 Concentration and Occupancy in School Classrooms at Different Stages in Their Life Cycle.” Architectural Science Review 61 (1-2): 83–95.
- MacNeill, M., N. Dobbin, M. St-Jean, L. Wallace, L. Marro, T. Shin, H. You, R. Kulka, R. W. Allen, and A. J. Wheeler. 2016. “Can Changing the Timing of Outdoor Air Intake Reduce Indoor Concentrations of Traffic-Related Pollutants in Schools?” Indoor Air 26 (5): 687–701.
- Madureira, J., I. Paciencia, J. Rufo, E. Ramos, H. Barros, J. P. Teixeira, and E. de Fernandes. 2015. “Indoor air Quality in Schools and its Relationship with Children’s Respiratory Symptoms.” Atmospheric Environment 118: 145–156.
- MOE, Ministry of Education. 2007. “Designing Quality Learning Spaces: Ventilation & Indoor Air Quality.” Accessed 6 May 2017. http://www.education.govt.nz/assets/Documents/Primary-Secondary/Property/School-property-design/Flexible-learning-spaces/VentilationIndoorAirQualityGuide.pdf.
- National Oceanic and Atmospheric Administration (NOAA). 2020. “Trends in Atmospheric Carbon Dioxide, Earth System Research Laboratory.” Accessed 28 July 2020. https://www.esrl.noaa.gov/gmd/ccgg/trends/global.html.
- Paciência, Inês, João Cavaleiro Rufo, Diana Silva, Carla Martins, Francisca Mendes, Tiago Rama, Ana Rodolfo, et al. 2019. “School Environment Associates with Lung Function and Autonomic Nervous System Activity in Children: a Cross-Sectional Study.” Scientific Reports 9: 15156.
- Palumbo, Jillian R, Shao Lin, Ziqiang Lin, Iulia A Neamtiu, Wangjian Zhang, Eva Csobod, and Eugen S Gurzau. 2018. “Assessing Associations Between Indoor Environment and Health Symptoms in Romanian School Children: An Analysis of Data from the SINPHONIE Project.” Environmental Science and Pollution Research 25 (9): 9186–9193.
- Polidori, A., P. M. Fine, V. White, and P. S. Kwon. 2013. “Pilot Study of High-Performance air Filtration for Classroom Applications.” Indoor Air 23 (3): 185–195.
- Roulet, C.-A., and F. Flavio. 2002. “Simple and Cheap Air Change Rate Measurement Using CO2 Concentration Decays.” International Journal of Ventilation 1 (1): 39–44. doi:https://doi.org/10.1080/14733315.2002.11683620.
- Rovelli, Sabrina, Andrea Cattaneo, Camilla P Nuzzi, Andrea Spinazzè, Silvia Piazza, Paolo Carrer, and Domenico M Cavallo. 2014. “Airborne Particulate Matter in School Classrooms of Northern Italy.” International Journal of Environmental Research and Public Health 11 (2): 1398–1421.
- Seppänen, O. 2006. “The Effect of Ventilation on Health and Other Human Responses.” In Building Ventilation: The State of the Art, edited by M. Santamouris and P. Wouters, 247–264. London: Earthscan.
- Simoni, M., I. Annesi-Maesano, T. Sigsgaard, D. Norb€ack, G. Wieslander, W. Nystad, M. Canciani, P. Sestini, and G. Viegi. 2010. “School Air Quality Related to dry Cough, Rhinitis and Nasal Patency in Children.” European Respiratory Journal 35 (4): 742–749.
- Trompetter, W. J., M. Boulic, T. Ancelet, J. C. Garcia-Ramirez, P. K. Davy, Y. Wang, and R. Phipps. 2018. “The Effect of Ventilation on Air Particulate Matter in School Classrooms.” Journal of Building Engineering 18: 164–171.
- Wang, Yu, Mikael Boulic, Robyn Phipps, Manfred Plagmann, Chris Cunningham, Chris Theobald, Philippa Howden-Chapman, and Michael Baker. 2016. “Impacts of a Solar Ventilation Unit on Temperature and Ventilation Rate in New Zealand Schools: an Intervention Study.” Paper presented to Indoor Air 2016: The 14th International conference of Indoor Air Quality and Climate, Ghent, Belgium, 3-8 July 2016.
- Wargocki, Pawel, Jose Ali Porras-Salazar, and Sergio Contreras-Espinoza. 2019. “The Relationship Between Classroom Temperature and Children’s Performance in School.” Building and Environment 157 (C): 197–204.
- Wargocki, Pawel, Jose Ali Porras-Salazar, Sergio Contreras-Espinoza, and William Bahnfleth. 2020. “The Relationships Between Classroom Air Quality and Children’s Performance in School.” Building and Environment 173: 106–149.
- Wargocki, P., and D. P. Wyon. 2013. “Providing Better Thermal and air Quality Conditions in School Classrooms Would be Cost-Effective.” Building and Environment 59 (0): 581–589.
- Weinstein, C. S. 1979. “The Physical Environment of the School: A Review of the Research.” Journal of Educational Research 49 (4): 577–610.
- WHO. 2006. Air Quality Guidelines: Particulate Matter, Ozone, Nitrogen Dioxide and Sulfur Dioxide. Geneva: World Health Organization.
- Young, Ed, Harry A. Green, Lynnisse Roehrich-Patrick, Linda Joseph, and Teresa Gibson. 2003. Do K-12 School Facilities Affect Education Outcomes? 46. Nashville: Tennessee The Tennessee Advisory Commission on Intergovernmental Relations.
- Zealand, Standards New. 1990. NZS 4303: 1990. Ventilation for Acceptable Indoor air Quality 32. Wellington: SAI Global under license from Standards New Zealand.