
 ?Mathematical formulae have been encoded as MathML and are displayed in this HTML version using MathJax in order to improve their display. Uncheck the box to turn MathJax off. This feature requires Javascript. Click on a formula to zoom.
Abstract
Perceived density was examined as two architectural design features were varied: wider wall location in trapezoid-shaped apartments and window size. Subjects rated perceived density and positive affect following presentation of apartment units with these features changed but with the same amount of space. Two electroencephalogram (EEG) measures were examined: event-related desynchronization modulation (Mu-Rhythm) and Theta power – both associated with movement planning. There was an interaction of design features – the wide wall was at the entrance (appears narrowing) with a narrow window, was rated higher for perceived density compared to all other conditions. There was also an interaction for Mu Rhythm – greater modulation for incongruence: widening apartments with narrow windows or narrowing apartments with wide windows. Theta power results indicated a window size main effect – increased Theta power in wider window conditions. These findings support the idea that density perception is linked with movement planning and could lead to guidelines for architectural design in limited spaces to enhance wellbeing.
Introduction
Perceived density in residential environments
Perceived density plays a key role in city planning (Cheng Citation2009; Lawson Citation2009), and studies on this topic tend to focus on the individual-environment interaction (Cheng Citation2010). Specifically, perceived density has been defined as an individual’s estimate of the number of people in a given area, the space available, and its organization (Churchman Citation1999; Koltsova et al. Citation2013; Rapoport Citation1975). However, perceptions of openness-enclosure may be only loosely related to the absolute size of space (Spreiregen Citation1965). In this study, perceived density is considered a subjective phenomenon where the relationship between perceived and real density is modulated by differences in spatial configuration (Fisher-Gewirtzman et al. Citation2003).
Studies on interior spaces show that density perceptions change based on architectural features such as room shape, window size, ceiling height, and furniture arrangement (Cheng Citation2009). Within smaller residential units, geometry, spatial configuration, orientation, location, and size of openings also impact viewers’ experiences (Fisher-Gewirtzman Citation2017). Moreover, in alternative, minimally sized apartments with equal interior volumes of space and floor area, Fisher-Gewirtzman (Citation2018) showed that there is a strong correlation between visibility measurements and perceived density, such that the higher the visibility is, the lower the perceived density . Additionally, perceived and real density are most often aligned in cases of high density (Sivam et al. Citation2012). In Trossman-Haifler and Fisher-Gewirtzman (Citation2022) and Fisher-Gewirtzman (Citation2018), the influence of architecture spatial configuration on the perceived density and positive affect was examined. In both studies inverse correlation between perceived density ratings and positive affects ratings were consistently found.
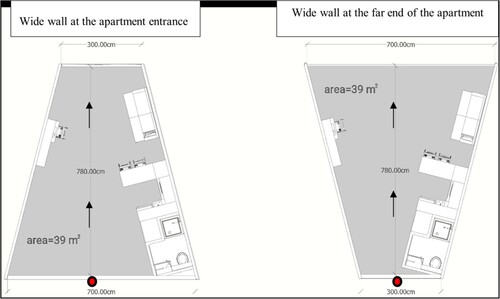
Thus, this study addresses the combined effect of two design features in enclosed trapezoidal apartment: (1) Wide wall location – Position of the trapezoid wide wall relative to the entrance of the apartment; and (2) Window size – at the far end of the enclosed space (i.e. ‘edge’). Virtual models of equally sized apartments, with the same absolute square footage for all models, were utilized to examine the effect of these two features on perceived density ratings. The wide wall was either located at the apartment entrance, thereby appearing to narrow towards the edge, or at the edge of the apartment, thus appearing to expand towards the edge. The window (always at the edge) was either wide, covering the entire far wall, or narrow, covering only part of the far wall (Figure ).
Figure 1. Illustration of the two types of expansion location in the apartment – a view from above the presented apartment models*. Left panel: the expansion is located at the entrance and so the apartment narrowed in space towards the edge of the apartment space. Right panel: the expansion is located at the edge of the apartment space and so the apartment widened in space towards the edge of the apartment space. In both illustrations The figure presents the simulated measures of the apartment space. The red dot indicates the location in which the simulated movement within the apartment began, and the orange arrows demonstrate the trajectory of simulated movement in the apartment models. *This illustration does not depict the image presented as stimuli to subjects.
We hypothesized that both design features would affect perceived density ratings. Specifically, entrance conditions would lead to an increase in perceived density compared to edge conditions, and narrow windows would result in increased perceived density compared to wide windows (Ergan, Shi, and Yu Citation2018; Fisher-Gewirtzman Citation2017). We also anticipated a combined effect of both design features, such that differences between the narrow and wide window conditions would be more pronounced in edge conditions than in entrance conditions. Previous work demonstrated that higher measured visibility is correlated with lower perceived density and higher sense of wellbeing (Fisher-Gewirtzman, Citation2017; Trossman-Haifler and Fisher-Gewirtzman Citation2022). The current study proposes a spatial perception index that can be used by practitioners in the design process.
Additionally, we hypothesized that spaces which are rated with lower perceived density will also be rated with higher positive affect, and thus positive affect ratings will be higher in the edge conditions than in the entrance ones, and that wide window would result in higher positive affect ratings compared to the narrow one. Spaces with larger windows or that are perceived as more open often receive higher scores on positive affect ratings (Ergan, Shi, and Yu Citation2018). Since positive affect is associated with factors linked to a sense of well-being (Dockray and Steptoe Citation2010), we also anticipated that based on the absolute window size, a larger difference will be seen in positive affect ratings between the wide and narrow windows when the wide wall is located at the edge.
Neural measures in architectural design
The literature on perception of enclosed spaces mainly examines subjective ratings of aesthetics, beauty, liking, and affect, or physiological and neural correlates (Shemesh et al. Citation2017; Shemesh, Bar, and Grobman Citation2015). However, perceived density can also be addressed in the context of visual processing by considering the role of spatial attention when assessing scene perception.
Vartanian et al. (Citation2015) studied perceptual measures in beauty and exit decisions in enclosed spaces and examined the effects of ceiling height on perceived enclosure. This functional magnetic resonance imaging (fMRI) study investigated neural correlates of perceived visual and locomotive permeability while subjects made exit decisions in enclosed spaces with varying ceiling heights. The results indicated that exit decisions tend to occur in more enclosed spaces, where the person’s anterior midcingulate cortex (aMCC) region was found to be more activated within the cingulate gyrus and with direct projections from the amygdala. The authors concluded that this indicates a reduction in perceived visual locomotive permeability characteristics of enclosed spaces. Thus, this study links perceived density in architectural designs of interior spaces to spatial attention, planning, and execution.
The Premotor Theory of Spatial Attention links spatial attention and action, such that visual modality is involved in guiding movements and actions. This is based on studies of animals and hemispatial neglect patients, showing that damage to motor cortical areas leads to deficits in spatial attention (O'Regan and Noë Citation2001; Rizzolatti et al. Citation1987). Electroencephalograph (EEG) studies of tasks involving spatial attention also support this theory (Hari Citation2006). For example, Mu-rhythm is a measure of field oscillation in the alpha band (∼10 Hz range), mostly observed over the sensory motor cortex, and is associated with suppression of the alpha band (event-related desynchronization [ERD]). ERD Modulation of activity in the sensory-motor Mu-rhythm is a synchronized pattern of activation in regions of the brain associated with voluntary control of movement, which occurs prior to the execution/observation of the movement itself.
In addition, increased Theta power (6–12 HZ) in the left medial temporal lobe (MTL) is involved in processing of settings that lack visual feedback for given motor plans/movement trajectories (Aghajan et al. Citation2017; Dufour et al. Citation2018). In an intracranial electroencephalogram (iEEG) study, researchers found significantly stronger Theta power in the MTL among participants when they were moving around compared to when they were immobile (Aghajan et al. Citation2017). The researchers concluded that Theta oscillations in human MTL are linked to spatial navigation in the human central nervous system (CNS). Moreover, as theta-band power is modulated by the expected presence or absence of visual feedback in relation to a consistent motor action, theta-band power is directly linked to the amount of available visual input for an upcoming movement (Dufour et al. Citation2018). In accordance with these findings, we expected that architectural design factors that are associated with perceived density will elicit Theta power at the motor planning stage, and that it would increase when design features aimed at eliciting relatively less dense visual scenes (i.e. edge wide wall with wide window).
Furthermore, Mu-rhythm modulation has been shown to occur in the planning of virtual movements (Llanos et al. Citation2013), and thus we hypothesized that the depiction of motion in enclosed spaces would elicit Mu-rhythm modulations, even during the initial static stage of apartment presentation. In addition, we expected that Assessing the perceived density of apartments (which depicts motion) would result in Mu-rhythm in primary somatosensory regions, which are associated with somatosensory spatial attention (Anderson and Ding Citation2011; Jones et al. Citation2010). Moreover, both Mu-rhythm (i.e. suppression of the alpha band frequency) and Theta power were investigated in an EEG study on virtual architectural environments (Vecchiato et al. Citation2015), in which after navigating through virtual spaces, participants were asked to rate their levels of familiarity, novelty, comfort, pleasantness, arousal, and presence in the given space. The results indicated that higher ratings of presence were linked to more pronounced left central theta oscillations, which may be associated with sensorimotor integration. These findings also indicated that more pronounced Mu-rhythm activity in left motor areas in virtual environments, was associated with higher ratings of pleasantness. Therefore, we anticipated that Mu-rhythm suppression and Theta power will be sensitive to changes in the virtual apartment space presented and assessment of density.
Materials and methods
Participants
The participants included 31 undergraduate students, aged 18–35. All Hebrew or Arabic native speakers, healthy and with normal or corrected-to-normal vision. Informed consent forms were signed by each participant. The study was approved by the Ethical Review Committee for Clinical Experiments in Humans at the authors’ affiliated academic institution, and the study was conducted in accordance with relevant guidelines and regulations that comply with the Declaration of Helsinki standards. The participants received monetary compensation for their time (NIS100).
Experimental design
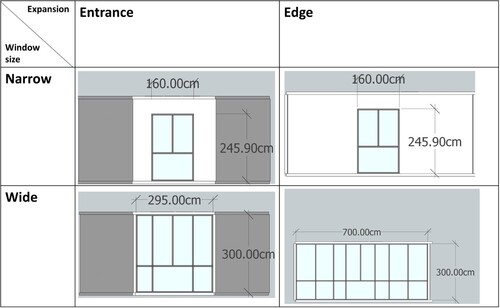
A total of 96 video-clips of trapezoid studio apartments were created for this study, all of equal size (39 m2), and presenting four conditions: (1) entrance + narrow: wide wall at apartment entrance, gradually narrowing towards apartment edge, and narrow window only covering some of the far wall; (2) entrance + wide: wide wall at entrance, gradually narrowing towards apartment edge, and wide window covering entire far wall; (3) edge + narrow: wide wall at apartment edge with narrow window; and (4) edge + wide: wide wall at apartment edge with wide window (see Figure ). For each condition, 24 video-clips were created, differing only in furniture (e.g. different sofas, chair by desk, and items on shelves). While the absolute size of the narrow window was constant (160 cm), the wide window size was relative to the size of the wall, depending on the location of the wide wall (entrance: 295 cm; edge: 700 cm) (see Figure and Figure ). With sceneries inspired by Hong Kong, the view from all window conditions was of a dense high-rise environment.
Figure 2. Video clip depictions of the experimental design – depicts the kitchen, dining area, and sofa on the right hand side and a desk on the left (half the models presented a mirrored interior setup).
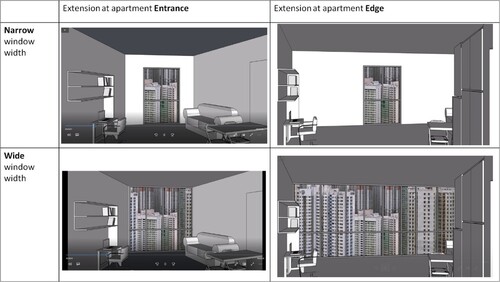
Figure 3. Simulated Window Sizes in each condition – the width of the windows is equal for the Narrow window size conditions (top row), but the width of the windows is different for the Wide window conditions (bottom row).
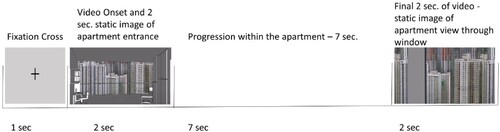
Video-clip presentation
Each participant watched all 96 videos. Before each video-clip, a fixation cross appeared at the centre of the screen for one second, immediately followed by the nine-second video-clip trial (Figure ). The initial two seconds of the trial were a static image of the apartment entrance facing the interior, followed by a seven second dynamic image of movement in progressing along the room in a straight trajectory, up to the window depicted at the edge. The final two seconds of the trial depicted a static view from the window. In the first block, participants were asked to rate the perceived density in each apartment of 96 randomly sequenced video clips while we measured their EEG (Block I); next, participants watched another block of the same 96 randomly sequenced video clips, and were asked to rate their positive affect (Block II) (See rating instruction screen depictions in Figure S1 in the Supplementary Materials section). Rest intervals were given such that every 10 video clips, the participant was presented with a ‘break’ screen and was instructed to try to close their eyes and relax facial muscles for at least a minute or longer if needed. The experiment was designed using Psychopy (Peirce and MacAskill Citation2019) and manual responses were recorded using a keyboard.
Figure 4. Trial sequence – (left to right) fixation cross (1 second), static image of apartment entrance facing towards the apartment interior (2 seconds), dynamic depiction of movement progressing in a straight line towards the edge of the apartment (7 seconds), and a static view at the edge of the apartment, out the window (2 seconds).
Additionally, given the requirement of EEG of the subject to be stationary while neural activity is being recorded, and the fact that motion was depicted in the video-clips it was important to consider the presentation that would be less likely to result in less motion sickness. According to Solimini (Citation2013), 2D presentations are less likely to lead to motion sickness. EEG measurement tools
Electroencephalogram data were acquired using the g.Nautilus Research System (24 Bittools.ignal Amplification Unit, g.tec Medical Engineering GmbH, Austria) with a sampling frequency of 500 Hz. The EEG electrodes were fixed to an EEG electrode cap (g. GAMMAcap) according to the extended international 10/20 electrode system. The impedances for channels were kept below 30kΩ. The right earlobe was used as reference and the ground electrode was placed at CZ. Recordings were obtained using g. Recorder Biosignal recording software (g.tec Medical Engineering GmbH, Austria).
Procedure
The experiment took place in a soundproof air-conditioned room, illuminated with regular office illumination level (interior artificial lighting), and the experiment was presented on a 24″ fast display LCD monitor. Subjects were seated at a 65 cm distance from the monitor (an optimal distance according to Sharples et al. (Citation2008)), and asked to sit as still as possible while watching the video-clips. The instructions and rating scales were presented in the Hebrew or Arabic in accordance with the subject's native language. The rating scales were composed as volume graphs ranging from 0 (not perceived as dense / no positive affect) to 8 (perceived as very dense / high positive affect). The scale appeared immediately following each video. In Block I, participants were asked to estimate the degree to which each apartment elicited a crowded/enclosed/dense experience, while in Block II, they were asked to estimate the extent to which the apartments elicited a calm/pleasant/peaceful experience. Immediately following the participant’s response, the fixation cross for the next trial appeared, followed by the next trial.
Pre-processing
EEG data analysis was conducted using EEGLAB v. 2019.1 (Delorme and Makeig Citation2004), a free open-source toolbox (https://sccn.ucsd.edu/eeglab) running on Matlab 2019b (The Mathworks). Data were down-sampled to 200 HZ to save computation time, followed by low (30 Hz) and high-pass (1 Hz) filters; power line noise using a notch filter centred at 50 Hz were applied using a zero-phase second-order Butterworth filter. Bad channels were rejected using the EEGLAB plugin clean RawData (Mullen et al. Citation2015), where channels were rejected if they were: flat for more than 5 s, 4 or more standard deviations more than maximum acceptable high frequency, or had less than 0.8 correlation with nearby channels (6.25%, range 0–4). Using a spherical spline method, missing channels were then interpolated, and data were re-referenced to the average reference. Data epochs were extracted (−600 to 2000 ms) and baseline was corrected to (−200 to 0 ms). Epochs containing irregular noise (e.g. swallowing) were discarded from further analysis.
There were 24 trials per condition, and 96 trials overall from all four of the conditions, all of which were visually inspected. An independent component analysis (ICA) was run using the runica EEGLAB function (Delorme and Makeig Citation2004), and components corresponding to artifacts (e.g. eye blinks and heartbeats) were corrected using the ICLabel plugin (Pion-Tonachini, Kreutz-Delgado, and Makeig Citation2019). The ICA analysis was then re-run on the pruned data. The mean rejected epochs was 26.64% (mean: 19.58, range: 8–43). Using DIPFIT 3.3 for each IC, an equivalent current dipole was estimated utilizing the standard Boundary Element Model with the Montreal Neurological Institute (MNI) standard coordinate system, with the warp montage function for co-registering the electrode locations with the head model, followed by coarse and fine fitting. Thus, there were 992 independent components (IC): 31 datasets X 32 ICs, of which 206 (20.76%) were rejected due to residual variance greater than 15%. Scalp topography, averaged event-related spectral power (ERSP), and EEG spectra were computed for each IC. Finally, the Morlet wavelet was used for ERSP calculation.
EEG data analysis
ERSP and ITC data dimensions were reduced to 10 with principal component analysis (PCA); IC clustering was performed using k-means with dipole locations criteria, ERSP (latency: −100 to 1000 ms; frequency: 1–20 Hz; normalization weight: 1) to generate 26 IC clusters. Out of 786 ICs, 40 (5.0%) were not within 3SD from any cluster and were therefore excluded as outliers. The IC clusters were visually inspected to determine their physiological significance. Two of the clusters were found to have oscillatory dynamics of interest (i.e. Mu Rhythm and Theta). Each IC was calculated from all scalp channel activities, and therefore each single IC was comprised of all scalp channel information for every timepoint. ICA is widely used in research and there is a consensus regarding its reliability (Miyakoshi et al. Citation2010). Repeated measures ANOVA was applied to test the main effects of the wall location and window size, and their interaction effect. For the left primary sensory cluster, we examined the average and common baseline ERSP values.
Results
Behavioural results
Density ratings
A two-way repeated measures ANOVA of average perceived density rating values was conducted for the two variables-wall expansion location (Entrance versus Edge) and window size (Wide versus Narrow) (Figure ). The analysis indicated a significant main effect for expansion location [F(1,30) = 21.392, p = .000, = .416], such that apartments with the wider wall at the entrance were consistently rated higher (i.e. perceived as denser) than those with the edge conditions (mean difference: 1.440, p = .000). There was also a significant effect for window size [F(1,30) = 11.267, p = .002,
= .273], which indicated that apartments with a narrow window were always rated as more dense compared to those with a wide window (mean difference: .663, p = .002). In addition, there was a significant interaction between window size and expansion location [F(1,30) = 6.532, p = .016,
= .179] (see Figure ).
Figure 5. Group average density ratings – a main effect of both expansion location (Entrance versus Edge) [F(1,30) = 21.392, P = .000, ηρ2 = .416], and Window size (Wide versus Narrow) [F(1,30) = 11.267, P = .002, ηρ2 = .273] (brackets depict main effects). There was also a significant interaction between window size and expansion location [F(1,30) = 6.532, P = .016, ηρ2 = .179]. Error bars – standard errors. Braces – main effect. *P < .05, **P < .01, ***P < .001.
![Figure 5. Group average density ratings – a main effect of both expansion location (Entrance versus Edge) [F(1,30) = 21.392, P = .000, ηρ2 = .416], and Window size (Wide versus Narrow) [F(1,30) = 11.267, P = .002, ηρ2 = .273] (brackets depict main effects). There was also a significant interaction between window size and expansion location [F(1,30) = 6.532, P = .016, ηρ2 = .179]. Error bars – standard errors. Braces – main effect. *P < .05, **P < .01, ***P < .001.](/cms/asset/a9cd23f0-eb56-4760-ba80-9ebf3cc92022/tasr_a_2224284_f0005_oc.jpg)
To investigate the interaction, we conducted separate t-tests on the difference between window sizes within the entrance condition and within the edge condition. In both conditions, the wide window conditions were rated as less dense than narrow window conditions. In conditions with the expansion at the entrance, this difference was significant [t(30) = 2.85, P = .008] yet smaller (mean difference: .436, SD: .853) than the difference in the conditions with the expansion at the edge (mean difference: .889, SD: 1.475) [t(30) = 3.356, P = .002].
Positive affect ratings
A two-way repeated measures ANOVA of average positive affect rating values was conducted for the two variables -the four-wall expansion location (Entrance versus Edge) and window size (Wide versus Narrow) (Figure ). This resulted in a significant main effect for window size [F(1,30) = 25.330, p = .000, = .458], indicating that the apartments with narrow windows received lower ratings than wide ones (mean difference: 1.207, p = .000). There was also a significant interaction between wall locations and window size [F(1,30) = 4.720, p = .038,
= .136].
Figure 6. Group average positive affect ratings. – a significant main effect of Window size (Wide versus Narrow) [F(1,30) = 25.330, P = .000, ηρ2 = .458] (brackets depict main effects), and a significant interaction between window size and expansion location [F(1,30) = 4.720, P = .038, ηρ2 = .136]. Error bars – standard errors. Braces – main effect. *P < .05, **P < .01, ***P < .001.
![Figure 6. Group average positive affect ratings. – a significant main effect of Window size (Wide versus Narrow) [F(1,30) = 25.330, P = .000, ηρ2 = .458] (brackets depict main effects), and a significant interaction between window size and expansion location [F(1,30) = 4.720, P = .038, ηρ2 = .136]. Error bars – standard errors. Braces – main effect. *P < .05, **P < .01, ***P < .001.](/cms/asset/34c31ea5-1965-4d12-9573-3fdb35d1e5ac/tasr_a_2224284_f0006_oc.jpg)
To investigate the interaction, we conducted separate t-tests on the difference between window sizes within each of the expansion conditions - at the entrance and at the edge. In the entrance condition, this difference [t(30) = −4.798, P = .000] was smaller (mean difference: −1.009, SD: 1.171) as compared to the edge condition (mean difference: −1.403, SD: 1.644) [t(30) = −4.755, P = .000] (see Figure ).
Behavioural results summary: Apartments with a wider wall across from the room entrance (edge condition) were rated as less dense compared to apartments in which the wall across from the entrance was narrower (entrance condition). Furthermore, apartments with a wider window were rated as less dense compared to apartments with narrower windows, and this difference was more pronounced in the edge condition compared to the entrance condition.
Positive affect ratings were higher for apartments with wider windows. However, in the edge condition this difference was more pronounced as compared to the entrance condition.
EEG results
As mentioned above, two of the 26 IC clusters presented oscillatory dynamics of interest (see EEG analysis section). The MNI coordinates for the centroid of the dipole cluster of the first of these IC clusters was (44, −18, 33), which falls within the right primary sensory cortex (rPS), and the mean residual variance was 8.72% (Figure ). We therefore refer to the IC cluster as rPS, in accordance with the location of the centroid. A total of 38 ICs from 22 participants contributed to this cluster. Statistical tests across all four conditions indicated ERSP modulation in the alpha range of 175–540 ms post-stimulus (Figure (a–c)).
Figure 7. Right primary sensory (rPS) Cluster – (A) Cluster mean DIPFIT dipole location, (B) fMRI presentation of mean DIPFIT dipole location, (C) Cluster mean power spectrum, 10 × log10 (_V2/Hz)), for each condition, (D) topographic scalp map of the cluster.
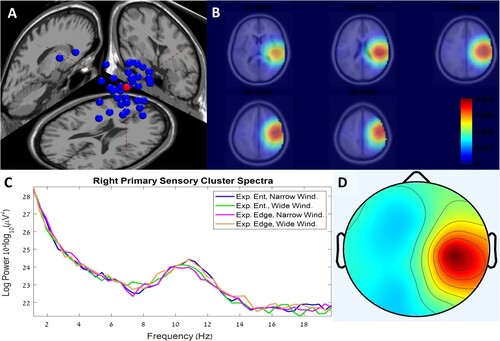
Figure 8. Right primary sensory (rPS) Cluster independent component (IC) illustration – illustration of activities in right primary sensory (rPM) cluster (panels a, b, and c). (a) event-related spectral perturbation (ERSP) for rPS cluster respectfully. Columns of the figure from left to right present each of the four conditions: Expansion at Entrance and Narrow Window, Expansion at Entrance and Wide Window, Expansion at Edge and Narrow Window, and Expansion at Edge and Wide Window. In (b) pixels highlighted in red showed statistical differences across levels of Expansion Location and Window Size (p < 0.05 FDR corrected). In (c) the mean values of the highlighted pixels indicated by the arrow. Error bars are for SE.
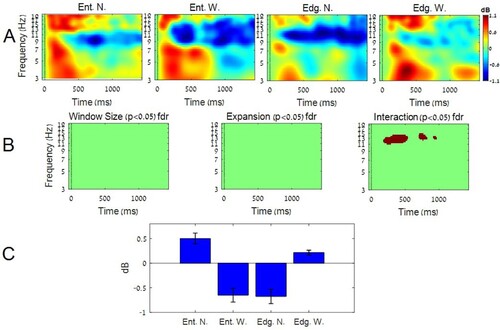
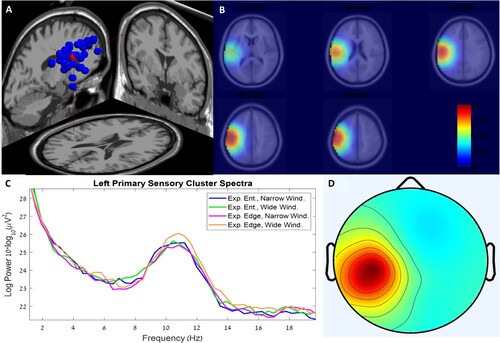
Figure 9. Left primary sensory (lePS) Cluster – (A) Cluster mean DIPFIT dipole location, (B) fMRI presentation of mean DIPFIT dipole location, (C) Cluster mean power spectrum, 10 × log10 (_V2/Hz)), for each condition, (D) topographic scalp map of the cluster.
Similar to the behavioural results of density perception ratings, an interaction was found between wall location and window size factors in the ERD modulation measure. However, the interaction was different in the ERD modulation measure. While the interaction in the perceived density ratings reflected a similar trend in both entrance and edge conditions (higher perceived density ratings in narrow window conditions), in the ERD modulation measure, the interaction reflected the incongruence in the wider wall location and window size factors. Specifically, there was significantly more ERD modulation when one of the factors was relatively narrow, and the other was relatively wide (i.e. either entrance condition and wide window, or edge condition and narrow window).
The MNI coordinates for the centroid of the dipole cluster of the first of these IC clusters was (−51, −18, 40), which falls within the left primary sensory cortex (lePS). The mean residual variance was 8.72% (Figure ). We will refer to this IC cluster as lePS in accordance with the location of the centroid. In total, 41 ICs from 24 participants contributed to this cluster. Statistical tests across all four conditions indicated ERSP modulation in the alpha range of 175–540 ms poststimulus (Figure (a–c)).
Figure 10. Left primary sensory (lePS) Cluster IC illustration – illustration of activities in left primary sensory (lePM) cluster (panels a, b, and c). (a) event-related spectral perturbation (ERSP) for lePS cluster respectfully. Columns of the figure from left to right present each of the two conditions: Narrow Window and Wide Window. In (b) pixels that are highlighted in red showed statistical differences across levels of Window Size (p < 0.05 FDR corrected). In (c) the mean values of the highlighted pixels in B. Error bars are for SE.
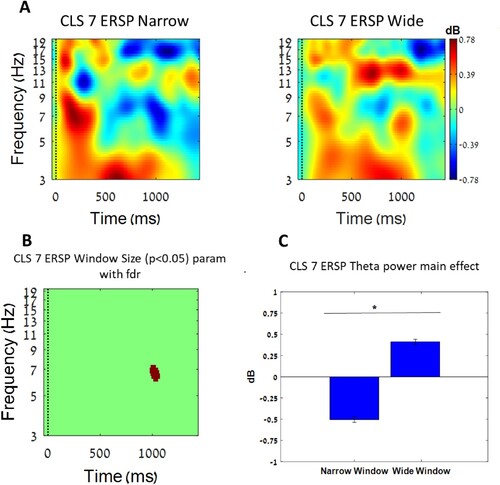
When comparing the activity to a common baseline of all conditions, a main effect was seen for window size for Theta power in the (lePM) cluster so that increased Theta oscillations were observed in the Wide Window conditions (See Figure ). This aligns with perceived Density ratings so that it is inverted with the pattern of results, where there was increased Theta power, there were lower perceived density ratings (main effect of Window Size in perceived density). In addition, it directly aligns with positive affect ratings so that increased Theta power was associated with increased positive affect ratings (main effect of Window Size in positive affect ratings).
EEG results summary: Two main clusters were analysed – one cluster centred in rPS and one centred in lePS. In the rPS cluster, in which ERD modulation (Mu-Rhythm) was detected, there was an interaction of window size and wider wall location such that there was stronger ERD modulation in incongruent conditions – either the condition where the apartment becomes narrow but there is a wide window, or the condition where the apartment becomes wide but there is a narrow window. In the lePS cluster, there was increased Theta oscillations in the Wide Window conditions.
Discussion
The results of perceived density ratings in this study are in line with our first hypothesis, according to which trapezoid apartments with a wider wall at the entrance received higher perceived density ratings than apartments with wider walls at the far end, and ratings of apartments with a wide window were lower than ratings of apartments with a narrow window. In addition, there was an interaction for both design features on perceived density ratings, such that in the edge condition, differences between the narrow and wide windows were more pronounced than in the entrance condition. Additionally, in line with our hypothesis of positive affect ratings, there were higher positive affect ratings in the edge conditions as compared to the ratings of the entrance conditions, and higher ratings in the wide window conditions compared to narrow window conditions. An interaction of both design features (location of wide wall and window size) was also observed, indicating that the narrow window conditions were always rated lower compared to the wide window conditions– a difference that was more pronounced in edge conditions than in the entrance conditions.
In accordance with our prediction, there was. ERD Modulation of activity (Mu-Rhythm) in the sensory-motor cortex such that Mu-Rhythm was stronger in incongruent conditions including conditions in which the wider wall was at the edge of the apartment with a narrow widow, and conditions in which the wider wall was at the entrance with a wide widow. This result indicates the combined effect of both design features on the oscillatory dynamics (i.e. Mu-Rhythm) in right primary sensory cortices. The modulation of ERD was evident as early as 175 ms post-stimulus presentation, which suggests that perceived density of spaces can be linked to early stages in visual processing, and that the architectural design features examined in the current study already have an impact at the earliest stages of perceptual organization.
The finding of modulation of ERD in the rPS cluster is in line with previous studies that also found more pronounced effects of ERD modulation activity over the rPS as compared to the lePS. For example, Rüther et al. (Citation2014) found modulation of ERD of activity over the right sensory motor cortex in the observation of both observed and visually explored objects, with a less clear left lateralized modulation for familiar objects. In addition, Lasaponara et al. (Citation2019) compared ERD modulation over the left and right sensory motor cortices during performance of a spatial attention task. Their findings indicate that while there was significant ERD modulation over the right sensory motor cortex for targets in the contralateral visual field (i.e. the left visual field), there was no significant ERD modulation over the left sensory motor cortex for targets in the contralateral visual field (i.e. the right visual field).
In our study, the apartments were depicted as video-clips, with movement within the apartment beginning at a consistent timepoint (i.e. two seconds post video-clip onset), following a two-second static presentation of the apartment entrance. Studies indicate that Mu-rhythm is linked to ‘motor planning’, i.e. the calculating of affordance of the body in a space and in relation to objects within that space (Derambure et al. Citation1997; Llanos et al. Citation2013; Sabate et al. Citation2012). In addition, alpha band suppression (i.e. Mu-Rhythm) has been observed prior not only to actual motor output, but also to imagined motor action in both phase-locked and nonphase-locked responses (Llanos et al. Citation2013), as anticipated in our hypothesis regarding the depiction of virtual apartments eliciting imagined motor action. Additionally, Mu-rhythm has been shown to be somatotopically modulated by spatial somatosensory attention (Anderson and Ding Citation2011; Jones et al. Citation2010). Thus, the results of the current study suggest that perceived density is related to action planning, and that architectural design features, such as an expanding space, can modulate spatial attention at early stages of scene perception. As an example, when designing the location of an entrance, the amount of visual space should be considered. So, for a given space it should be considered to locate the entrance in a position that would take advantage of a relatively higher visibility of the space.
The increased Theta power in the wide window condition supports the hypothesis according to which reduced visual feedback to a given motor plan affects density perception. However, there was a main effect for window size, but not for the location of the wide wall in the apartment (apartment entrance or edge). Thus, this measure cannot be directly linked to the cognitive function of estimating the amount of space in each environment; it may, however, be associated with a sense of openness in the presented visual scene. In support of this idea, while perceived density ratings were aligned with our predictions, Positive Affect ratings resulted only in a main effect of Window size (as well as an interaction). That is, according to the findings of the current study, increased Theta oscillations in the left MTL might be more aligned with a sense of openness rather than a direct estimation of the amount of space in each visual scene. Of importance here, is that the increased Theta oscillations were significant approximately 1 s prior to the initiation of movement, and thus related to movement planning.
The results of the current study are also in accordance with Vecchiato et al. (Citation2015) who reported increased Mu-rhythm and Theta power during rating of presence. According to the authors, these findings are in line with the embodied cognition approach, according to which our reality, as experienced through our body, is intrinsically tied to perception, action, and emotion (Jelić et al. Citation2016; Sestito, Flach, and Harel Citation2018). In contrast to the embodied approach, the supramodal functioning approach posits that there are abstract features to perception, independent of a certain perceptual modality. The experimental design could be used to test whether the results are consistent beyond modalities (supporting the abstract approach) or are specific depending on the modality of input (supporting the embodied approach).
Limitations and future directions
In the current study, we did not directly correlate the neural activity with behavioural ratings. Therefore, we limit our conclusion to that both initial neural processing (i.e. perception) and rating of density perception are affected by both location of the wider wall and the size of the window. In addition, the relationship between the perceived image of an apartment space and its conscious evaluation is not necessarily direct, and the same external environment is processed separately with regards to perception and with regards to a conscious evaluation of the perceptual experience. That is, understanding perception of the environment does not directly indicate what conscious evaluation of a scene might be. However, these research findings may offer insight on the design factors that play a role in both early perception and conscious, subjective experience of these settings, and serve as guidelines for designers in the future. This research focused on edge conditions of dense environments that are becoming more and more relevant. The knowledge to create such positive affect in such dense environments is significant regarding the wellbeing of the dwellers. Designing an ‘inviting’ space, expanding in its geometry and enlarging the perceived openness with large windows will contribute to future better design.
Another limitation of the study is the presentation of apartment models in a 2-dimentional (2D) video-clip. While it would be optimal to test the research questions in more realistic settings (such as a 3-dimentional virtual reality environment), 2D presentations are frequently used for real-world decision making in other contexts such as head mounted displays (HMDs) used by pilots as well as training simulators for various training purposes. In these contexts, it has been shown that 3D virtual environments do not always have advantages over 2D presentations (McIntire and Liggett, Citation2014). Therefore, in spite of this limitation, the results of this study are sufficient to conclude that behavioural and neural measures of perception of density are indicative of changes in an architectural design/scene and warrant future studies on the relationship between these measures.
Supplemental Material
Download MS Word (304.7 KB)Disclosure statement
No potential conflict of interest was reported by the author(s).
Additional information
Funding
References
- Aghajan, Z. M., P. Schuette, T. A. Fields, M. E. Tran, S. M. Siddiqui, N. R. Hasulak, …, N. Suthana. 2017. “Theta Oscillations in the Human Medial Temporal Lobe During Real-World Ambulatory Movement.” Current Biology 27 (24): 3743–3751.
- Anderson, K. L., and M. Ding. 2011. “Attentional Modulation of the Somatosensory mu Rhythm.” Neuroscience 180: 165–180.
- Cheng, V. 2009. “Understanding Density and High Density.” Designing High-Density Cities 37–51.
- Cheng, B. K. 2010. Human Perception of Urban Density (Doctoral dissertation).
- Churchman, A. 1999. “Disentangling the Concept of Density.” Journal of Planning Literature 13 (4): 389–411.
- Delorme, A., and S. Makeig. 2004. “EEGLAB: An Open Source Toolbox for Analysis of Single-Trial EEG Dynamics Including Independent Component Analysis.” Journal of Neuroscience Methods 134: 9–21. https://doi.org/10.1016/j.jneumeth.2003.10.009.
- Derambure, P., J. L. Bourriez, L. Defebvre, F. Cassim, E. Josien, A. Duhamel, A. Destee, and J. D. Guieu. 1997. “Abnormal Cortical Activation During Planning of Voluntary Movement in Patients with Epilepsy with Focal Motor Seizures: Event-Related Desynchronization Study of Electroencephalographic mu Rhythm.” Epilepsia 38 (6): 655–662. https://doi.org/10.1111/j.1528-1157.1997.tb01234.x.
- Dockray, S., and A. Steptoe. 2010. “Positive Affect and Psychobiological Processes.” Neuroscience & Biobehavioral Reviews 35 (1): 69–75. https://doi.org/10.1016/j.neubiorev.2010.01.006.
- Dufour, B., F. Thénault, and P. M. Bernier. 2018. “Theta-Band EEG Activity Over Sensorimotor Regions is Modulated by Expected Visual Reafferent Feedback During Reach Planning.” Neuroscience 385: 47–58.
- Ergan, S., Z. Shi, and X. Yu. 2018. “Towards Quantifying Human Experience in the Built Environment: A Crowdsourcing Based Experiment to Identify Influential Architectural Design Features.” Journal of Building Engineering 20: 51–59.
- Fisher-Gewirtzman, D. 2017. “The Association Between Perceived Density in Minimum Apartments and Spatial Openness Index Three-Dimensional Visual Analysis.” Environment and Planning B: Urban Analytics and City Science 44 (4): 764–795.
- Fisher-Gewirtzman, D. 2018. “Perception of Density by Pedestrians on Urban Paths: An Experiment in Virtual Reality.” Journal of Urban Design 23 (5): 674–692. https://doi.org/10.1080/13574809.2018.1444471.
- Fisher-Gewirtzman, D., M. Burt, and Y. Tzamir. 2003. “A 3-D Visual Method for Comparative Evaluation Of Dense Built-Up Environments.” Environment and Planning B: Planning and Design 30: 575–587.
- Hari, R. 2006. “Action–Perception Connection and the Cortical Mu Rhythm.” Progress in Brain Research 159: 253–260. https://doi.org/10.1016/S0079-6123(06)59017-X.
- Jelić, A., G. Tieri, F. De Matteis, F. Babiloni, and G. Vecchiato. 2016. “The Enactive Approach to Architectural Experience: A Neurophysiological Perspective on Embodiment, Motivation, and Affordances.” Frontiers in Psychology 7: 481. https://doi.org/10.3389/fpsyg.2016.00481.
- Jones, S. R., C. E. Kerr, Q. Wan, D. L. Pritchett, M. Hämäläinen, and C. I. Moore. 2010. “Cued Spatial Attention Drives Functionally Relevant Modulation of the mu Rhythm in Primary Somatosensory Cortex.” The Journal of Neuroscience 30 (41): 13760–13765. https://doi.org/10.1523/JNEUROSCI.2969-10.2010.
- Koltsova, A., B. Tunçer, and G. Schmitt. 2013. Visibility Analysis for 3D Urban Environments.
- Lasaponara, S., M. Pinto, M. Aiello, F. Tomaiuolo, and F. Doricchi. 2019. “The Hemispheric Distribution of α-Band EEG Activity During Orienting of Attention in Patients with Reduced Awareness of the Left Side of Space (Spatial Neglect).” The Journal of Neuroscience 39 (22): 4332–4343. https://doi.org/10.1523/JNEUROSCI.2206-18.2019.
- Lawson, B. 2009. “The Social and Psychological Issues of High-Density City Space.” Designing High-Density Cities 309–316.
- Llanos, C., M. Rodriguez, C. Rodriguez-Sabate, I. Morales, and M. Sabate. 2013. “Mu-rhythm Changes During the Planning of Motor and Motor Imagery Actions.” Neuropsychologia 51: 1019–1026. https://doi.org/10.1016/j.neuropsychologia.2013.02.008.
- Mcintire, J. P., and K. K. Liggett. 2014, November. “The (Possible) Utility of Stereoscopic 3D Displays for Information Visualization: The Good, the Bad, and the Ugly.” In 2014 IEEE VIS International Workshop on 3DVis (3DVis), 1–9. IEEE.
- Miyakoshi, M., N. Kanayama, T. Iidaka, and H. Ohira. 2010. “EEG Evidence of Face-Specific Visual Self-Representation.” Neuroimage 50 (4): 1666–1675. https://doi.org/10.1016/j.neuroimage.2010.01.030.
- Mullen, T. R., C. A. Kothe, Y. M. Chi, A. Ojeda, T. Kerth, S. Makeig, T.-P. Jung, and G. Cauwenberghs. 2015. “Real-time Neuroimaging and Cognitive Monitoring Using Wearable Dry EEG.” IEEE Transactions on Biomedical Engineering 62 (11): 2553–2567. https://doi.org/10.1109/TBME.2015.2481482.
- O'Regan, J. K., and A. Noë. 2001. “A Sensorimotor Account of Vision and Visual Consciousness.” Behavioral and Brain Sciences 24 (5): 939. https://doi.org/10.1017/S0140525X01000115.
- Peirce, J. W., J. R. Gray, S. Simpson, M. R. Macaskill, R. Höchenberger, H. Sogo, E. Kastman, and J. Lindeløv. 2019. PsychoPy2: Experiments in Behavior Made Easy.
- Pion-Tonachini, L., K. Kreutz-Delgado, and S. Makeig. 2019. “ICLabel: An Automated Electroencephalographic Independent Component Classifier, Dataset, and Website.” NeuroImage 198: 181–197. https://doi.org/10.1016/j.neuroimage.2019.05.026.
- Rapoport, A. 1975. “Toward a Redefinition of Density.” Environment and Behavior 7 (2): 133–158.
- Rizzolatti, G., and R. Camarda. 1987. “Neural Circuits for Spatial Attention and Unilateral Neglect.” Advances in Psychology 45: 289–313.
- Rüther, N. N., E. C. Brown, A. Klepp, and C. Bellebaum. 2014. “Observed Manipulation of Novel Tools Leads to mu Rhythm Suppression Over Sensory-Motor Cortices.” Behavioural Brain Research 261: 328–335. https://doi.org/10.1016/j.bbr.2013.12.033.
- Sabate, M., C. Llanos, E. Enriquez, and M. Rodriguez. 2012. “Mu Rhythm, Visual Processing and Motor Control.” Clinical Neurophysiology 123 (3): 550–557. https://doi.org/10.1016/j.clinph.2011.07.034.
- Sestito, M., J. Flach, and A. Harel. 2018. “Grasping the World from a Cockpit: Perspectives on Embodied Neural Mechanisms Underlying Human Performance and Ergonomics in Aviation Context.” Theoretical Issues in Ergonomics Science 19 (6): 692–711. https://doi.org/10.1080/1463922X.2018.1474504.
- Sharples, S., S. Cobb, A. Moody, and J. R. Wilson. 2008. “Virtual Reality Induced Symptoms and Effects (VRISE): Comparison of Head Mounted Display (HMD), Desktop and Projection Display Systems.” Displays 29 (2): 58–69. https://doi.org/10.1016/j.displa.2007.09.005.
- Shemesh, A., M. Bar, and Y. J. Grobman. 2015. “Space and Human Perception”.
- Shemesh, A., R. Talmon, O. Karp, I. Amir, M. Bar, and Y. J. Grobman. 2017. “Affective Response to Architecture – Investigating Human Reaction to Spaces with Different Geometry.” Architectural Science Review 60 (2): 116–125. https://doi.org/10.1080/00038628.2016.1266597.
- Sivam, A., S. Karuppannan, and M. C. Davis. 2012. “Stakeholders’ Perception of Residential Density: A Case Study of Adelaide.” Australia. Journal of Housing and the Built Environment 27: 473–494.
- Solimini, A. G. 2013. “Are There Side Effects to Watching 3D Movies? A Prospective Crossover Observational Study on Visually Induced Motion Sickness.” PloS one 8 (2): e56160. https://doi.org/10.1371/journal.pone.0056160.
- Spreiregen, P. D. 1965. Urban Design. McGraw-Hill.
- Trossman-Haifler, Y., and D. Fisher-Gewirtzman. 2022. “How Urban Wellbeing is Influenced by Spatial Urban Parameters (Density, Morphology, Vegetation & Commerce), as Examined in a VR Framework.” Architectural Science Review, https://doi.org/10.1080/00038628.2022.2091510.
- Vartanian, O., G. Navarrete, A. Chatterjee, L. B. Fich, J. L. Gonzalez-Mora, H. Leder, …, M. Skov. 2015. “Architectural Design and the Brain: Effects of Ceiling Height and Perceived Enclosure on Beauty Judgments and Approach-Avoidance Decisions.” Journal of Environmental Psychology 41: 10–18.
- Vecchiato, G., G. Tieri, A. Jelic, F. De Matteis, A. G. Maglione, and F. Babiloni. 2015. “Electroencephalographic Correlates of Sensorimotor Integration and Embodiment During the Appreciation of Virtual Architectural Environments.” Frontiers in Psychology 6: 1944. https://doi.org/10.3389/fpsyg.2015.01944.