
ABSTRACT
Drought is a regular feature of Australian landscapes, and its intensity and frequency are likely to increase in a changing climate. Land managers are grappling with managing the impacts of drought, with large-scale die-offs occurring more frequently in forests globally. Drought-induced tree mortality has caused major impacts in Pinus radiata plantations in New South Wales, Australia, with extended drought, heatwaves and pest and disease attacks all recognised as predisposing, inciting or contributing factors. The extent and severity of drought-induced tree mortality has been mapped across the Pinus plantation estate in New South Wales annually since 1996. In this study, we used this long-term empirical data to develop a model of drought risk for P. radiata plantations. Using random forest, we identified site index, annual temperature, annual rainfall, elevation and increasing number of hot days (above 20°C and 35°C) as the influencing variables associated with drought-induced tree mortality. We then used this model to look at the risk of drought-induced tree mortality under climate-change scenarios in 2050 and 2070. Although forest managers already understand the drought risk in their estates, we developed an empirical model and produced GIS layers at high resolution (100 m) to assist in more accurately and effectively managing drought. The accuracy and precision of our model (overall accuracy 89.2%, kappa 0.75) enables forest managers to include it in their decision-making in the management of the potential impacts of drought on the current plantation estate (e.g. via modified silvicultural regimes) as well as in the future (e.g. modified silvicultural regimes or planting drought-tolerant genotypes).
Introduction
The increase in drought and heat-induced tree mortality in forests worldwide has been well documented (Allen et al. Citation2010; Choat et al. Citation2012). Landscape-scale die-offs in Europe (Peñuelas et al. Citation2001; Senf et al. Citation2020; Gazol and Camarero Citation2021; Kharuk et al. Citation2021), North America (Breshears et al. Citation2005; Hogg et al. Citation2008; Van Mantgem et al. Citation2009; Fettig et al. Citation2019), South America (Phillips et al. Citation2009), Africa and Asia (Allen et al. Citation2010; Li et al. Citation2020) have been associated with severe and/or multi-year droughts and elevated temperature extremes. The exact mechanism of these mortality events has been debated (Allen et al. Citation2010; McDowell and Sevanto Citation2010; Sala et al. Citation2010; Anderegg et al. Citation2012) but is likely related to carbon starvation and hydraulic failure (McDowell et al. Citation2008). Increasing temperature and prolonged drought also affect the dynamics of forest insects and pathogens and tree host defences (Ayres and Lombardero Citation2000; Logan et al. Citation2003; Desprez-Loustau et al. Citation2006; Dukes et al. Citation2009), with numerous examples of damaging pest outbreaks associated with adverse climatic factors (e.g. Breshears et al. Citation2005; Raffa et al. Citation2008; Bentz et al. Citation2009; Hlásny et al. Citation2021). These three mechanisms are not mutually exclusive; for example, carbon starvation can reduce tree defences, thus increasing susceptibility to pests and diseases (McDowell et al. Citation2008; Raffa et al. Citation2008; Allen et al. Citation2010).
Drought has also caused landscape-scale tree mortality in Australian forests. Multi-year droughts were implicated in regional-scale mortality of native Eucalyptus and Corymbia forests in Queensland, affecting more than 220 000 ha (Fensham and Holman Citation1999; Fensham et al. Citation2019). Extreme drought and heat triggered dieback and death of eucalypt forests in south-western Australia in 2010–2011 (Matusick et al. Citation2012; Matusick et al. Citation2013). In 2019, eastern Australia experienced one of its driest and hottest years on record, with dieback and mortality in mixed eucalypt forests (Nolan et al. Citation2021; Losso et al. unpubl.) across more than 2.5 million ha in New South Wales (NSW) (Hislop et al. unpubl.). Mitchell et al. (Citation2014) documented 15 separate significant forest mortality events across multiple ecosystems and climates in Australia associated with a combination of extreme drought and heatwaves. They estimated that extreme droughts that lead to significant forest mortality occur every 24 years, on average, in Australia.
Pinus plantations have also regularly been affected by drought in Australia. There is a history of extensive mortality of Pinus pinaster Ait. and Pinus radiata D.Don due to drought in south-western Australia (Butcher and Havel Citation1976; Butcher Citation1977; McGrath et al. Citation1991), with Eucalyptus globulus L. plantations also affected during severe droughts in Western Australia (Harper et al. Citation2009; White et al. Citation2009). Similarly, episodic periods of drought have resulted in dead-topping and tree mortality in P. radiata plantations in NSW (Carnegie Citation2008; Stone et al. Citation2012), Victoria (Millikan and Anderson Citation1957; Marks and Minko Citation1969; Wright and Marks Citation1970), South Australia (Boomsma Citation1949) and the Australian Capital Territory (Johnstone Citation1964; Ratkowsky et al. Citation1981). Elsewhere, dead-topping and tree mortality associated with prolonged droughts have been observed in Pinus plantations in New Zealand and Chile (Chou Citation1987), Africa (Swart et al. Citation1985; Stiki Citation1994) and the United States of America (Stanoz Citation1994). Common factors in all these drought-induced damage episodes include moisture stress during hot, dry summers, shallow or stony soils, and delayed thinning or high tree density. Pests and diseases can compound these factors. In Australia, Ips grandicollis (Eichhoff) and Diplodia sapinea (Fries) Fuckel are the two main biotic agents that magnify impacts on Pinus plantations during drought events (Wright and Marks Citation1970; Butcher and Havel Citation1976; Morgan Citation1989; Lewis and Fergusson Citation1993; Elliott et al. Citation1998). Both are stress agents, with water stress known to increase tree susceptibility to pests and pathogens (Desprez-Loustau et al. Citation2006; Bentz et al. Citation2009) and subsequent colonisation resulting in blue-staining, dead-topping and tree mortality in P. radiata.
The world’s forests are likely to experience an increase in prolonged droughts and extreme temperatures under future climate-change scenarios (IPCC Citation2007, Citation2021), leading to increased broad-scale climate-induced forest mortality (Adams et al. Citation2009; Allen et al. Citation2010; Choat et al. Citation2012). Managing these impacts in natural and plantation forests will be a challenge for natural-resource managers. In Australia, climate-change predictions for Pinus plantations reveal increased average temperatures, reduced average rainfall and greater intensity and severity of droughts and heatwaves, all likely leading to increased tree mortality (Battaglia et al. Citation2009; Pinkard et al. Citation2014). Adaptive management strategies will be needed to ensure ongoing plantation profitability and viability, including modified silvicultural regimes, improved pest management and even species selection (Pinkard et al. Citation2014; Pinkard et al. Citation2015). Understanding the spatio-temporal risk of climate change on the plantation estate is essential to prepare for potential impacts and develop management strategies (Battaglia et al. Citation2009; Pinkard et al. Citation2014; Pinkard et al. Citation2015). This is true for the current plantation estate and that of the future. Australia needs a further 400 000 ha of plantations to ensure ‘sovereign capability’ in timber supply for future housing demand (Australian Forest Products Australia Citation2018; Commonwealth of Australia Citation2018; Woods and Houghton Citation2022). Identifying land for such plantations will require knowledge of potential climate-change impacts on plantation productivity and forest health. Due to a range of factors, including land availability and costs, recent plantation expansion has relied on ex-farmland in lower-rainfall sites (Moreno-Chan et al. Citation2007), potentially compounding the effects of future climate change.
Forest health surveillance has been conducted over much of Australia’s plantation estate since the mid-1990s, including aerial and ground surveys (Carnegie et al. Citation2008; Carnegie, Lawson et al. Citation2018). Despite regular outbreaks and epidemics of known damage agents, little research has been conducted to characterise the spatial variation in severity of these damage agents to assist in plantation management. Numerous studies have investigated the potential distribution of forest pests and pathogens in Australia using climate niche models (e.g. Wharton and Kriticos Citation2004; Carnegie et al. Citation2006; Carnegie et al. Citation2018; Kriticos et al. Citation2013; Carnegie, Venn et al. Citation2018), including under climate change (Watt et al. Citation2011; Pinkard et al. Citation2017; Berthon et al. Citation2018), but very few have developed spatial models of potential severity or impact to assist in pest management. Using field-validated severity data, Pinkard et al. (Citation2010) investigated the spatio-temporal risk of epidemics of mycosphaerella leaf disease in Eucalyptus plantations, and Kube and Wardlaw (unpubl.) developed hazard site maps for spring needle cast (associated with Cyclaneusma minus (Butin) Di Cosmo, Peredo & Minter) in P. radiata plantations (Wardlaw Citation2008).
In this study, we use an extensive spatial and temporal dataset from forest health surveys in NSW (Carnegie et al. Citation2008), where the extent and severity of drought-induced tree mortality have been mapped over more than 200 000 ha of Pinus plantations annually since 1996. This provides a unique opportunity to utilise a long-term spatial dataset to develop a model of drought-induced tree mortality to assist in current and future management of the Pinus plantation estate. We aim to develop risk maps for drought-induced mortality that can be used in site-based planning considerations, now and in the future (i.e. under climate-change scenarios). Although forest managers are likely to have already identified areas at risk of drought in their current estates, we plan to provide a more accurate, quantifiable and robust model, with outputs in a geographic information system (GIS) platform and including potential future climate-change impacts.
Methods
Study area
The study was conducted within Forestry Corporation of NSW P. radiata plantations in the Tumut and Bathurst management areas in NSW (). The Tumut plantation estate (35°18ʹ38”S, 148°13ʹ50”E) is approximately 96 000 ha, has an altitudinal range of approximately 300–1200 m above sea level (masl), and is in a winter-rainfall zone, while the Bathurst plantation estate (33°24ʹ40”S, 149°34ʹ44”E) is approximately 73 000 ha, also has an altitudinal range of approximately 300–1200 masl, and its rainfall generally falls more evenly through the year (Turner et al. Citation2001; Raymond Citation2011). The Tumut Management Area is spread over approximately 5000 km2 and the Bathurst Management Area is spread over approximately 7000 km2. In each region, individual and coalescing plantations are interspersed among agricultural land and native forests (). The mean and range in key structural and environmental variables (site index, annual rainfall, digital elevation model – DEM – and annual temperature) are provided in .
Figure 1. Map of New South Wales (NSW) showing the locations of the two Pinus radiata plantation estates studied
Response variable: tree mortality data
Forest health surveys were conducted over the Forestry Corporation of NSW softwood plantation estate annually from 1996 to 2021 (data from 1997 to 2020 reported here). Aerial surveys were conducted in a helicopter flying at approximately 60–80 knots and 50–150 m above tree height, and the extent and severity of all damaging agents were mapped as described by Carnegie et al. (Citation2008). Surveys were conducted in winter (generally from late May to early September) to coincide with the peak in symptom expression of key pests (e.g. Sirex noctilio Fabricius, Dothistroma septosporum (Dorogin) Morelet, and drought-induced tree mortality). From 1996 to 2007, typical sketch-mapping techniques on hard-copy (paper) maps were used; from 2008, digital aerial sketch-mapping was conducted using a PC tablet and the mapping program GeoLink©. Experienced aerial surveillance officers mapped the extent and incidence of tree mortality, with incidence estimated in the categories 1–5%, 5–15%, 15–30%, 30–45%, 45–75% and >75%. Although tree mortality (i.e. whole tree dead) was the most prevalent symptom of drought, dead-topping (e.g. top one-third of tree dead) was also observed; for analysis, these have been combined as ‘tree mortality’. Ground surveys were conducted on a proportion of areas mapped to determine causal agent(s) of mortality. This entailed walking transects through affected stands, observing trees for evidence of bark beetle (I. grandicollis) attack (i.e. frass, exit holes, galleries under bark), cutting into trees with an axe to look for blue stain associated with D. sapinea, and felling trees to conduct the same observations further up the tree. When no such symptoms were found and no other cause could be ascribed (e.g. below), we assumed the tree had died solely from drought, based on previous experience. Tree mortality associated with other damage agents, such as S. noctilio, Phytophthora cinnamomi Rands, waterlogging, frost and vertebrate damage (Carnegie et al. Citation2008; Carnegie Citation2018), was mapped separately and is not included in this analysis.
Although aerial and ground surveys captured data at a sub-compartment level, the actual GIS data were collated at two different resolutions. From 1997 to 2005, aerial sketch-mapping and ground-truth data were captured at sub-compartment resolution onto hard-copy maps and then collated in a textural database. These textural data were later transferred into spatial data but capturing data at the compartment level, thus in many instances overrepresenting the actual damage mapped. In 2006 and 2007, surveillance data were captured onto hard-copy maps but digitised in GIS at the true extent of the data – that is, the sub-compartment level. From 2008 to 2021, aerial sketch-mapping and ground-truth data were captured in electronic format (onto tablet PC and iPad), with the subsequent spatial data representing the true extent of mapped damage.
Predictor variables
Site index
Site productivity is a quantitative estimate of the potential of a site to produce plant biomass. It is often quantified as an index, typically site class or site index. Most commonly used site indices are based on or derived from estimates of stand height at a given age. A site index produced by the Forestry Corporation of NSW was used here, defined as the mean top height (average height of the 100 largest trees – based on diameter – ha−1) at age 20 years (Woollons Citation2003). Due to a lack of predictions for site index, we have used the current value of site index for future scenarios.
Topographic data
Topographic data used in this study included a DEM at 25 m resolution as a raster layer from the Forestry Corporation of NSW. A number of topographic variables were created using this layer. The variables considered for the model were elevation; slope; aspect; topographic position index (Wilson et al. Citation2007) and topographic wetness index (Quinn et al. Citation1995). The spatial resolution of all topographic variables was 25 m.
Soils data
Soils data were downloaded from the Soil and Landscape Grid of Australia.Footnote1 The soil variables extracted were available water capacity; bulk density; clay percentage; depth of regolith in metres; depth of soil in metres; organic carbon percentage; pH CaCl2; sand percentage; silt percentage; total nitrogen percentage; and total phosphorus percentage. The spatial resolution for soils data was 3 arc s (approx. 90 m).
Climate data
The climate variables used in this study were based on a previous dataset used in the Forest Climate Risk tool,Footnote2 a web-based application used to explore climate-related risks in the plantation industry. The full list of variables used in the analysis is provided in . The variables are broadly categorised as temperature (mean, threshold-based and heatwave days); rainfall (mean); drought (drought frequency and intensity); and forest fire danger index.
A heatwave is defined as a period of at least three days in a row where each day is in the top 10% of values for maximum temperature for that day and grid point (Perkins and Alexander Citation2012). Annual heatwave days are the total number of days that satisfy these criteria during the months when heat stress is considered important (November to March).
Drought is derived from values of the monthly climatic water deficit (precipitation minus potential evaporation). These data are used to compute a probabilistic drought index (standardised precipitation evapotranspiration index – SPEI), providing a standardised assessment of drought conditions regardless of climate across different regions (Vicente-Serrano et al. Citation2010). This study uses drought variables based on an estimated monthly drought using conditions from the previous 12 months.
Drought is defined as periods in which the monthly SPEI drops below a value representing the 17th percentile – that is, the driest 17% of all months (McKee et al. Citation1993). Drought months per year refers to the mean number of months in drought per year across the period of interest (i.e. a 30-year projection period). Mean drought intensity was derived from the sum of monthly SPEI values during drought periods divided by the number of months in drought across the period of interest. Extreme drought months per year are also presented. Extreme drought occurs when monthly water deficit drops below a value representing the second percentile. A previous study on the response of Australian forests to drought found that this threshold of SPEI was associated with large-scale mortality events (Mitchell et al. Citation2014).
Fire danger is computed for a subset of weather stations across Australia. It is based on the Macarthur Forest Fire Danger Index (FFDI) (Noble et al. Citation1980) computed for a daily time series on historical (1986–2005) and projected climate data. These data are sourced from the Climate Change in Australia tool.Footnote3 Fire danger for individual grid cells is extracted from the nearest weather station where fire data were available using a nearest-neighbour approach. The daily FFDI values were split into five categories: high (12–25); very high (25–50); severe (50–75); extreme (75–100); and catastrophic (>100). The variables used in the model were calculated from the mean number of days for each category across the period of interest ().
The analysis uses climate data of maximum and minimum temperature and rainfall from an historic ‘baseline’ period and projections centred on the target years of 2050 and 2070. The historic baseline dataset was generated from daily observations for 1951–2015. These data are extracted for the plantation regions of interest and are based on a gridded dataset of 0.05° resolution (approx. 5 km × 5 km grids) available from the Queensland Government’s SILO database.Footnote4
The climate projections are derived from global climate model (GCM) data used for the fifth assessment report of the Intergovernmental Panel on Climate Change (CMIP5). Rather than attempting to capture climate variability from the entire suite of CMIP5 models, three future scenarios are used to cover the range in potential future conditions. The ‘Climate Futures’ approach (Whetton et al. Citation2012) was used to select three potential future climates broadly categorised as cool-wet; hot-dry; and most likely. These three climate futures correspond to the GCMs: NORESM1-M, GFDLESM2M and MIROC5, respectively. The climate scenarios are based on a ‘business as usual’ future emissions scenario (Representative Concentration Pathway – RCP – 8.5) that represents comparatively high greenhouse-gas emissions to 2050 and 2070 (i.e. the target years).
To capture finer-scale changes in climate across plantation estates, we used downscaling methods to perturb local climate to produce future scenarios at the same spatial resolution (0.05°). A 30-year time series of historical data (1986–2015) was downscaled to a future climate using a pattern scaling approach (Mitchell Citation2003; Ricketts et al. Citation2013). This preserved the variability inherent in the historical weather sequences. The projections were generated from the Queensland Government’s consistent climate scenarios projectFootnote5 for the two target future years of 2050 and 2070. Briefly, monthly trends in relevant meteorological variables were extracted from the three selected GCMs to represent annual change per degree of global warming. These ‘change factors’ were applied to the historic climate data to produce a 30-year climatology centred on the particular target year. The climate variables used for this study are mean annual values calculated from the daily time series.
Training data
Aerial surveys capture data in 1–5%, 5–15%, 15–30%, 30–45%, 45–75% and >75% tree mortality categories. The response variable for the incidence model was calculated by first taking the mid-point of the incidence interval and then calculating the total value by adding across the years. This was calculated for each pixel. The total value was then divided into four classes: <5%, as no drought-induced mortality (c0); 5–15%, as low drought-induced mortality (c1); 15–60%, as medium drought-induced mortality (c2); and >60%, as high drought-induced mortality (c3). A sample of 20 000 data points from a total of 145 509 points was extracted from the Bathurst Management Area using a systematic sampling design with a random start point, and the drought incidence (c0–c3) was calculated. The data for the soil, topographic and climate predictor variables were also extracted from the spatial layers. Tumut Management Area plantations cover a larger area; hence, 30 000 sampling points from a total of 216 978 points were selected, and both the drought and predictor variables were extracted from the respective spatial layers.
Model
Random forest
Random forest (Breiman Citation1994, Citation2001; Ripley Citation1996; Liaw and Wiener Citation2002; Hastie et al. Citation2009) was used to model the classification. It is a machine learning non-parametric classification method with a number of desirable characteristics, such as good accuracy, robustness to outliers and noise, speed, internal estimation of error and estimation of variable importance. Model parameters applied included mtry – the number of variables randomly sampled as candidates at each tree node split; and ntrees – the number of decision trees grown. Mtry was set as the square root of the number of predictor variables. The ntrees parameter was selected after an iterative process to maximise the accuracy. The data were split into training and validation: 70% was used as training data and 30% was used for testing and validating the model.
Variable selection
Summary statistics, plots and tables were used to identify the relevant and important variables. Some variables had only a few non-zero values; these were removed. A correlation matrix using Spearman’s rank correlation was used to identify a set of uncorrelated predictor variables and remove the potential for multi-collinearity in the models (Chatterjee et al. Citation2000). Where a correlation of greater than 0.8 was found between two or more variables, only one variable – the most highly correlated with drought risk – was selected from the group. After training the model, a variable importance plot was used to identify which variables have the most predictive power. Variables with high importance are drivers of the outcome and their values have a significant impact on the outcome values. By contrast, variables with low importance might be omitted from a model, making it simpler and faster to fit and use for predictions. After removing the variables identified from the exploratory analysis, only 37 potential variables were left. Variables for the final model were selected using a stepwise variable selection method, where the variables with the lowest mean decrease in Gini coefficient were removed from the model and then the out-of-bag error was calculated; if the accuracy estimates did not change more than 1%, the variable was removed. This process was repeated until removing the variable increased the error considerably.
Accuracy assessment of the classification
The performance of the random forest classification model was evaluated using a Confusion matrix in which actual observed values are compared with those predicted by the random forest model in a two-way table. This gives us a quantitative measure of how well our classification model is performing and what kinds of errors are made.
Cohen’s kappa coefficient (κ) is a statistic that measures the agreement between the observed and chance agreement (Cohen Citation1960). It reflects the difference between actual agreement and the agreement expected by chance. Kappa of 0.80 means there is 80% better agreement than by chance alone.
Cohen’s kappa is: κ = (Observed – chance agreement)/(1 – chance agreement)
User accuracy corresponds to error of commission (inclusion) and quantifies how good the map is from the user’s perspective. It is calculated as the number of pixels correctly identified in a given map class divided by the number of pixels claimed to be in that map class. Producer accuracy quantifies how good the map is from the producer’s perspective. It is calculated as the number of correctly identified pixels in reference data of a given class divided by the number of pixels in that reference class. This statistic quantifies how many pixels on the map are labelled correctly.
Map creation
The predictor layers were used as an input to the model to produce a map of tree mortality risk for the two plantation regions at 100 m resolution. The soil and topographic data were the same for all scenarios, but the climate data were (1) 1951–2015, which were the baseline data or current scenario, and (2) 2050 and 2070 climate data, which are the future projections for the climate data. For both the Tumut and Bathurst management areas, the maps were created for 1951–2015 (i.e. current risk), 2050 and 2070 (i.e. future risk).
All the analysis was done using the R statistical package (R Development Core Team Citation2022), and the R package Random Forest (Liaw and Wiener Citation2002) was used for fitting the random forest model.
Results
Tree mortality
Analysis of forest health surveillance data over the past 25 years (Forestry Corporation of NSW Citation2021) shows that drought-induced tree mortality had the second greatest impact on the Pinus plantation estate in NSWFootnote6 – based on the area affected – after defoliation associated with Monterey pine aphid (Essigella californica (Essig)) and cyclaneusma needle cast (C. minus),Footnote7 followed by dothistroma needle blight (D. septosporum), possum damage and sirex wood wasp (S. noctilio). shows the area affected by drought-related tree mortality from 1997 to 2020 for the Tumut and Bathurst management areas, split into incidence categories of 1–5%, 5–15% and >15% (the area of plantation affected at incidence categories >15% was relatively small, so these incidence categories were combined for presentation). Peaks in drought-induced tree mortality occurred in 1997–1999, 2001–2004, 2007, 2009 (Tumut only), 2013–2014 and 2019. These peaks often corresponded with known drought events, including the millennium drought and the 2017–2019 drought.Footnote8
Figure 2. Percentage area under drought-induced tree mortality events in Pinus radiata plantations by year in (a) Bathurst Management Area and (b) Tumut Management Area, as mapped by forest health surveillance. The incidence classes are 1–5%, 5–15% and >15% (areas of plantation affected by the incidence categories >15% were relatively small and so were combined for presentation)
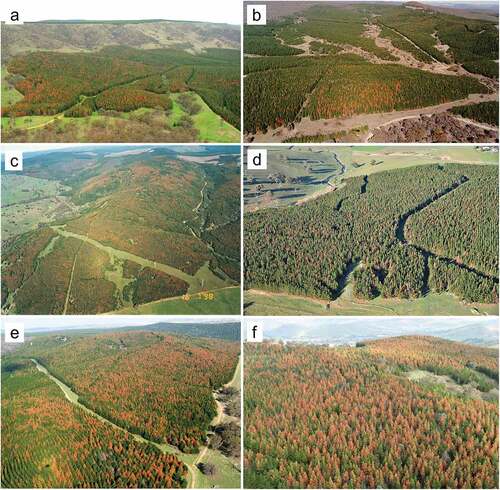
The majority (approx. 75%) of drought-induced mortality events (by area) from 1997–2020 occurred at 1–5% incidence, 15% occurred at 5–15% incidence and about 10% occurred at >15% incidence (). This is similar to drought mortality events in Europe reported by Gazol and Camarero (Citation2021), where, in most cases, fewer than 10% of trees per plot were killed. Although >15% incidence events were uncommon (), some were relatively severe and extensive, with large numbers of trees killed (e.g. ). These events could be classed as ‘catastrophic’ mortality events (Gazol and Camarero Citation2021), and the majority occurred on the margins of the plantation estate at elevations below approximately 600 m. In many instances, drought-induced tree mortality was more severe (i.e. higher incidence) on ridge-tops and hilltops compared with lower slopes and gullies, although this pattern was much less clear when drought mortality was extensive or catastrophic. Ground surveys confirmed that, most often (data not shown), multiple damage agents were associated with drought-induced tree mortality events, even within a single compartment, including a combination of I. grandicollis, D. sapinea, or drought alone (when neither of these biotic agents were present in killed trees).
Figure 3. Examples of drought-induced tree mortality in Pinus radiata plantations in New South Wales: (a) Buccleuch State Forest (SF) (image taken May 2007); (b) Pennsylvania SF (image taken September 2001); (c) Green Hills SF (image taken July 1998); (d) Canobolas SF (image taken June 2019); (e) Bungongo SF (image taken July 2007); (f) Buccleuch SF (image taken May 2009). (a, c, e, f) Tumut Management Area; (b, d) Bathurst Management Area
Model fitting
Variable selection pre-model fitting
The CSIRO soils data were collected at a depth of 0–5, 5–15, 15–30, 30–60, 60–100 and 100–200 cm.Footnote9 The soil parameter values were highly autocorrelated along the core, so we used only the 30–60 cm values for prediction. There were five topographic variables, 11 soil variables and 41 climate variables. The list of all the predictor variables is presented in . The following 21 climate variables have no non-zero values: perc_dr_mon, perc_exdr_mon, perc_dr_int, perc_hwaves, perc_heatdays, abst_ann, absr_ann, Doata_20, Doata_25, Doata_30, Doata_35, Doata_40, abs_dr_mon, abs_exdr_mon, abs_dr_int, abs_heatdays, dfire_dpy_high, dfire_dpy_vhigh, dfire_dpy_sev, dfire_dpy_extr, dfire_dpy_cat. Some of the heat-related variables had very few unique values, so they were removed from the list of predictor variables considered for model development. Where a correlation of greater than 0.8 was found between two or more variables, only one variable was selected from the group.
Fitting random forest
After removing the variables identified from the exploratory analysis, only 37 potential variables were left. Variables for the final model were selected using a stepwise variable selection method, where the variables with the lowest mean decrease in Gini coefficient were removed from the model and then the out-of-bag error was calculated; if the accuracy estimates did not change more than 1%, the variable was removed. This process was repeated until removing the variable increased the error considerably. Of the 37 potential variables, only six variables were selected for the final model: site index, elevation (DEM), annual rainfall, annual temperature, days above 20°C, and days about 35°C (). is the plot of the predictor variables and the mean decrease in Gini; the higher the decrease in accuracy, the better the predictor.
Figure 4. Predictor variable importance plot. The greater the mean decrease in Gini score the more important the predictor is in classifying drought risk ann_rain = mean annual rainfall (mm); ann_temp = mean annual temperature (°C); DEM = Digital Elevation Model (elevation, m); Doat_20 = days above 20°C; Doat_35 = days above 35°C; SiteIndex = average height (m) of the largest 100 largest diameter trees per hectare.
Accuracy assessment of the classification
The estimate of the out-of-bag error for the training data was 17.1%. The classification error for the four drought classes was 12.3% for no drought-induced mortality (c0); 20.6% for low drought-induced mortality (c1); 19.6% for medium drought-induced mortality (c2); and 17.8% for high drought-induced mortality (c3).
Validation data were used to check the accuracy of the model. The model-predicted estimates showed good agreement with the reference data, with an overall accuracy of 82.2% and a 95% confidence interval of 81.0–83.3%. The estimated kappa value was 0.75. Landis and Koch (Citation1977) proposed the following as standards for strength of agreement for the kappa coefficient: ≤ 0 = poor; 0.01–0.20 = slight; 0.21–0.40 = fair; 0.41–0.60 = moderate; 0.61–0.80 = substantial; and 0.81–1.0 = almost perfect. So, the agreement between the predicted values from the random forest and reference data is substantial. User accuracy and producer accuracy were both in the range of 74.5–91.8% (). The most successfully classified category was the no-drought-induced-mortality class, with a user accuracy of 91.8% and a producer accuracy of 87.3%.
Table 1. Accuracy assessment of the random forest model using test data
Relationship between predictor variables and tree mortality
The density plots for the six variables selected for the final model are presented in , showing the difference in data distribution of the variables for the different drought incidences: no drought-induced mortality (c0); low drought-induced mortality (c1); medium drought-induced mortality (c2); and high drought-induced mortality (c3). Although there are overlaps in data distribution for the various drought incidence classes, definite trends are clear: drought-induced mortality increases with decreasing site index, annual rainfall and elevation (DEM) and with increasing temperature (). Dips in the density plots (e.g. at approx. 14.5°C for mean annual temperature) are likely due to very few data at that range.
Figure 5. Density plots showing data distribution of the six variables used in the model. Drought risk classes are no drought-induced mortality (c0), low drought-induced mortality (c1), medium drought-induced mortality (c2), and high drought-induced mortality (c3). Note: y-axis has variable limits. Anomalous dips in plots within a given drought-risk category are likely due to few data at that range
The effect of each predictor variable on drought risk can be assessed using partial dependence plots, which show the marginal effect of one or two features on the predicted outcome of a machine-learning model (Friedman Citation2001). A partial dependence plot can show whether the relationship between the target and a feature is linear, monotonic or more complex. shows partial dependence plots for the top four predictor variables for drought risk. For site index, the risk of drought-induced mortality decreased with increasing site index from 20 m, with the risk of medium (c2) to high (c3) drought-induced mortality negligible above a site index of 25 m; below a site index of 20 m, the risk of high drought (c3) increased substantially. The risk of drought-induced mortality increased with elevation below approximately 900 m, with significant risk (c2 and c3) below approximately 750 m and negligible risk above 1100 m. Drought-induced mortality increased below a mean annual rainfall of approximately 1150 mm. Generally, the risk of drought-induced mortality was low (c0) below a mean annual temperature of 15°C. Dips in the partial dependence plots (e.g. at 750 m for DEM_C1) are likely due to very few data in that range.
Figure 6. Partial dependence plots of the probability of drought risk showing the effect of the predictors on drought risk classification. The top four variables are shown with plots for the four drought incidences: no drought-induced mortality (c0), low drought-induced mortality (c1), medium drought-induced mortality (c2), and high drought-induced mortality (c3). Note: y-axis has variable limits. Anomalous dips in plots within a given drought-risk category are likely due to few data at that range
Predictive maps of tree mortality
The model developed was applied to the site-index, topographic, soil and climate layers to produce a map of the risk of drought-induced tree mortality for the current (1951–2015) and future (2050 and 2070) time periods. shows the maps for the current period (1951–2015) and 2050 and 2070 (future) using climate data for the current period and climate projections for 2050 and 2070. The maps show an increase in drought risk over the years from current to 2050 and 2070. The increase in drought risk is most pronounced for the Tumut plantations. The area at risk of drought-induced tree mortality increased in the Tumut Management Area from just under 30% under the current climate to almost 50% under the 2070 climate (). Most of this increase was in the low-drought-risk category (c1), with a small percentage increase in the high-drought-risk category (c3). In contrast, overall, the drought risk in the Bathurst Management Area decreased from the current to the future climate ().
Figure 7. Drought-induced tree mortality risk maps produced using the model. (a) Tumut Management Area, (b) Bathurst Management Area. Left panel is drought-affected areas for 2015. The projected climate data were used to produce the drought risk maps for 2050 (middle) and 2070 (right). Drought risk classes are no drought-induced mortality (c0), low drought-induced mortality (c1), medium drought-induced mortality (c2), and high drought-induced mortality (c3). Scale: 1:1 000 000
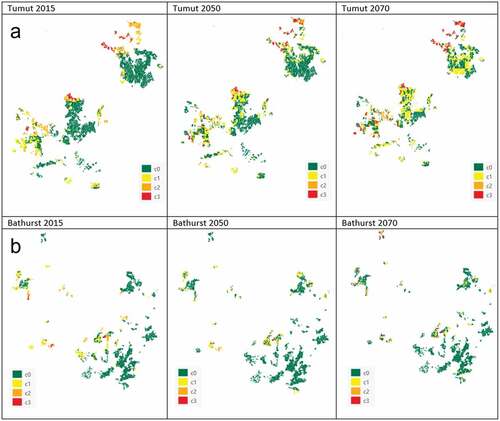
Table 2. Percentage of area in each drought risk class for the two plantation regions
Discussion
This study is the first in Australia to use empirical data from two decades of forest health surveillance to develop a drought-risk model at the landscape-scale and fine-resolution (100 m) scales for Pinus plantations. It quantifies the influence of abiotic variables related to temperature, rainfall, topography and geomorphology, as well as site index, with the current risk of tree mortality from drought at a spatial resolution that can be operationally useful. Although forest managers are already aware of drought risk in their plantation estates, based in part on the surveillance data presented here (Forestry Corporation of NSW Citation2014), this study quantifies drought risk using empirical data with a known level of accuracy and provides GIS maps that can be used in management decisions under current and future climates. This will greatly assist in the management of the current plantation estate, now and into the future, and in identifying land for plantation expansion.
Identifying the key drivers of plantation mortality
The influential factors associated with drought-induced tree mortality in our model were site index, elevation, annual rainfall, annual temperature, and annual days over maximum temperatures of 20°C and 35°C. In NSW, higher-quality sites for P. radiata are generally located at higher elevations with high rainfall and low summer temperatures (Raymond Citation2011). This highlights the interrelated effects of these variables in determining drought risk (i.e. site index cannot be looked at in the absence of elevation, rainfall and temperature, with elevation and temperature also tightly interlinked). Similarly, multiple characteristics are used to classify site variation across the P. radiata estate in Australia (Turner et al. Citation2001). In New Zealand, root-zone water storage was shown to be a major determinant of site productivity, along with mean annual rainfall (Watt, Palmer et al. Citation2010). Root-zone water storage and soil moisture availability are likely to play a critical role in the susceptibility of stands to drought (Gazol and Camarero Citation2021).
In our study, a site index below 25 m increased the risk of drought-induced tree mortality, with risk increasing substantially under a site index of 20 m and negligible risk above a site index of 25. Numerous authors have identified a link between low site quality and increased tree mortality associated with drought in Pinus plantations in Australia and elsewhere (Millikan and Anderson Citation1957; Swart et al. Citation1985; McGrath et al. Citation1991; Stanoz Citation1994). Elevation was a key factor in our study, with drought risk increasing below approximately 900 m, a substantial increase in risk below approximately 750 m, and negligible drought risk above 1100 m. The model developed by Stone et al. (Citation2012) identified elevation as a primary variable associated with drought-induced tree mortality, with increased drought risk below 600 m. These authors recommended drought-specific site management for sites below 600 m, such as planting at lower stocking, using drought-tolerant genotypes, and avoiding such sites altogether (Stone et al. Citation2012). However, Stone et al. (Citation2012) used a narrower geographic and elevational range – approximately 18 000 ha and 400–850 m, respectively, compared with our analysis of approximately 170 000 ha and 300–1200 m – and stressed that their outputs ‘cannot be extrapolated beyond the range of the data’ (Stone et al. Citation2012). Although we observed catastrophic drought events below 600 m ( are all below 600 m), our model indicated appreciable drought risk above 600 m ( are at approx. 750 m), indicating that 900 m might be a more conservative cut-off for drought-related site-specific management. Interestingly, Raymond (Citation2011) identified 900 m as the elevational gradient that separated the NSW P. radiata plantation estate into two groups where genotype × environment interactions were negligible in tree improvement considerations.
Increased temperature and lower rainfall were associated with greater tree mortality in our study. Mean annual temperature above 15°C increased drought risk, as did an increase in number of days above 20°C and 35°C. Consecutive days over 35°C are likely to be classed as heatwaves,Footnote10 and such events increased drought risk in our model. High temperatures associated with heatwaves are likely to increase atmospheric dryness and the chance of xylem cavitation (McDowell et al. Citation2008; Mitchell et al. Citation2013) and can amplify drought impacts (Pinkard et al. Citation2015). For annual rainfall, there was a sharp increase in drought-related mortality below 1150 mm. Mitchell et al. (Citation2014) found that mass die-offs in native eucalypt forests only occurred in association with severe moisture deficit and heatwaves. Increased frequency and intensity of heatwaves are more confidently attributed to climate change than reduced rainfall (CSIRO, Bureau of Meteorology Citation2015). Many international studies have reported direct and indirect effects of increased temperature and lower rainfall associated with greater levels of tree mortality (e.g. Logan et al. Citation2003; Adams et al. Citation2009; Bentz et al. Citation2009; Carnicer et al. Citation2011; Ruiz-Benito et al. Citation2013; Williams et al. Citation2013; Gazol and Camarero Citation2021).
The accuracy of our model provides comfort to forest managers in that it can reliably be used for site-specific management, now and into the future. We had an overall accuracy of 89.2% and a kappa value of 0.75, an accuracy regarded as ‘substantial’ (Landis and Koch Citation1977), indicating that our model is reliable and robust. Our accuracy levels are similar to those of Stone et al. (Citation2012) – 89.1% – and for models developed for other diseases of P. radiata. Watt, Rolando et al. (Citation2012) developed a model for C. minus of P. radiata in New Zealand with an accuracy of 72.8%. Including stand attributes (e.g. thinning status, age class) into our model is likely to improve accuracy (Stone et al. Citation2012). We acknowledge that site index cannot be projected forward under climate change, which potentially weakens our model under climate-change scenarios. However, our model also includes elevation (which remains static) and rainfall and temperature variables that are accounted for under climate change, hence supporting our confidence in the accuracy and validity of our model.
Our model is not the first developed for drought risk for forest plantations in Australia. Mitchell et al. (Citation2014) used climate-change projections to show that the frequency of droughts capable of inducing significant tree die-off across Australia could increase from 1 in 24 years to 1 in 15 years by 2050, accompanied by a doubling in the occurrence of associated heatwaves. Battaglia et al. (Citation2009), using the process-based model CABALA, predicted that productivity in southern NSW will decrease due to the direct effects of drought (i.e. tree mortality) or indirectly through increased levels of pest attack. Pinkard et al. (Citation2014) and Pinkard et al. (Citation2017) used the outputs of Battaglia et al. (Citation2009) to look at the interactive effects (i.e. changes in host susceptibility and pest species distribution and abundance) of a changing climate on key plantation pests in Australia. Climate change is likely to increase the number of generations per year, as well as reduce mortality, for E. californica and I. grandicollis, with increased defoliation from E. californica likely to cause greater productivity losses in P. radiata plantations. Milder temperatures in spring and autumn are thought to have caused a ‘population explosion’ of I. grandicollis, resulting in large-scale tree mortality of drought-stressed P. radiata in NSW in 2007 (Carnegie Citation2008).
Applying our model of drought-induced tree mortality
Stone et al. (Citation2012) developed a model for drought-induced tree mortality in P. radiata plantations in NSW using high-resolution Airborne Digital Sensor imagery (ADS40), topographical and geomorphological features and stand attributes, but not climate data. They found ‘time since last event’ (indicative of delayed thinning), age-class and elevation (<600 m) as the main factors correlated with tree mortality. However, Stone et al. (Citation2012) did not produce a predictive map for forest managers. Watt, Rolando et al. (Citation2012) emphasised the benefits of providing forest managers with access to GIS maps to identify areas of risk for objective mitigation strategies. Currently, adaptive management for drought-induced tree mortality in Pinus plantations in NSW relies on visual assessments of multiple years of forest health surveillance data (as reported here) overlaid onto topographical and stand attribute features in a GIS (D. Watt, Forestry Corporation of NSW Citation2021, pers. comm.), with different silvicultural management regimes developed for seven site categories (Forestry Corporation of NSW Citation2014). Our hope is that our empirical model and GIS outputs will be fed into such a system for the management of drought impacts at a local scale.
We were unable to separate the interactive effects of drought on plantation pests (Pinkard et al. Citation2014; Pinkard et al. Citation2017). Although we identified individual damage agents of tree mortality during ground surveys, extrapolation was necessary due to the low number of ground survey points compared with the extent of the plantation area surveyed by air. In some instances, a combination of I. grandicollis and D. sapinea was present in drought-affected stands; at other times, no biotic pests were identified, with trees assumed to have died from the direct effects of drought alone (i.e. carbohydrate starvation and/or xylem cavitation). In many cases, all three agents were identified as the cause of tree mortality in the same stand. Drought, or water stress, pre-disposes Pinus to attack and subsequent mortality from I. grandicollis and D. sapinea (Wright and Marks Citation1970; Butcher and Havel Citation1976; Morgan Citation1989; Carnegie Citation2008). Drought predictions can be impeded by not incorporating all relevant mortality drivers, such as physiological traits and biotic agent dynamics, and all need to be considered to predict drought impacts more accurately (Trugman et al. Citation2021).
To investigate the mechanism of tree mortality in P. radiata, Mitchell et al. (Citation2013) subjected 18-month-old seedlings to drought under controlled conditions. They showed that P. radiata had a conservative growth and water-use strategy to drought, reducing water use early, leading to gradual carbohydrate depletion and subsequently death at around 215 days. It is unclear how this translates to mature plantation trees in natural settings, considering the potential interactive effects of drought, heatwaves and secondary pests and pathogens. In our study, it is likely that all three recognised mechanisms of drought-induced tree mortality (i.e. carbon starvation, xylem cavitation, and increased susceptibility to pests and pathogens) co-occurred spatially and temporally. Extended drought likely resulted in carbohydrate starvation, with heatwaves compounding this effect (McDowell et al. Citation2008; Adams et al. Citation2009; Mitchell et al. Citation2013). Heatwaves are also likely to have resulted in xylem cavitation, regardless of the drought strategy employed by P. radiata (McDowell et al. Citation2008; Mitchell et al. Citation2013). And, given that I. grandicollis and D. sapinea are well-established across the range of the plantation estate, reduced host resistance (Ayres and Lombardero Citation2000; Logan et al. Citation2003; Desprez-Loustau et al. Citation2006; Dukes et al. Citation2009) likely resulted in pest attack following extended or severe drought.
A key underlying assumption when extrapolating a statistical model developed for a historical climate into a future climate is that the forest will respond similarly to the climate drivers. The uncertainty in the biological response to climate increases over time as factors such as drought and heat stress become amplified with increasing baseline temperatures. Whereas the role of elevated carbon dioxide may counteract some drought stress (Pinkard et al. Citation2014), the complexities of multiple forest stressors are not well defined under field conditions. The exact interactions between drought and pests and pathogens in the future are unclear (Pinkard et al. Citation2014; Pinkard et al. Citation2017). Thus, our projections of future mortality risk should be considered indicative of a potential scenario of drought risk rather than a precise prediction.
Managing ‘at risk’ sites into the future
Our model predicted a substantial increased risk of drought-induced mortality in P. radiata plantations in the Tumut Management Area but less so for the Bathurst Management Area. Although annual temperature in both regions will increase substantially under future climates, the climate models suggest little appreciable reduction in annual rainfall in the Bathurst Management Area but a significant reduction in the Tumut Management Area (). Furthermore, more heatwaves are predicted for the Tumut Management Area than for the Bathurst Management Area. Battaglia et al. (Citation2009) projected a significant shift to increasing temperatures and decreasing rainfall in the P. radiata plantation estate under future climates, including an increase in the number of hot dry days in the Tumut region, where ‘drought risk increases sharply’ (Battaglia et al. Citation2009). The increase in risk of drought-induced tree mortality in P. radiata plantations projected by our model adds to the growing body of research predicting increased die-off and tree mortality in forests globally (Adams et al. Citation2009; Allen et al. Citation2010; Gazol and Camarero Citation2021). The impacts of other damage agents have also been predicted to increase under climate change (Watt, Stone et al. Citation2010; Watt, Palmer Citation2012; Pinkard et al. Citation2015).
The risk of drought in P. radiata plantations in NSW at a local level is well understood, with site-specific management prescriptions developed for low-quality sites, including planting at lower stocking, deeper ripping for site preparation, and using drought-tolerant genotypes (Forestry Corporation of NSW Citation2014). Also, where stand mortality is a significant risk, thinning can be scheduled early, with scope to accept reduced value recovery where stand health is jeopardised. Numerous authors have identified early thinning as a management tool on sites at risk of drought-induced mortality (Millikan and Anderson Citation1957; Stone et al. Citation2012), including non-commercial thinning (Butcher and Havel Citation1976; Butcher Citation1977). Smith et al. (Citation2014) investigated options for lower stocking and species selection on lower-rainfall sites (<800 mm) in NSW but cautioned about potential issues with form and silvicultural constraints at lower stockings. Moreno-Chan et al. (Citation2007) suggested, however, that breeding for drought tolerance would not adversely affect wood quality. The Forestry Corporation of NSW is actively investigating a range of breeding options for drought tolerance, including within P. radiata (e.g. Guadalupe provenance) and as hybrids with P. attenuata Lemmon (M. Sutton, 2021, pers. comm.). Ivković et al. (Citation2016) developed hazard ratings for early-age mortality associated with drought using Southern Tree Breeding Association progeny trials to feed into breeding objectives for P. radiata in southern Australia.
In this study, we developed a more concise definition of the levels of mortality that can assist in more accurately identifying risk in future plantation management. When considering either end of the risk profile – c0 versus c3 – the density plots () are quite discriminatory for many of the variables attributed to risk of drought-induced mortality – for example, annual days over maximum temperature of 20°C and 35°C, with clear breaks at <145 and <1 for c0, respectively, and >160 and >5 for c3, respectively, for these two variables. Taking into consideration the accuracy of our model, low-drought-risk sites can be identified confidently, thus potentially attracting a lower discount rate (Leech Citation2014) and justifying higher costs (e.g. land costs). Conversely, high-drought-risk sites are likely to require higher management costs (e.g. thinning, genetics, site preparation) and subsequent higher discount rates, reducing the opportunity for positive returns (Leech Citation2014). Such sites may not be profitable in the long term (Ferguson Citation2016).
Australia’s plantation estate needs to expand substantially to meet future demand for timber (Commonwealth of Australia Citation2018; Woods and Houghton Citation2022), with 300 000 ha of new softwood plantations required in areas adjacent to the current estate (Australian Forest Products Australia Citation2018). Recent plantation expansion has mostly been on land in areas with 600–800 mm rainfall (Smith et al. Citation2014), and future plantation expansion will likely also target these lower-rainfall areas for reasons associated with land availability and cost (Parsons et al. Citation2007; Smith et al. Citation2014; Ivković et al. Citation2016). Our future work will expand on the current model to project it across areas adjacent to current plantation regions to assist in considerations of future plantation expansion. The projected timber-supply shortage in Australia will necessitate a massive expansion of the plantation estate; understanding the long-term risks of this expansion under a changing climate is crucial.
Although drought-induced tree mortality has been widely studied (Allen et al. Citation2010; Choat et al. Citation2012; Adams et al. Citation2017), currently available forecasting tools cannot identify which trees, stands or forests will actually be affected by future extreme heatwaves and droughts. Significantly more information is needed to develop accurate models to predict tree mortality associated with drought (Adams et al. Citation2009; Allen et al. Citation2015; Hartmann et al. Citation2018; Brodribb et al. Citation2020; Camarero Citation2021; Trugman et al. Citation2021). Using empirical data, as we have done, will increase the accuracy of drought-risk classification (Pinkard et al. Citation2014). The model we present here is a ‘static’ model; that is, it is related to site factors, including average climate variables (e.g. mean annual rainfall), rather than capturing the response of stands to stochastic events such as drought and heatwaves. We are aware that many dynamic factors could occur at a site that could change drought risk. This includes thinning status, with overstocked stands likely to be at higher risk of drought-induced tree mortality than thinned stands at a particular site (Millikan and Anderson Citation1957; Butcher and Havel Citation1976; Butcher Citation1977; McGrath et al. Citation1991; Stone et al. Citation2012). Relating water availability and temperature changes to the incidence of mortality over time, as opposed to long-term averages, could provide better accuracy in identifying individual climate events that trigger tree mortality. Furthermore, a history of tree mortality at a particular site may influence future mortality at that site. We are developing a ‘dynamic’ model to capture all these features with the aim of improving our understanding of the risk of current and future drought impacts on Pinus plantations in NSW.
Data availability
The data used in this analysis and the model itself are both commercial-in-confidence.
Acknowledgements
This study was funded by the Forestry Corporation of NSW and the NSW Department of Primary Industries. We thank Russell Cant, Cath Carney, Daryl Chaffey, Martin Horwood, Debbie Kent, Graham Price, David Sargeant and Darren Waterson for assistance with forest health surveys. Duncan Watt provided helpful discussions on development of the model and the usefulness of the outputs. Tim Wardlaw and James Lawson reviewed an earlier draft, and the manuscript was further improved by comments from anonymous reviewers.
Disclosure statement
No potential conflict of interest was reported by the author(s).
Notes
6 Excluding fire.
7 Needle chlorosis and defoliation from Monterey pine aphid and cyclaneusma needle cast are reported together as they are often both present in the same tree.
References
- Adams HD, Guardiola-Claramonte M, Barron-Gafford GA, Villegas JC, Breshears DD, Zou CB, Troch PA, Huxman TE. 2009. Temperature sensitivity of drought-induced tree mortality: implications for regional die-off under global-change-type drought. Proceedings of the National Academy of Sciences of the United States of America. 106:7063–7066. doi:10.1073/pnas.0901438106.
- Adams HD, Zeppel MJB, Anderegg WRL, Hartman H, Landhäusser SM, Tissue DT, Huxman TE, Hudson PJ, Franz TE, Allen CD, et al. 2017. A multi-species synthesis of physiological mechanisms in drought-induced tree mortality. Nature Ecology and Evolution. 1:1285–1291. doi:10.1038/s41559-017-0248-x.
- Allen CD, Breshears DD, McDowell NG. 2015. On underestimation of global vulnerability to tree mortality and forest die-off from hotter drought in the Anthropocene. Ecosphere. 6(8):1–55. doi:10.1890/ES15-00203.1.
- Allen CD, Macalady AK, Chenchouni H, Bachelet D, McDowell N, Vennetier M, Kitzberger T, Rigling A, Breshears DD, Hogg EH, et al. 2010. A global overview of drought and heat-induced tree mortality reveals emerging climate change risks for forests. Forest Ecology and Management. 259(4):660–684. doi:10.1016/j.foreco.2009.09.001.
- Anderegg WRL, Berry JA, Field CB. 2012. Linking definitions, mechanisms, and modelling of drought-induced tree death. Trends in Plant Science. 17(12):693–700. doi:10.1016/j.tplants.2012.09.006.
- Australian Forest Products Australia. 2018. Towards a national forest industries plan: key industry asks. [accessed 2022 Aug 1]. https://ausfpa.com.au/publications/towards-a-national-forest-industries-plan-key-industry-asks/
- Ayres MP, Lombardero MJ. 2000. Assessing the consequences of global change for forest disturbances for herbivores and pathogens. The Total Science of the Environment. 262:263–286. doi:10.1016/s0048-9697(00)00528-3.
- Battaglia M, Bruce J, Brack C, Baker T. 2009. Climate change and Australia’s plantation estate: analysis of vulnerability and preliminary investigation of adaptation options. Melbourne (Australia): Forest and Wood Products Australia. Report no. PNC068-0708. [accessed 2022 Aug 1]. www.fwpa.com.au
- Bentz B, Logan J, MacMahon J, Allen CD, Ayres M, Berg E, Carroll A, Hansen M, Hicke J, Joyce L, et al. 2009. Bark beetle outbreaks in western North America: causes and consequences. Bark Beetle Symposium; Snowbird, Utah; 2005 Nov. Salt Lake City (UT): University of Utah Press. [accessed 2022 Aug 1]. https://www.srs.fs.usda.gov/pubs/43479
- Berthon K, Fernandez Winzer L, Sandhu K, Cuddy W, Manea A, Carnegie AJ, Leishman L. 2018. Endangered species face an extra threat: susceptibility to the invasive pathogen Austropuccinia psidii (myrtle rust) in Australia. Australasian Plant Pathology. 48(4):385–393. doi:10.1007/s13313-019-00640-4.
- Boomsma CD. 1949. Deaths in Pinus radiata plantations in South Australia. Australian Forestry. 13(1):40–49. doi:10.1080/00049158.1949.10675764.
- Breiman L. 1994. Bagging predictors. Berkeley (CA): Department of Statistics, University of California at Berkeley. Technical Report 421.
- Breiman L. 2001. Random forests. Machine Learning. 45(1):5–32. doi:10.1023/A:1010933404324.
- Breshears DD, Cobb NS, Rich PM, Price KP, Allen CD, Balice RG, Romme WH, Kastens JH, Floyd ML, Belnap J, et al. 2005. Regional vegetation die-off in response to global-change-type drought. Proceedings of the National Academy of Sciences of the United States of America. 102(42):15144–15148. doi:10.1073/PNAS.0505734102.
- Brodribb TJ, Powers J, Cochard H, Choat B. 2020. Hanging by a thread? Forests and drought. Science. 368(6488):261–266. doi:10.1126/science.aat7631.
- Butcher TB. 1977. Impact of moisture relationships on the management of Pinus pinaster Ait. plantations in Western Australia. Forest Ecology and Management. 1:97–107. doi:10.1016/0378-1127(76)90014-1.
- Butcher TB, Havel JJ. 1976. Influence of moisture relationships on thinning practice. New Zealand Journal of Forestry Science. 6:158–170.
- Camarero JJ. 2021. The drought‒dieback‒death conundrum in trees and forests. Plant Ecology & Diversity. 14(1–2):1–12. doi:10.1080/17550874.2021.1961172.
- Carnegie AJ. 2008. Exotic bark beetle turns nasty in pine plantations. Bush Telegraph Autumn: 13.
- Carnegie AJ. 2018. Forest health and biosecurity field guide: Pinus plantations in NSW. Version 1. Sydney (Australia): Forestry Corporation of NSW.
- Carnegie AJ, Cant RG, Eldridge RH. 2008. Forest health surveillance in New South Wales, Australia. Australian Forestry. 71(3):164–176. doi:10.1080/00049158.2008.10675031.
- Carnegie AJ, Lawson S, Wardlaw T, Cameron N, Venn T. 2018. Benchmarking forest health surveillance and biosecurity activities for managing Australia’s exotic forest pest and pathogen risks. Australian Forestry. 81(1):14–23. doi:10.1080/00049158.2018.1433271.
- Carnegie AJ, Matsuki M, Hurley BP, Ahumada R, Haugen DA, Klasmer P, Sun J, Iede ET. 2006. Predicting the potential distribution of Sirex noctilio (Hymenoptera: siricidae), a significant exotic pest of Pinus plantations. Annals of Forest Science. 63(2):119–128. doi:10.1051/forest:2005104.
- Carnegie AJ, Venn T, Lawson SA, Nagel M, Wardlaw T, Cameron NL, Last I. 2018. An analysis of pest risk and potential economic impact of pine wilt disease to Pinus plantations in Australia. Australian Forestry. 81(1):24–36. doi:10.1080/00049158.2018.1440467.
- Carnicer J, Coll M, Ninyerola M, Pons X, Sánchez G, Peñuelas J. 2011. Widespread crown condition decline, food web disruption, and amplified tree mortality with increased climate change-type drought. Proceedings of the National Academy of Sciences. 108(4):1474–1478. doi:10.1073/pnas.1010070108.
- Chatterjee S, Hadi AS, Price B. 2000. Regression analysis by example. 3rd ed. New York (NY): John Wiley and Sons.
- Choat B, Jansen S, Brodribb T, Cochard H, Delzon S, Bhaskar R, Bucci SJ, Feild TS, Gleason SM, Hacke UG, et al. 2012. Global convergence in the vulnerability of forests to drought. Nature. 491(7426):752–755. doi:10.1038/nature11688.
- Chou CKS. 1987. Crown wilt of Pinus radiata associated with Diplodia pinea infection of woody stems. European Journal of Forest Pathology. 17:398–411.
- Cohen J. 1960. A coefficient of agreement for nominal scales. Educational and Psychological Measures. 20(1):37–46. doi:10.1177/001316446002000104.
- Commonwealth of Australia. 2018. Growing better trees for Australia: a billion trees for jobs and growth. [accessed 2022 Aug 1]. https://www.awe.gov.au/agriculture-land/forestry/publications/growing-better-australia#4
- CSIRO, Bureau of Meteorology. 2015. Climate Change in Australia Information for Australia’s natural resource management regions: technical report. Melbourne (Australia): Commonwealth Scientific and Industrial Research Organisation and Bureau of Meteorology.
- Desprez-Loustau M-L, Marcais B, Nageleisen L-M, Piou D, Vannini A. 2006. Interactive effects of drought and pathogens in forest trees. Annals of Forensic Science. 63:597–612. doi:10.1051/FOREST:2006040.
- Dukes JS, Pontius J, Orwig D, Garnas JR, Rodgers VL, Brazee N, Cooke B, Theoharides KA, Stange EE, Harrington R, et al. 2009. Responses to insect pests, pathogens, and invasive plant species to climate change in the forests in northeastern North America: what can we predict? Canadian Journal of Forest Research. 39(2):231–248. doi:10.1139/X08-171.
- Elliott HJ, Ohmart CP, Wylie FR. 1998. Insect pests of Australian forests: ecology & management. Melbourne (Australia): Inkata Press.
- Fensham RJ, Holman JE. 1999. Temporal and spatial patterns in drought-related tree dieback in Australian savanna. Journal of Applied Ecology. 36(6):1035–1050. doi:10.1046/J.1365-2664.1999.00460.X.
- Fensham RJ, Laffineur B, Allen CD. 2019. To what extent is drought-induced tree mortality a natural phenomenon? Global Biology and Biogeography. 28(3):365–373. doi:10.1111/geb.12858.
- Ferguson I. 2016. Future rotations problem. Australian Forestry. 79(2):122–125. doi:10.1080/00049158.2016.1151148.
- Fettig CJ, Mortenson LA, Bulaon BM, Foulk PB. 2019. Tree mortality following drought in the central and southern Sierra Nevada, California, U.S. Forest Ecology and Management. 432:164–178. doi:10.1016/j.foreco.2018.09.006.
- Forestry Corporation of NSW. 2014. Snowy region. Tumut Management Area Site Based Management Field Manual. V3.
- Forestry Corporation of NSW. 2021. Annual sustainability report 2020–21. [accessed 2022 Aug 1]. https://www.forestrycorporation.com.au/about/pubs/corporate/sustainability-reports
- Friedman JH. 2001. Greedy function approximation: a gradient boosting machine. Annals of Statistics. 29(5):1189–1232. doi:10.1214/aos/1013203451.
- Gazol A, Camarero JJ. 2021. Compound climate events increase tree drought mortality across European forests. Science of the Total Environment. 816:151604. doi:10.1016/j.scitotenv.2021.151604.
- Harper RJ, Smettem KRJ, Carter JO, McGrath JF. 2009. Drought deaths in Eucalyptus globulus (Labill.) plantations in relation to soils, geomorphology and climate. Plant and Soil. 324(1–2):199–207. doi:10.1007/s11104-009-9944-x.
- Hartmann H, Moura CF, Anderegg WRL, Ruehr NK, Salmon Y, Allen CD, Arndt SK, Breshears DD, Davi H, Galbraith D, et al. 2018. Research frontiers for improving our understanding of drought-induced tree and forest mortality. New Phytologist. 218(1):15–28. doi:10.1111/nph.15048.
- Hastie T, Tibshirani R, Friedman JH. 2009. The elements of statistical learning: data mining, inference, and prediction. 2nd ed. New York (NY): Springer.
- Hlásny T, König KP, Krokene P, Lindner M, Montagné-Huck C, Müller J, Qin H, Raffa KF, Schelhaas M-J, Svoboda M, et al. 2021. Bark beetle outbreaks in Europe: state of knowledge and ways forward for management. Current Forestry Reports. 7(3):138–165. doi:10.1007/s40725-021-00142-x.
- Hogg EH, Brandt JP, Michaellian M. 2008. Impacts of a regional drought on the productivity, dieback, and biomass of western Canadian aspen forests. Canadian Journal of Forest Research. 38(6):1373–1384. doi:10.1139/X08-001.
- IPCC. 2007. Climate change 2007: impacts, adaptation and vulnerability. In: Parry ML, Canziani OF, Palutikof JP, van der Linden PJ, Hanson CE, editors. Contribution of working group II to the fourth assessment report of the Intergovernmental Panel on Climate Change. Cambridge (UK): Cambridge University Press.
- IPCC. 2021. Climate change 2021: the physical science basis. Geneva (Switzerland): Intergovernmental Panel on Climate Change.
- Ivković M, Hamann AM, Gapare WJ, Jovanovic T, Yanchuk A. 2016. A framework for testing radiata pine under projected climate change in Australia and New Zealand. New Forests. 47(2):209–222. doi:10.1007/s11056-015-9510-8.
- Johnstone RD. 1964. Water relations of Pinus radiata under plantation conditions. Australian Journal of Botany. 12(2):111–124. doi:10.1071/BT9640111.
- Kharuk VI, Im ST, Petrov IA, Dvinskaya ML, Shushpanov AS, Golyukov AS. 2021. Climate-driven conifer mortality in Siberia. Global Ecology and Biogeography. 30(2):543–556. doi:10.1111/geb.13243.
- Kriticos DJ, Morin L, Leriche A, Anderson RC, Caley P. 2013. Combining a climatic niche model of an invasive fungus with its host species distributions to identify risks to natural assets: Puccinia psidii sensu lato in Australia. PLoS ONE. 8(5):e64479. doi:10.1371/journal.pone.0064479.
- Landis JR, Koch GG. 1977. The measurement of observer agreement for categorical data. Biometrics. 33(1):159–174. doi:10.2307/2529310.
- Leech J. 2014. Rotation length and discount rates. Australian Forestry. 77(2):114–122. doi:10.1080/00049158.2014.945110.
- Lewis NB, Fergusson IS. 1993. Management of radiata pine. Melbourne (Australia): Inkata Press.
- Liaw A, Wiener M. 2002. Classification and regression by Random Forest. R News. 2:18–22.
- Li M-Y, Fang L-D, Duan C-Y, Cao Y, Yin H, Ning QR, Hao GY. 2020. Greater risk of hydraulic failure due to increased drought threatens pine plantations in Horqin Sandy Land of northern China. Forest Ecology and Management. 461:117980. doi:10.1016/j.foreco.2020.117980.
- Logan J, Regniere J, Powell JA. 2003. Assessing the impacts of global warming on forest pest dynamics. Frontiers in Ecology and the Environment. 1(3):130–137. doi:10.1890/1540-9295(2003)001[0130:ATIOGW]2.0.CO;2.
- Marks GC, Minko G. 1969. The pathogenicity of Diplodia pinea to Pinus radiata D. Don. Australian Journal of Botany. 17(1):1–12. doi:10.1071/BT9690001.
- Matusick G, Ruthrof KX, Brouwers NC, Dell B, Hardy GESJ. 2013. Sudden forest canopy collapse corresponding with extreme drought and heat in a Mediterranean-type eucalypt forest in southwestern Australia. European Journal of Forest Research. 132(3):497–510. doi:10.1007/s10342-013-0690-5.
- Matusick G, Ruthrof KX, Hardy GESJ. 2012. Drought and heat triggers sudden and severe dieback in a dominant Mediterranean-type woodland species. Open Journal of Forestry. 2(4):183–186. doi:10.4236/ojf.2012.24022.
- McDowell N, Pockman WT, Allen CD, Breshears DD, Cobb N, Kolb T, Sperry J, West A, Williams D, Yepez EA. 2008. Mechanisms of plant survival and mortality during drought: why do some plants survive while others succumb to drought? Tansley review. New Phytologist. 178(4):719–739. doi:10.1111/j.1469-8137.2008.02436.x.
- McDowell NG, Sevanto S. 2010. The mechanisms of carbon starvation: how, when, or does it even occur at all? New Phytologist. 186(2):264–266. doi:10.1111/j.1469-8137.2010.03232.x.
- McGrath JF, Ward D, Jenkins PJ, Read B. 1991. Influence of site factors on the productivity and drought susceptibility of Pinus radiata in the blackwood valley region of Western Australia. In: Ryan PJ, editor. Productivity in perspective. Third Australian forest soils and nutrition conference; Melbourne, Australia. Sydney (Australia): Forestry Commission of New South Wales. p. 65–66.
- McKee TBN, Doesken J, Kleist J. 1993. The relationship of drought frequency and duration to time scales. In: Proceedings of Eighth Conference on Applied Climatology. Anaheim (CA): American Meteorological Society. p. 179–184.
- Millikan CR, Anderson RD. 1957. Dead-top of Pinus spp. in Victorian plantations. Australian Forestry. 21(1):4–14. doi:10.1080/00049158.1957.10675332.
- Mitchell TD. 2003. Pattern scaling: an examination of the accuracy of the technique for describing future climates. Climate Change. 60(3):217–242. doi:10.1023/A:1026035305597.
- Mitchell PJ, O’Grady AP, Hayes KR, Pinkard EA. 2014. Exposure of trees to drought-die-off is defined by a common climatic threshold across different vegetation types. Ecology and Evolution. 4(7):1088–1101. doi:10.1002/ece3.1008.
- Mitchell PJ, O’Grady AP, Tissue DT, White DA, Ottenschlaeger ML, Pinkard EA. 2013. Drought response strategies define the relative contributions of hydraulic dysfunction and carbohydrate depletion during tree mortality. New Phytologist. 197(3):862–872. doi:10.1111/nph.12064.
- Moreno-Chan J, Raymond C, Dickson R, Watt D. 2007. Wood quality, drought response and potential breeding of radiata pine in marginal rainfall areas in NSW. In: Proceedings of the 2007 Conference of Australian and New Zealand, Institute of Foresters, Coffs Harbour, Australia.
- Morgan FD. 1989. Forty years of Sirex noctilio and Ips grandicollis in Australia. New Zealand Journal of Forestry Science. 19:198–209.
- Noble IR, Gill AM, Bary GAV. 1980. McArthur’s fire-danger meters expressed as equations. Australian Journal of Ecology. 5:201–203. doi:10.1111/j.1442-9993.1980.tb01243.x.
- Nolan RN, Gauthey A, Losso A, Medlyn BE, Smith R, Chhajed SS, Fuller K, Song M, Li X, Beaumont LJ, et al. 2021. Hydraulic failure and tree size linked with canopy die-back in eucalypt forest during extreme drought. New Phytologist. 230(4):1354–1365. doi:10.1111/nph.17298.
- Parsons M, Frakes I, Gerrand A. 2007. Plantations and water use. Canberra (Australia): Bureau of Rural Sciences.
- Peñuelas J, Lloret F, Montoya R. 2001. Severe drought effects on Mediterranean woody flora in Spain. Forest Science. 47:214–218. https://academic.oup.com/forestscience/article/47/2/214/4617406
- Perkins SE, Alexander LV. 2012. On the measurement of heatwaves. Journal of Climate. 26(13):4500–4517. doi:10.1175/jcli-d-12-00383.1.
- Phillips O, Aragão LEOC, Lewis SL, Fisher JB, Lloyd J, López-González G, Malhi Y, Monteagudo A, Peacock J, Quesada CA, et al. 2009. Drought sensitivity of the Amazon rainforest. Science. 323(5919):1344–1347. doi:10.1126/science.1164033.
- Pinkard EA, Battaglia M, Bruce J, Mathews S, Callister AN, Hetherington S, Last I, Mathieson S, Mitchell C, Mohammed C, Musk R, et al. 2015. A history of forestry management responses to climatic variability and their current relevance for developing climate change adaptation strategies. Forestry. 88(2):155–171. doi:10.1093/forestry/cpu040.
- Pinkard EA, Bruce J, Battaglia M, Matthews S, Drew D, Downes G, Crawford D, Ottenschlaeger M. 2014. Adaptation strategies to manage risk in Australia’s plantations. Melbourne (Australia): Forest and Wood Products Australia. Report no. PNC228-1011.
- Pinkard EA, Kriticos DJ, Wardlaw TJ, Carnegie AJ. 2010. Estimating the spatio-temporal risk of disease epidemics using a bioclimatic niche model. Ecological Modelling. 221(23):2828–2838. doi:10.1016/J.ECOLMODEL.2010.08.017.
- Pinkard E, Wardlaw T, Kriticos D, Ireland K, Bruce J. 2017. Climate change and pest risk in temperate eucalypt and radiata pine plantations: a review. Australian Forestry. 80(4):228–241. doi:10.1080/00049158.2017.1359753.
- Quinn PF, Beven KJ, Lamb R. 1995. The In (a/tan/beta) index: how to calculate it and how to use it within the Topmodel framework. Hydrological Processes. 9(2):161–182. doi:10.1002/hyp.3360090204.
- Raffa KF, Aukema BH, Bentz BJ, Carroll AL, Hicke JA, Turner MG, Romme WH. 2008. Cross-scale drivers of natural disturbances prone to anthropogenic amplification: the dynamics of bark beetle eruptions. Bioscience. 58(6):501–517. doi:10.1641/B580607.
- Ratkowsky DA, Myers BJ, Bird T. 1981. Analysis of pattern of crown damage in forests. Forest Ecology and Management. 3:245–253. doi:10.1016/0378-1127(80)90019-5.
- Raymond CA. 2011. Genotype by environment interactions for Pinus radiata in New South Wales, Australia. Tree Genetics & Genomes. 7(4):819–833. doi:10.1007/s11295-011-0376-4.
- R Development Core Team. 2022. R: a language and environment for statistical computing. Vienna (Austria): R Foundation for Statistical Computing. http://www.R-project.org/
- Ricketts J, Kokic P, Carter J. 2013. Consistent climate scenarios: projecting representative future daily climate from global climate models based on historical data. In: Piantodosi J, Anderson RS, Boland J, editors. 20th International Congress on Modelling and Simulation (MODSIM); 2013 Dec 1–6; Adelaide, Australia. Canberra (Australia): Modelling and Simulation Society of Australia and New Zealand; p. 2785–2791.
- Ripley BD. 1996. Pattern recognition and neural networks. Cambridge (UK): Cambridge University Press.
- Ruiz-Benito P, Lines ER, Gómez-Aparicio L, Zavala MA, Coomes DA. 2013. Patterns and drivers of tree mortality in Iberian forests: climatic effects are modified by competition. PLoS ONE. 8(2):e56843. doi:10.1371/journal.pone.0056843.
- Sala A, Piper F, Hoch G. 2010. Physiological mechanisms of drought-induced tree mortality are far from being resolved. New Phytologist. 186(2):274–281. doi:10.1111/j.1469-8137.2009.03167.x.
- Senf C, Buras A, Zang CS, Ramming A, Seidl R. 2020. Excess forest mortality is consistently linked to drought across Europe. Nature Communications. 11(1):6200. doi:10.1038/s41467-020-19924-1.
- Smith RGB, Rowell D, Porada H, Bush D. 2014. Pinus pinaster and Pinus radiata survival, growth and form on 500–800 mm rainfall sites in southern NSW. Australian Forestry. 77(2):105–113. doi:10.1080/00049158.2014.935269.
- Stanoz GR. 1994. Factors influencing sphaeropsis shoot blight and canker epidemics in central Wisconsin, USA. In: Capretti P, Heiniger U, Stephan R, editors. Shoot and foliage diseases in forest trees. Proceedings of Joint Meeting of IUFRO Working Parties S2.06.02 and S2.06.04; Valombrosa, Italy; 1994 Jun. Firenze (Italy): Instituto di Patologia e Zoologia Forestale e Agaria, Università degli Studi di Firenze. p. 254–262.
- Stiki A. 1994. Crown wilt of Pinus associated to Sphaeropsis sapinea infection of woody stems. In: Capretti P, Heiniger U, Stephan R, editors. Shoot and foliage diseases in forest trees. Proceedings of Joint Meeting of IUFRO Working Parties S2.06.02 and S2.06.04; Valombrosa, Italy; 1994 Jun. Firenze (Italy): Instituto di Patologia e Zoologia Forestale e Agaria, Università degli Studi di Firenze. p. 271–272.
- Stone C, Penman T, Turner R. 2012. Managing drought-induced mortality in Pinus radiata plantations under climate change conditions: a local approach using digital camera data. Forest Ecology and Management. 265:94–101. doi:10.1016/j.foreco.2011.10.008.
- Swart WJ, Knox-Davies PS, Wingfield MJ. 1985. Sphaeropsis sapinea, with special reference to its occurrence on Pinus spp. in South Africa. South African Forestry Journal. 35(1):1–8. doi:10.1080/00382167.1985.9629601.
- Trugman AT, Anderegg LDL, Anderegg WRL, Das AJ, Stephenson NL. 2021. Why is tree drought mortality so hard to predict? Trends in Ecology & Evolution. 36(6):520–532. doi:10.1016/j.tree.2021.02.001.
- Turner J, Lamber MJ, Hopmans P, McGrath J. 2001. Site variation in Pinus radiata plantations and implications for site-specific management. New Forests. 21(3):249–282. doi:10.1023/A:1012240720833.
- Van Mantgem PJ, Stephenson NL, Byrne JC, Daniels LD, Franklin JF, Fule PZ, Harmon ME, Larson AL, Smith JM, Taylor AH, et al. 2009. Widespread increase of tree mortality rates in the western United States. Science. 323(5913):521–524. doi:10.1126/science.1165000.
- Vicente-Serrano SM, Beguería S, López-Moreno JI. 2010. A multiscalar drought index sensitive to global warming: the standardized precipitation evapotranspiration index. Journal of Climate. 23(7):1696–1718. doi:10.1175/2009JCLI2909.1.
- Wardlaw T. 2008. A review of the outcomes of a decade of forest health surveillance of state forests in Tasmania. Australian Forestry. 71(3):254–260. doi:10.1080/00049158.2008.10675044.
- Watt MS, Ganley RJ, Kriticos DJ, Manning LK. 2011. Dothistroma needle blight and pitch canker: the current and future potential distribution of two important diseases of Pinus species. Canadian Journal of Forest Research. 41(2):412–424. doi:10.1139/X10-204.
- Watt MS, Palmer DJ, Bulman LS, Harrison D. 2012. Predicting the severity of Cyclaneusma needle cast on Pinus radiata under future climate in New Zealand. New Zealand Journal of Forestry Science. 42:65–71. doi:10.1139/X2012-021.
- Watt MS, Palmer DJ, Kimberley MO, Höck BK, Payn TW, Lowe DJ. 2010. Development of models to predict Pinus radiata productivity throughout New Zealand. Canadian Journal of Forest Research. 40(3):488–499. doi:10.1139/X09-207.
- Watt MS, Rolando CA, Palmer DJ, Bulman LS. 2012. Predicting the severity of Cyclaneusma minus on Pinus radiata under current climate in New Zealand. Canadian Journal of Forest Research. 42(4):667–674. doi:10.1139/x2012-021.
- Watt MS, Stone JK, Hood IA, Palmer DJ. 2010. Predicting the severity of Swiss needle cast on Douglas-fir under current and future climate in New Zealand. Forest Ecology and Management. 260(12):2232–2240. doi:10.1016/j.foreco.2010.09.034.
- Wharton TN, Kriticos DJ. 2004. The fundamental and realized niche of the Monterey Pine aphid, Essigella californica (Essig) (Hemiptera: aphididae): implications for managing softwood plantations in Australia. Diversity & Distributions. 10(4):253–262. doi:10.1111/j.1366-9516.2004.00090.x.
- Whetton P, Hennessy K, Clarke J, McInnes K, Kent D. 2012. Use of representative climate futures in impact and adaptation assessment. Climate Change. 115(3–4):433–442. doi:10.1007/s10584-012-0471-z.
- White DA, Crombie DS, Kinal J, Battaglia M, McGrath JF, Mendham DS, Walker SN. 2009. Managing productivity and drought risk in Eucalyptus globulus plantations in south-western Australia. Forest Ecology and Management. 259(1):33–44. doi:10.1016/j.foreco.2009.09.039.
- Williams AP, Allen CD, Macalady AK, Griffin D, Woodhouse CA, Meko DM, Swetman TW, Rauscher SA, Seager R, Grissino-Mayer HD, et al. 2013. Temperature as a potent driver of regional forest drought stress and tree mortality. Nature Climate Change. 3(3):292–297. https://www.nature.com/articles/nclimate1693
- Wilson MFJ, O’Connell B, Brown C, Guinan JC, Grehan AJ. 2007. Multiscale terrain analysis of multibeam bathymetry data for habitat mapping on the continental slope. Marine Geodesy. 30(1–2):3–35. doi:10.1080/01490410701295962.
- Woods T, Houghton J. 2022. Future market dynamics and potential impacts on Australian timber imports. Final Report. Melbourne (Australia): Forest & Wood Products Australia.
- Woollons RC. 2003. Examination of mean top height definitions and height estimation equations for Pinus radiata in New Zealand. New Zealand Journal of Forestry. 48:15–18.
- Wright JP, Marks GC. 1970. Loss of merchantable wood in radiata pine associated with infection by Diplodia pinea. Australian Forestry. 34(2):107–119. doi:10.1080/00049158.1970.10675516.
Appendix
Appendix Figure 1. Climate variable* ranges under current and future climates.
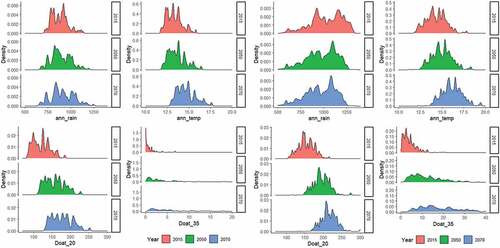
Appendix Table 1. Mean and range for key structural and environmental variables for the two study areas.
Appendix Table 2. Variables used in the study.