
ABSTRACT
Objective: The 3+1Cs model and Coach-Athlete Relationship Questionnaire (CART-Q), measures the interpersonal constructs of Closeness, Commitment, Complementarity and Coorientation to appraise the nature of the relationship, yet the psychometric properties of the instrument still remain unclear. The purpose of this study was to resolve uncertainty about a suitable factor solution through applying previously used analytical methods as well as psychometric methods that are appropriate for this type of response scale, namely asymptotic distribution-free confirmatory factor analysis (CFA) and Rasch analysis.
Method: The 11-item direct and meta-perspective versions of the CART-Q were examined utilising AMOS, LISREL and Rach analysis using a sample of 251 national football and futsal coaches and athletes. A model comparison strategy with AMOS provided a direct comparison with previous studies. LISREL and Rasch analysis was conducted to provide additional information about the CART-Q psychometric properties.
Results: CFA with maximum likelihood and diagonally-weighted least squares estimation methods supported the factorial validity of the three-factor first-order model of both CART-Q versions, although a unidimensional solution was also tenable. Rasch analysis determined that the unidimensional model possessed higher reliability and provided improved coverage of participants’ scores, minimising ceiling effects.
Conclusion: Research designs that require assessment of coach-athlete relationships may prefer the unidimensional model due to its superior psychometric properties. When more detailed profile scores are required, the subscale scores can still be interpreted with adequate validity and reliability
KEY POINTS
What is already known about the topic:
The coach-athlete relationship is essential to enhancing performance and psychosocial well-being.
The 3+1Cs model and Coach-Athlete Relationship Questionnaire (CART-Q), represents the most popular approach to understanding coach-athlete relationships.
Previous studies investigating the CAR factorial validity have identified the 3+1Cs model as a multidimensional structure with universal applicability across cultures.
What this study adds:
This is the first study to perform CTT and IRT, to minimise the likelihood of psychometric findings materialising as an artefact of using a particular analytic tool.
Contrary to previous research, the results of this study suggest that a unidimensional structure obtained greater robustness in increased reliability, item coverage and reduced ceiling effects than the multidimensionality of the model.
These results suggest that a unidimensional factor solution is a more appropriate representation of the model than previously reported and provides researchers with confidence in the psychometric properties of the questionnaires.
Introduction
Sport is a contextually rich environment to study relationship interdependence, as many dyadic relationships are formed (Jowett & Ntoumanis, Citation2004). The coach-athlete relationship (CAR) is deemed pivotal in the success of the coaching process where both parties form close relationships with a high degree of interdependence (Jowett, Citation2009b; Jowett & Shanmugam, Citation2016). Exploratory research examining social interconnections between coaches and athletes have traditionally involved sports leadership models heavily focused on single-participant paradigms and the behaviour and personality traits of coaches. The past 20 years have seen rapid advances in CAR research, using a dyadic lens to gain a better understanding of the mutual interrelations of both individuals.
Interpersonal relationship research (Kelley et al. (Citation1983) provided a framework for Jowett (Jowett & Cockerill, Citation2003; Jowett & Meek, Citation2000) to conceptualise the quality of the CAR as a situation in which coaches’ and athletes’ interpersonal emotions, cognitions and behaviours are mutually and causally interconnected. The CAR is entrenched in a series of changeable and multifaceted interactions where both members rely on each other during stressful situations and are connected members of a dyadic relationship. Jowett and Ntoumanis (Citation2004) acknowledged that a tool was required to reflect the CAR psychometric properties. The CART-Q development and validation process included a systemised set of procedures to involve item generation and analysis with a panel of experts followed by a series of Exploratory Factor Analysis (EFA) and Confirmatory Factor Analysis (CFA) on first-order and higher-order structured models (Jowett, Citation2007). EFA was used to postulate the structure of the model, then supported using CFA. CFA verified the three constructs of Closeness, Commitment and Complementarity of coaches’ and athletes’ emotions, cognitions and behaviours were observable and could be represented as a three-factor first-order model to represent the CAR multidimensional nature. Subsequent qualitative studies (Jowett & Frost, Citation2007; Trzaskoma-Bicsérdy et al., Citation2007) confirmed that this 3Cs model was appropriate. The model highlighted the extent to which the coaches and athletes perceptions are interconnected (Rhind & Jowett, Citation2010), emphasising the need to capture the dyadic nature of the two-person relationship (Jowett, Citation2006; Poczwardowski et al., Citation2006).
3Cs model constructs are defined as:
Closeness: the feeling of being emotionally close with one another, reflected in the feelings of being liked, cared and valued, and mutual trust had a positive effect on the coaches’ and athletes’ intrapersonal and interpersonal factors.
Commitment: a cognitive attachment and long-term orientation towards each-other.
Complementarity: roles, tasks, and support, reflecting the co-operative interactions of coaches’ and athletes’ responsiveness and affiliation.
Co-orientation is the fourth construct to advance the model to 3 + 1Cs (Jowett, Citation2007). It accentuated the extent to which coaches’ and athletes’ perceptions were interconnected, emphasising the importance of capturing the reciprocal nature of the dyadic relationship. Co-orientation suggested that coaches and athletes could perceive their relationship from two perspectives; the direct-perspective (e.g., I trust my coach/athlete), and the meta-perspective (e.g., My coach/athlete trusts me). Co-orientation assesses three dimensions of the CAR:
Actual similarity of coaches’ and athletes’ direct perspectives (i.e. the comparison of the coaches’ and athletes’ direct perspectives)
Assumed similarity (i.e. comparison of athletes’ direct perspectives with their meta-perspective and comparing coaches’ direct perspectives with their meta-perspective)
Empathetic understanding (i.e. the comparison of athletes’ direct perspective with the coaches’ meta-perspective or coaches’ direct perspective with the athletes’ meta-perspective) (Jowett, Citation2009a, Citation2006).
Co-orientation allowed for analysis to determine the level of agreement and disagreement between the dyadic partners, i.e. understanding the dyadic nature of the CAR (Woolliams, Citation2015). CAR is measured using the CART-Q (Jowett, Citation2009b; Jowett & Ntoumanis, Citation2004) involving both direct perspective and meta-perspective versions and has been cross-culturally validated (Balduck & Jowett, Citation2010; Yang & Jowett, Citation2012, Citation2013).
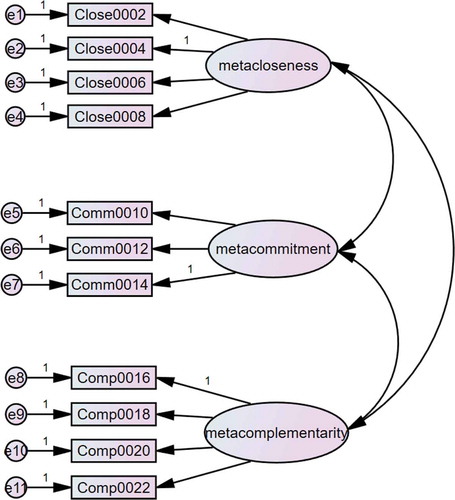
CART-Q psychometric qualities were previously assessed using Classical Test Theory (CTT) and CFA. Previous validation studies (Jowett & Ntoumanis, Citation2004), utilising structural equation modelling (SEM), determined that the three-factor first-order model is an appropriate tool to examine the quality of CAR. Findings supported the multidimensional nature of the relationship, underpinned by the dyadic member’s interpersonal emotions, cognitions and behaviour being mutually and causally bound. represents the 3Cs model of the direct perspective, and represents the 3Cs model for the meta-perspective employing CFA practices. This study proposes that while CTT has advanced SEM, more sensitive approaches, such as Rasch analysis need to be considered as suitable for ordinal Likert-scale data and provide detailed information about item performance.
Figure 1. 3Cs direct -perspective three-factor first-order factor model
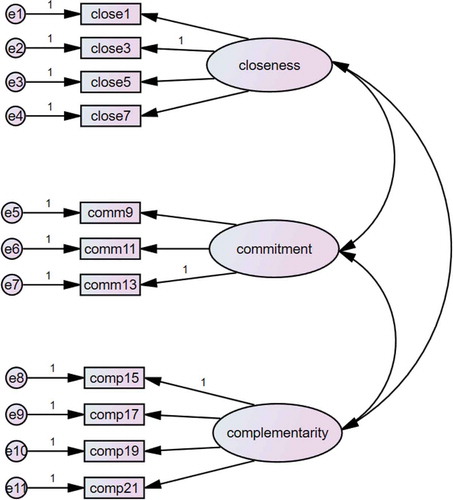
Figure 2. 3Cs meta-perspective three-factor first-order factor model
Rasch analysis is a probabilistic model and is effective in determining the psychometric robustness of questionnaires (Lundgren & Tennant, Citation2011). Rasch (Citation1960) demonstrated that the probability of an endorsement made by a person directed at a given item is a logistic function of the difference between the item parameter and the person parameter. A significant advantage of Rasch analysis over CTT is that it distinguishes between the items’ level of difficulty (the item parameter) on the latent construct and the person’s ability or propensity to endorse the item (the person parameter). The item parameters and person parameters are measured on the same scale (logits) and linearly represented demonstrating the standard error variance specific to item and person ability and difficulty (Schumacker & Smith, Citation2007). The Rasch model was initially developed to address dichotomous data and has been advanced through the development of the Partial Credit Model (Masters, Citation1982) and the Rating Scale Model (Andrich, Citation1978) to consider polytomous scored items. A fundamental consideration of both models is that they assume there will be variability evident in the distance between thresholds, yet the Rating Scale expects the variance to be equal across all items (Alagumalai et al., Citation2005). This advancement is pivotal, as polytomous Rasch analysis attends to Likert-style questionnaires allowing the model to determine whether the data in sequential categories reflects the increased property of the construct (Andrich, Citation1998). As the CART-Q adopts a Likert-scale ranging from 1 to 7, a person may have specific difficulty levels endorsing a particular response due to the hierarchical nature of the rating system (Kersten & Kayes, Citation2011).
This study utilised a systematic analysis path to complete a thorough and iterative psychometric examination of the 3 + 1Cs model and associated CART-Q to reduce the likelihood that results are an artefact of using a particular computational analysis tool. Unlike previous research on this topic, Rasch analysis was utilised post-traditional CFA methods to determine the validity and reliability of the direct perspective and meta-perspective versions of the CART-Q. The aim was to resolve uncertainty about a suitable factor solution through applying previously used analytical methods, psychometric methods that are appropriate for this type of response scale, i.e. asymptotic distribution-free CFA and Rasch analysis.
Method
Participants
A sample of 251 national New Zealand football and futsal players and national coaches (U20 men’s, U20 women’s, senior men’s and senior women’s) participated in this study (51.4% male and 48.6% female). All data were de-identified.
Instrumentation
The CART-Q direct and meta-perspective versions were used. Each 11-item questionnaire (Jowett, Citation2009b; Jowett & Ntoumanis, Citation2004) assessed the CAR for the constructs of direct-Closeness (4 items), direct-Commitment (3 items) and direct-Complementarity (4 items), and meta-Closeness (4 items), meta-Commitment (3 items) and meta-Complementarity (4 items). Items were measured on a 7-point Likert-scale ranging from 1 (“Strongly Disagree”) to 7 (“Strongly Agree”).
Procedure
The primary researcher met the participants to discuss the aims and logistics of the study, its voluntary nature, confidentiality and anonymity with individual athletes and coaches at training sessions. The information sheet and CART-Q were left with the consenting participants. The athletes and coaches were asked to place the questionnaires in an unmarked envelope and return to a collection box at a pre-determined venue convenient to the participants. The research study obtained approval from the authors’ institutional ethical committee.
Data analysis
Descriptive analyses were conducted using SPSS 25.0. Consistent with previous research (Balduck & Jowett, Citation2010; Balduck et al., Citation2011), the software package AMOS was utilised in this study for the CFA. A model comparison strategy, as suggested by MacCallum (Citation1995), was adopted to test the CFA of the direct and meta-perspective 11-item CART-Qs. A widely accepted strategy to evaluate factorial validity of the CART-Q is to test comparative models to contribute further evidence to support a hypothesised model (Balduck & Jowett, Citation2010; Jowett, Citation2009a; Jowett & Ntoumanis, Citation2004; Yang & Jowett, Citation2010, Citation2013).
Three competing models (M1, M2 and M3) were compared to identify a structure that appropriately captured the CAR constructs for the direct perspective CART-Q, and three competing models (M4, M5 and M6) were compared for the meta-perspective:
M1 represented the original direct perspective three-factor first-order model as postulated by Jowett and Ntoumanis (Citation2004).
M2 comprised of the direct perspective three-factor first-order model with minor modifications introduced to address the misspecification issues of ill-fit of two latent traits.
M3 represented a single-factor solution in which the 3Cs were considered as a stand-alone unidimensional construct.
M4 comprised of the original meta-perspective three-factor first-order model, as postulated by Jowett (Citation2007), representing the constructs of meta-Closeness, meta-Commitment and meta-Complementarity.
M5 utilised a three-factor first-order model with minimal modifications to attend to variances outlined from modification indices.
M6 represented a single-factor solution in which the 3Cs were grouped as a unidimensional construct with meta-Closeness, meta-Commitment and meta-Complementarity considered as a stand-alone construct.
The sample size to free parameters ratios ranged from 8.7:1 to 11.4:1, with an average of 10:1 meeting the recommended 10:1 ratio (Bentler, Citation1995).
A series of goodness-of-fit indices were considered to evaluate the adequacy of model fit: scaled chi-square (χ2) statistic, Standardised Root Mean Square Residual (SRMR), Comparative Fit Index (CFI), Root-Mean-Square Error of Approximation (RMSEA), Tucker-Lewis Index (TLI), Akaike Information Criterion (AIC), and Expected Cross-Validation Index (ECVI). Chi-square difference tests were carried out to compare competing models. CFI and TLI values of 0.90 are somewhat acceptable, with 0.95 to 1.00 values indicating close to exact fit. SRMR value of ˂0.05 is acceptable, yet Hu and Bentler (Citation1999) suggested a revised criterion of ˂0.08, and RMSEA values from 0.08 are considered as an acceptable cut-off value with 0.06 or higher indicating close to exact fit. As there are no identified satisfactory values for the AIC or the ECVI estimates, the lowest values, the most parsimonious, were considered to indicate a better fit when comparing the competing models. This strategy aligns with previous research protocols in testing the validity of CART-Qs (Ahmad, Citation2014; Balduck & Jowett, Citation2010). Upon determining the model fit to the data, convergent and discriminant validity of the direct and meta-perspective CART-Qs were then examined.
To enable direct comparison of the present results with those of previous studies (Balduck & Jowett, Citation2010; Balduck et al., Citation2011; Jowett & Ntoumanis, Citation2004; Yang & Jowett, Citation2010), CFA was conducted using maximum likelihood estimation with the software package AMOS v.22. Since the data are ordinal, due to the questionnaire adopting a Likert scale, CFA was also conducted using an asymptotic distribution-free method, which is deemed to be the appropriate approach for this type of data (Flora & Curran, Citation2004). Using the software package LISREL v.8.80 (Jöreskog & Sörbom, Citation1993), polychoric correlations were used with diagonally weighted least squares method of estimation.
Rasch analysis was conducted using the software package RUMM2030 (Andrich et al., Citation2009). Likelihood-ratio tests supported (χ2(29) = 50.64, p < 0.01, and χ2(29) = 66.26, p < 0.01, for the direct and meta versions, respectively) the appropriateness of adopting the Partial-Credit Model. An iterative process was facilitated following the guidance of the sequential steps recommended by Siegert et al. (Citation2010) until Rasch analysis expectations were met. Individual item fit residuals should be nonsignificant and within a range of −2.50 to +2.50. Local dependency of items was examined by inspected residual correlation matrices.
Rasch analysis distinguishes between local trait dependency due to the presence of multidimensionality and local response dependency, which can occur when a response to an item is influenced by a response to another item, such as a method effect (Lundgren & Tennant, Citation2011). The type of dependency can be investigated by locally dependent items into subtests. If the resulting solution is unidimensional, subtests can be said to have successfully resolved local response dependency (Medvedev et al., Citation2018) and there is no evidence of local trait dependency.
Results
Descriptive statistics and reliability analysis
illustrates the means, standard deviation, skewness and kurtosis scores of the CART-Q 11-item direct and 11-item meta-perspective versions. Negative univariate skewness scores were observed for all items except item 6 for both the direct perspective (item 6- “I am close to my athlete/coach”) and meta-perspective versions (item 6- “My coach/athlete is close to me”) indicating mostly positive relationship perceptions and meta-perceptions. The measures of Mardia’s multivariate kurtosis coefficients were high (67.40 and 51.59) for M2 and M5 respectively, thus rejecting the hypothesis of multivariate normality. Therefore, the robust maximum likelihood estimation method was utilised as this method offers moderately accurate standard errors when data shows multivariate non-normality (Bentler, Citation1995).
Table 1. Descriptive statistics for the 11-item direct perspective and meta-perspective CART-Qs
Fit indices () demonstrate that M1, the original direct perspective version and M4, the original meta-perspective version of the CART-Qs do not meet the minimum recommended standard cut-off criteria (Bentler (Citation1995); Hu and Bentler (Citation1999). Examination of modification misspecification through modification indices (MI) was used to identify specific areas of ill-fit for potential respecification. This indicated that the covariance between item 1 (“I like my athlete/coach”) of the construct of Closeness, and item 6 (“I am close to my athlete/coach”) of Commitment and to a lesser extent, item 5 (“I am committed to my athlete/coach”) of Commitment and item 10 (“I am ready to do my best”) of Complementarity were areas for improvement. As the error covariance between the items is not unique compared to previous studies (Balduck et al., Citation2011) and considered substantive, respecification between the latent traits was necessary, resulting in M2 (direct version) and M5 (meta version). The respecified models with a correlated error between items 1 and 6 and items 5 and 10 were used in further analyses as M2 and M5 improved.
Table 2. Fit indices for the alternative three-factor higher-order and single-factor models for the direct and meta items using AMOS and LISREL (n = 251)
Using AMOS, M1 and M3 of the direct perspective did not fit the data to an acceptable level as they had high corrected χ2/df ratios, low CFI, TFI and high RMSEA values. The asymptotic distribution-free fit from LISREL produced better fit indices when compared to AMOS; however, the findings demonstrated that M1 and M3 did not fit the data as well as M2. A comparison of the three direct models demonstrated that M2 had a superior fit. Chi-square difference tests between M1 and M2, and M2 and M3 added evidence to the superior fit of M2. AIC and ECVI values showed that M2 was more parsimonious than M1 and M3. RMSEA values were elevated and above the cut-off value of 0.060 for all models.
The same process was replicated for the meta-perspective CART-Q and displayed similar results. M5 demonstrated a superior fit over M4 and M6, due to M4 and M6 having higher corrected χ2/df ratios, lower CFI, TFI and higher RMSEA values. Chi-square difference tests between M4 and M5, and M5 and M6, added evidence to M5 having greater levels of superiority. M5 values for AIC and ECVI were lower than M4 and M6 demonstrating better fit.
Convergent and discriminant validity
Convergent validity of the best-fitting models (M2 for the direct perspective and M5 for the meta-perspective) examined whether each item had substantial loading to the hypothesised factors. All factor loadings for the direct perspective were moderate to high ranging from .53 (item 6 “I am close to my athlete/coach”) to .89 (item 3 “I respect my athlete/coach”). The factor loadings for the meta-perspective version ranged from .59 (item 10 “My athlete/coach is ready to do their best”) to .86 (item 3 “My athlete/coach respects me”). Additionally, convergent validity was determined from the variance estimate squared multiple correlation coefficient (R2). All the items recorded satisfactory R2, only one item for Commitment recorded a value that was less than .50. Item 6 recorded an R2 = .28 suggesting misfit, however, was retained to attend to the completeness of the scale.
Discriminant validity refers to the magnitude to which the 3Cs exhibit uniqueness (Li & Harmer, Citation1996) and was tested utilising Pearson’s correlation coefficient. Strong associations were identified between the 3Cs of both the direct and meta-perspective versions. M2 analysis showed relationships in direct-Closeness and direct-Complementarity (r = 0.92), direct-Closeness and direct-Commitment (r = 0.92) and direct-Commitment and direct-Complementarity (r = 0.85). M5 analysis showed relationships in meta-Closeness and meta-Complementarity (r = 0.92), meta-Closeness and meta-Commitment (r = 0.93), and meta-Commitment and meta-Complementarity (r = 0.93). The results suggest that the 3Cs can be perfectly correlated and considered unidimensional, therefore questioning the appropriateness of the three-factor first-order model.
Model evaluation via rasch analysis
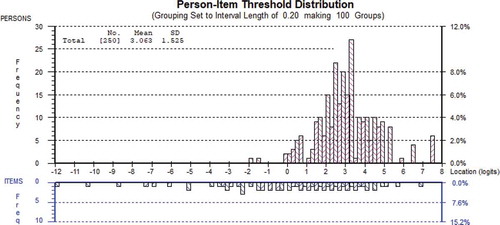
Rasch analysis was conducted to provide additional information about the CART-Q psychometric properties, to explore the extent the scale may be treated as a single-factor model where Closeness, Commitment, and Complementarity are described as item clusters with shared variance due to local response dependency. A model was tested where these sub-scale items were entered as subtests. The first iteration of this model already provided an adequate fit (χ2(15) = 12.14, p > .05). Person Separation Index (PSI), a measure of internal consistency reliability, was excellent (0.90) thus permitting reliable measurement within participants. Item coverage was adequate, as approximately 2% of the participants were not captured by the scale (). However, scores were negatively skewed, with the mean score located at 3.06 on the logit scale.
Figure 3. Person-item threshold distribution for the CART-Q when constructs were entered as subtests for the direct perspective data
Fitting the Rasch model to the individual scale items only resulted in nonsignificant, thus adequate fits for all three constructs. Skewness was extreme for Closeness and Complementarity (). In both cases, over 5% of the participants’ traits could not be assessed by the items, which presents inadequate coverage.
Figure 4. Person-item threshold distribution for the CART-Q when analyses were conducted separately for each construct using the direct perspective. The top panel shows results for Closeness, the middle panel Commitment, and bottom panel Complementarity
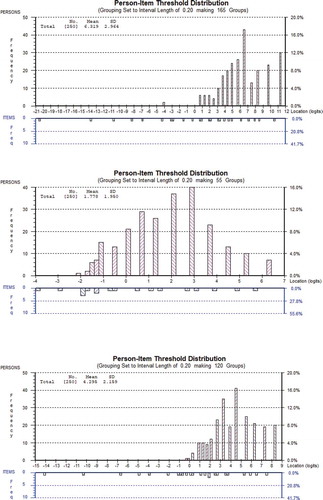
PSI for Closeness, Commitment, and Complementarity was 0.87, 0.82, and 0.82, respectively. While these values were lower than for the single-factor model, they still indicated adequate fit.
Overall, the results indicated that both the single-factor model, as well as individual construct scores, can be used with sufficiently robust psychometric properties. Given the issues with ceiling effects and item coverage for Closeness and Complementarity, the single-factor model appears preferable, with increased reliability. The same findings were noted for the meta-perspective.
Discussion
The purpose of this study was to examine the psychometric properties of the CART-Q, utilising a systematic analysis path as a mechanism to resolve previous uncertainty about a suitable factor solution. The validity and reliability of the CART-Q direct and meta-perspective versions were examined, with national football and futsal coaches and athletes in the New Zealand context.
Previous studies investigating the factorial validity of the CAR have identified the 3Cs (Jowett, Citation2003; Jowett & Cockerill, Citation2003; Jowett & Meek, Citation2000) and 3 + 1Cs (Jowett, Citation2007) models as multidimensional structures. CFA has previously been adopted as a preferred method of data analysis and although researchers have identified covariances between the errors of commonly identified items across subscales, the three-factor first-order and high-order structures have been reported as universal applicability across cultures (Ahmad, Citation2014; Yang & Jowett, Citation2010, Citation2012).
The methodological procedures used in this study to examine the factorial validity and reliability of the direct and meta-perspective versions of the CART-Q have replicated most procedures with previous studies. CFA was initially utilised using AMOS, followed by a model comparison strategy. However, to minimise the likelihood of psychometric findings materialising as an artefact of using a particular analytic tool, LISREL and Rasch analysis were then adopted. The rationale for utilising Rasch analysis was to advance the psychometric properties of the 3 + 1Cs model and CART-Q as it has unique advantages over CFA to determine the validity, reliability and item difficulty of self-reporting tools that adopt a Likert-scale. This is the first study to perform CTT and IRT, highlighting the contribution to scientific knowledge to examine the psychometric properties of the CART-Q.
The analysis indicated that the three-factor first-order structure demonstrated adequate fit. Nevertheless, issues with ceiling effects and item coverage for the constructs Closeness and Complementarity were observed. Contradicting previous findings, a unidimensional structure obtained greater robustness than the multidimensionality of the model. Therefore, a unidimensional factor solution may be a more appropriate representation of the model than previously reported and provides researchers with confidence in the CART-Q psychometric properties, as earlier discrepancies have been resolved through the adoption of Rasch analysis.
The CART-Q direct and meta-perspective versions adequately measure the quality of the CAR. This study supports previous findings with a strong positive correlation between the constructs of Closeness, Commitment, and Complementarity, with notable error covariances evident concerning item 1 (“I like my athlete/coach”) and item 6 (“I am close to my athlete/coach”) to traverse the constructs of Closeness and Commitment. Rhind et al. (Citation2012) while investigating the fundamental differences in how athletes from individual and team sports viewed the nature of their relationship with their coach, established that the 3Cs correlate more strongly in team sports than individual sports. Due to team-athletes being more inter-related than individual-athletes. Secondly, Balduck et al. (Citation2011) identified items 1 and 6 to be problematic due to error covariances in a sample of Belgian athletes. Balduck et al. postulated that the connection between the two items might have been due to the participants interpreting the questions as being similar in meaning, suggesting the participants had difficulty discerning the difference between the “emotions of being close” and the “cognitions of being close”. Cultural nuance was rationalised as a potential reason for this misinterpretation; however, it appears that this finding may not be not unique to the Belgian cultural context as it was also found in our New Zealand sample.
Rather than cultural nuances, we suggest the environmental factors in which the coaching process takes place to be a plausible explanation for the finding that error variances of items 1 and 6 are correlated. Athletes in team sports need to be personally and instrumentally interdependent. In team sports, athletes have less opportunity to interact with their coach having to compete with other athletes for face-to-face interpersonal transactions, and coaches are challenged with dividing their time equally to interact with the athletes personally (Woolliams, Citation2015). A typical New Zealand national football team would travel with a squad of 23 athletes to FIFA sanctioned events with approximately two to four opportunities to tour per annum. A typical New Zealand national futsal team would travel with a squad of 14 athletes to FIFA sanctioned events with one to two opportunities per annum. The lack of events to assemble athletes is problematic, limiting the opportunity for coaches and athletes to communicate face-to-face. The scarcity of opportunities for the athletes and coaches to communicate supports previous research conducted by Rhind et al. (Citation2012) determined athletes from individual sports reported being closer and more committed to their coach than those athletes in team sports.
Nevertheless, no significant differences were identified concerning Complementarity, noting that both individual and team athletes feel, think and behave similarly with regards to being responsive, friendly and ready to do their best. Individual sport athletes reported higher levels of coach trust, respect and appreciation for them as athletes than team athletes. This lack of opportunity for coaches and athletes to communicate one-to-one and face-to-face may be a contributing factor for athletes and coaches in team sports to experience a delayed onset of establishing close relationships, as it takes longer for the dyadic members to navigate and develop their emotions and cognitions towards their dyadic partner. Potential strategies to minimise this delayed onset of establishing close relationships and misunderstanding between the emotions and cognitions of being close could be overcome through the implementation of structured education programmes (Bennie & O’Connor, Citation2012). Athletes and coaches would benefit from having more in-depth knowledge of the differences between feelings and thoughts and the positive benefits of establishing high-quality relationships using the 3 + 1Cs as a best-practice model. This could lead to a greater awareness of the importance of the CAR, how to better navigate the development of high-quality relationships, and that increased levels of one-to-one communication are an essential factor.
The results exhibited a ceiling effect in the way in which the maximum score of 7 (Strongly Agree) on the Likert-scale was represented in the data. Further research to investigate adopting a scale of 1-10 rather than 1-7 may reduce the probability of a ceiling effect. Caution should be applied to this line of thinking as it will direct the participants into not having a neutral midpoint (4- neutral midpoint) as one can choose on a scale of 1-7. A scale of 1-10 will direct the participants to express either a negative or positive opinion.
Limitations
The following limitations need to be acknowledged. Firstly, the sample size used in this study was a limitation to analyse data using CFA. Even though the sample size per free parameters ratio was met, small sample size affects Chi-square statistics and RMSEA tends to over-reject true population models (Hu & Bentler, Citation1999) which is evident in existing CART-Q research (Balduck & Jowett, Citation2010; Jowett & Ntoumanis, Citation2004). Secondly, the sample may not allow for generalisability of the results due to the specific environmental context in which the coach-athlete relationships resides. Thirdly, it is worth noting that the coaches’ voice has not been given equal standing to the athletes’ as the national football and futsal teams require a squad of athletes and fewer coaches. Finally, further research is recommended, using Rasch analysis to examine the 3 + 1Cs model with a more comprehensive, diverse range of high-performing national teams and individual sports. This would increase the precision of the validity and reliability of both CART-Q versions to be incorporated into the CAR literature. Additionally, future research investigating how participants interpret the questions is required. There may be the need for a guide to be produced with an explanation of the questions for the participants to gain a better understanding of the meaning of each question to decrease the possibility of any misinterpretation.
Conclusion
In sum, the findings suggested that although the three-factor first-order structure demonstrated adequate fit, concerns with ceiling effects and item coverage for the constructs Closeness and Complementarity were observed. Based on the findings of this study, it is evident that a unidimensional structure obtained greater robustness than the multidimensionality of the model. Rasch analysis has highlighted that a unidimensional factor solution may be a more appropriate representation of the model than previously reported and provides researchers with confidence in the CART-Q psychometric properties.
Disclosure statement
No potential conflict of interest was reported by the authors.
References
- Ahmad, H. (2014). The coach-athlete relationship in the Middle East: Cultural considerations. https://repository.lboro.ac.uk/articles/The_coach-athlete_relationship_in_the_Middle_East_cultural_considerations/9609650
- Alagumalai, S., Curtis, D. D., & Hungi, N. (2005). Applied Rasch measurement: A book of exemplars. Springer.
- Andrich, D. (1978). A rating formulation for ordered response categories. Psychometrika, 43(4), 561–573. https://doi.org/10.1007/BF02293814
- Andrich, D. (1998). Understanding ordered category response data from the perspective of the Rasch model. Education Research and Perspectives, 25(2), 25. https://doi.org/10.3316/ielapa.991010606
- Andrich, D., Sheridan, B. E. D., & Luo, G. (2009). RUMM2030: Rasch unidimensional models for measurement. RUMM Laboratory.
- Balduck, A., & Jowett, S. (2010). Psychometric properties of the Belgian coach version of the coach–athlete relationship questionnaire (CART‐Q). Scandinavian Journal of Medicine & Science in Sports, 20(5), 779–786. https://doi.org/10.1111/j.1600-0838.2009.01020.x
- Balduck, A., Jowett, S., & Buelens, M. (2011). Factorial and predictive validity of the Belgian (Dutch) athlete version of the Coach-Athlete Relationship Questionnaire (CART-Q). International Journal of Sport Psychology, 42(2), 204–226.
- Bennie, A., & O’Connor, D. (2012). Perceptions and strategies of effective coaching leadership: A qualitative investigation of professional coaches and players. International Journal of Sport and Health Science, 10, 82–89. https://doi.org/10.5432/ijshs.201222
- Bentler, P. M. (1995). EQS structural equations program manual (Vol. 6). Multivariate software Encino, CA.
- Flora, D. B., & Curran, P. J. (2004). An empirical evaluation of alternative methods of estimation for confirmatory factor analysis with ordinal data. Psychological Methods, 9(4), 466. https://doi.org/10.1037/1082-989X.9.4.466
- Hu, L., & Bentler, P. M. (1999). Cutoff criteria for fit indexes in covariance structure analysis: Conventional criteria versus new alternatives. Structural Equation Modeling: A Multidisciplinary Journal, 6(1), 1–55. https://doi.org/10.1080/10705519909540118
- Jöreskog, K. G., & Sörbom, D. (1993). LISREL 8: Structural equation modeling with the SIMPLIS command language. Scientific Software International.
- Jowett, S. (2003). When the “honeymoon” is over: A case study of a coach-athlete dyad in crisis. The Sport Psychologist, 17(4), 444–460. https://doi.org/10.1123/tsp.17.4.444
- Jowett, S. (2006). Interpersonal and structural features of Greek coach–athlete dyads performing in individual sports. Journal of Applied Sport Psychology, 18(1), 69–81. https://doi.org/10.1080/10413200500471335
- Jowett, S. (2007). Interdependence analysis and the 3+ 1Cs in the coach-athlete relationship. In S. Jowett & D. Lavallee (Eds.), Social psychology in sport (pp. 15–27). Human Kinetics.
- Jowett, S. (2009a). Factor structure and criterion-related validity of the metaperspective version of the Coach–Athlete Relationship Questionnaire (CART-Q). Group Dynamics: Theory, Research, and Practice, 13(3), 163. https://doi.org/10.1037/a0014998
- Jowett, S. (2009b). Validating coach-athlete relationship measures with the nomological network. Measurement in Physical Education and Exercise Science, 13(1), 34–51. https://doi.org/10.1080/10913670802609136
- Jowett, S., & Cockerill, I. M. (2003). Olympic medallists’ perspective of the althlete–coach relationship. Psychology of Sport and Exercise, 4(4), 313–331. https://doi.org/10.1016/S1469-0292(02)00011-0
- Jowett, S., & Frost, T. (2007). Race/ethnicity in the all‐male coach‐athlete relationship: Black footballers’ narratives. International Journal of Sport and Exercise Psychology, 5(3), 255–269. https://doi.org/10.1080/1612197X.2007.9671835
- Jowett, S., & Meek, G. A. (2000). The coach-athlete relationship in married couples: An exploratory content analysis. The Sport Psychologist, 14(2), 157–175. https://doi.org/10.1123/tsp.14.2.157
- Jowett, S., & Ntoumanis, N. (2004). The coach–athlete relationship questionnaire (CART‐Q): Development and initial validation. Scandinavian Journal of Medicine & Science in Sports, 14(4), 245–257. https://doi.org/10.1111/j.1600-0838.2003.00338.x
- Jowett, S., & Shanmugam, V. (2016). Relational coaching in sport: Its psychological underpinnings and practical effectiveness. Routledge.
- Kelley, H. H., Berscheid, E., Christensen, A., Harvey, J. H., Huston, T. L., Levinger, G., McClintock, E., Peplau, L. A., & Peterson, D. R. (1983). Analyzing close relationships. In Close relationships (pp. 20–67). W. H. Freeman.
- Kersten, P., & Kayes, N. M. (2011). Outcome measurement and the use of Rasch analysis, a statistics-free introduction. New Zealand Journal of Physiotherapy, 39(2), 92–99.
- Li, F., & Harmer, P. (1996). Confirmatory factor analysis of the group environment questionnaire with an intercollegiate sample. Journal of Sport and Exercise Psychology, 18(1), 49–63. https://doi.org/10.1123/jsep.18.1.49
- Lundgren, Å. N., & Tennant, A. (2011). Past and present issues in Rasch analysis: The functional independence measure (FIM™) revisited. Journal of Rehabilitation Medicine, 43(10), 884–891. https://doi.org/10.2340/16501977-0871
- MacCallum, R. C. (1995). Model specification: Procedures, strategies, and related issues. In R. H. Hoyle (Ed.), Structural equation modeling: Concepts, issues, and applications (pp. 16–36). Sage Publications.
- Masters, G. N. (1982). A Rasch model for partial credit scoring. Psychometrika, 47(2), 149–174. https://doi.org/10.1007/BF02296272
- Medvedev, O. N., Titkova, E. A., Siegert, R. J., Hwang, Y., & Krägeloh, C. U. (2018). Evaluating short versions of the five facet mindfulness questionnaire using Rasch analysis. Mindfulness, 9(5), 1411–1422. https://doi.org/10.1007/s12671-017-0881-0
- Poczwardowski, A., Barott, J. E., & Jowett, S. (2006). Diversifying approaches to research on athlete–coach relationships. Psychology of Sport and Exercise, 7(2), 125–142. https://doi.org/10.1016/j.psychsport.2005.08.002
- Rasch, G. (1960). Studies in mathematical psychology: I. Probabilistic models for some intelligence and attainment tests. Nielsen & Lydiche.
- Rhind, D. J. A., & Jowett, S. (2010). Initial evidence for the criterion-related and structural validity of the long versions of the Coach–Athlete Relationship Questionnaire. European Journal of Sport Science, 10(6), 359–370. https://doi.org/10.1080/17461391003699047
- Rhind, D. J. A., Jowett, S., & Yang, S. X. (2012). A comparison of athletes’ perceptions of the coach-athlete relationship in team and individual sports. Journal of Sport Behavior, 35(4), 433–452.
- Schumacker, R. E., & Smith, J. E. V. (2007). A Rasch perspective. Educational and Psychological Measurement, 67(3), 394–409. https://doi.org/10.1177/0013164406294776
- Siegert, R. J., Tennant, A., & Turner-Stokes, L. (2010). Rasch analysis of the Beck Depression Inventory-II in a neurological rehabilitation sample. Disability and Rehabilitation, 32(1), 8–17. https://doi.org/10.3109/09638280902971398
- Trzaskoma-Bicsérdy, G., Bognár, J., Révész, L., & Géczi, G. (2007). The coach-athlete relationship in successful Hungarian individual sports. International Journal of Sports Science & Coaching, 2(4), 485–495. https://doi.org/10.1260/174795407783359759
- Woolliams, D. (2015). Examining the nature of interpersonal coach- athlete dyads between New Zealand national representative female football players and national coaches [unpublished masters thesis]. Auckland University of Technology. https://doi.org/10.13140/RG.2.1.4006.0007
- Yang, S. X., & Jowett, S. (2010). An examination of the psychometric properties of the Chinese Coach-Athlete Relationship Questionnaire (CART-Q). International Journal of Coaching Science, 4(2), 73–89. https://doi.org/10.1016/j.psychsport.2011.07.010
- Yang, S. X., & Jowett, S. (2012). Psychometric properties of the Coach–Athlete Relationship Questionnaire (CART-Q) in seven countries. Psychology of Sport and Exercise, 13(1), 36–43. https://doi.org/10.1016/j.psychsport.2011.07.010
- Yang, S. X., & Jowett, S. (2013). The psychometric properties of the short and long versions of the coach–athlete relationship questionnaire. Measurement in Physical Education & Exercise Science, 17(4), 281–294. https://doi.org/10.1080/1091367X.2013.831763