
ABSTRACT
Objectives
This study aimed to investigate whether self-regulation and dichotomous thinking might help to explain why some individuals maintain a normal body weight despite living in an obesogenic environment.
Design
Cross sectional correlational design.
Methods
Young Australians (142 female, 56 male; aged 20-35 years) completed a survey which included the Behavioural Weight Self-Regulation Questionnaire (BEWS-Q), the Dichotomous Thinking in Eating Disorders Scale (Byrne et al., 2008), and the SCOFF eating disorders screening tool (Morgan, 1999).
Results
Results regarding self-regulation were opposite to those hypothesised; BEWS-Q scores were positively correlated with maximum lifetime Body Mass Index (BMI), dichotomous thinking, and disordered eating. Marked gender differences emerged throughout, with significant relationships between variables for the females in the sample, but not for the males. Weight pattern across time (e.g., lifelong weight maintainer, or weight cycler) was significantly associated with more variables than was BMI category.
Conclusions
A uniform approach to weight management is unlikely to be effective, given the differences between males and females in this study. Also, excessive focus on weight behaviours and eating may be counterproductive to weight management. Weight across time may be more important than current BMI when considering weight management.
KEY POINTS
What is already known about this topic:
(1) Overweight and obesity are global problems, and most Australians are overweight or obese. Although most Australians live in obesogenic environments it is not known why some people maintain normal bodyweight.
(2) Self-regulation is the ability to alter one’s behaviour by making purposeful self-corrective adjustments towards a goal or to maintain an achieved goal. This ability may help explain why some people maintain normal bodyweight.
(3) Patterns of dichotomous thinking may disrupt weight self-regulation, impeding the ability to make self-corrective adjustments in working towards weight goals.
What this topic adds:
(1) There were marked gender differences throughout the results, with significant relationships across all variables for females, but not for males.
(2) Counter to prediction, weight self-regulation was positively associated with maximum lifetime BMI, dichotomous thinking, and disordered eating. Compared to current BMI, changes in weight pattern across time were associated with more predictors.
(3) A uniform approach to weight management is unlikely to be effective.
KEYWORDS:
Overweight and obesity are a global problem (World Health Organization, Citation2016a, Citation2016b). Most Australians are either overweight (35.5%) or obese (27.9%) (Australian Bureau of Statistics, Citation2015). Population-level and individual-level interventions for weight management have not yielded long-lasting results (Ng et al., Citation2014). Consequently, today’s overweight and obese generation may lead shorter, less healthy lives than their parents (Olshansky et al., Citation2005).
Most Australians live in obesogenic environments that promote obesity and impede normal weight maintenance (Kirk et al., Citation2010). Self-regulation may help to explain why some individuals maintain a normal weight despite their obesogenic environment (Joki et al., Citation2017). Dichotomous thinking may also affect body weight management (Byrne et al., Citation2004; Johnson et al., Citation2012). In this study we investigated whether self-regulation helps to explain why not everyone is overweight or obese, and how dichotomous thinking affects this.
Self-regulation and body weight
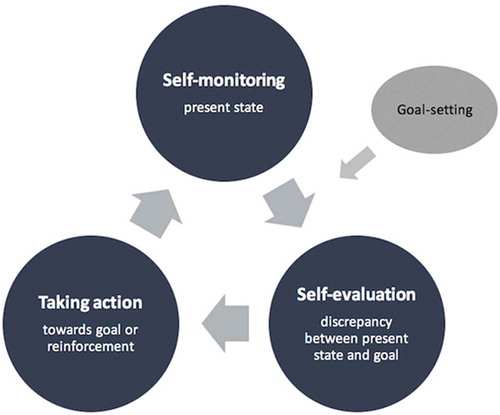
Self-regulation involves altering behaviours by making purposeful self-corrective adjustments towards a goal or to maintain an achieved goal (Vohs & Baumeister, Citation2011). There are four components of self-regulation (Johnson et al., Citation2012) (see ): goal-setting, self-monitoring, self-evaluation, and taking action. Self-regulation of body weight is a greater challenge now than historically. It was once advantageous to eat liberally and conserve energy given uncertainty over food availability (Heitmann et al., Citation2012), but today, obesogenic environments encourage excess consumption and sedentary lifestyles (Kirk et al., Citation2010), making self regulation crucial to weight management.
Figure 1. Self-regulation components identified in the current study via literature review: goal-setting, self-monitoring, self-evaluation and taking action
Normal weight BMI category
Those in the normal BMI category for most of their lives balance calories consumed and expended (Joki et al., Citation2017). Such behaviour fits within a self-regulation framework: they have a narrow acceptable weight range (1-3 kg) with a strict upper limit (clear goals: Joki et al., Citation2017); they mainly use subjective self-monitoring strategies (e.g., looking in the mirror) rather than objective strategies such as weighing (Joki et al., Citation2017); and many report that an error signal (e.g., tightening clothes; self-evaluation) triggers increasing activity (e.g., using the stairs) or decreasing meal size (taking action: Joki et al., Citation2017).
Weight pattern
There are important differences between weight patterns (Chambers & Swanson, Citation2012; Joki et al., Citation2017): Weight loss maintainers (WL-maintainers) and lifelong weight maintainers (LL-maintainers) are similar, but differ from weight regainers (W-regainers). WL-maintainers framed long-term goals as a “lifestyle change,” emphasising realistic goals, whereas W-regainers described short-term diets and unrealistic goals (McKee & Ntoumanis, Citation2014). WL-maintainers frequently self-monitored their weight whereas LL-maintainers rarely weighed themselves (Carrard & Kruseman, Citation2016; Chambers & Swanson, Citation2012; McKee et al., Citation2013). W-regainers tended only to self-monitor when losing weight and stopped after losing weight. For WL-maintainers and LL-maintainers, a discrepancy between their present and goal weight triggered action (Chambers & Swanson, Citation2012), whereas W-regainers needed the “right frame of mind” or external motivation (e.g., an event) before taking action, or else changed their goals to accommodate their increased weight (Chambers & Swanson, Citation2012). WL-maintainers or LL-maintainers wanting to lose any gained weight made small adjustments to food intake or activity levels (Chambers & Swanson, Citation2012; McKee et al., Citation2013). After a dietary lapse, W-regainers responded either passively (often leading to a relapse) or with periods of food restriction, which they saw as distinct from normal periods (Chambers & Swanson, Citation2012; McKee et al., Citation2013). These findings highlight differences in weight self-regulation behaviours depending on weight pattern.
LL-maintainers, WL-maintainers, and W-regainers are often researched, but other weight patterns are important. For example, Chambers and Swanson, (Citation2012) gainers category included individuals who had lost and regained weight (here, W-regainers), or had steadily increased weight since age 18 (here, W-gainers), and yo-yo dieters (here, W-cyclers). These weight patterns should be examined separately rather than combined, as they may have different characteristics. Additionally, these weight patterns may be confounded with BMI category.
Dichotomous thinking interrupting self-regulation?
Dichotomous thinking may disrupt weight self-regulation (Teixeira et al., Citation2015). It is characterised by cognitive rigidity and a view of the world as polarised categories instead of a “continuum of possibilities” (Linehan, 1993, as cited in Byrne et al., Citation2008, p. 155). Byrne et al. (Citation2004) found W-regainers showed more dichotomous thinking than did WL-maintainers. W-regainers displayed dichotomous thinking after a dietary lapse (e.g., “I’ve blown it!”), leading to counterproductive action whereas WL-maintainers were less dichotomous (e.g., “a lapse is not a failure”) and continued with their goals (Chambers & Swanson, Citation2012; McKee et al., Citation2013). Normal BMI individuals described flexible weight management strategies, with little indication of dichotomous thinking (Joki et al., Citation2017).
Gaps in the literature
Research on self-regulation and weight has mostly used female and older (Mage ~ 40) samples (e.g., Byrne et al., Citation2004; Chambers & Swanson, Citation2012; Joki et al., Citation2017; McKee et al., Citation2013). Obesity prevalence is growing faster among younger than older adults, but this group is often overlooked by researchers and policymakers (Hayes et al., Citation2017). Also, men have higher rates of overweight and obesity than women (Australian Bureau of Statistics, Citation2015) and weight management differs between genders (Chambers & Swanson, Citation2012; Joki et al., Citation2017). Therefore, a sample including young adults and both men and women would be valuable in exploring weight self-regulation. Finally, the literature lacks a measure to assess self-regulation in the context of weight.
The current study
This study investigated self-regulation and dichotomous thinking effects on BMI and weight pattern.
We predicted a negative relationship between self-regulation and BMI, because self-regulation has been associated with maintenance of a normal BMI (Joki et al., Citation2017), lifelong weight, and weight loss maintenance (Chambers & Swanson, Citation2012; McKee et al., Citation2013), and shows promise for weight management interventions (Gokee-Larose et al., Citation2009; Wing et al., Citation2016, Citation2006).
Further, we expected dichotomous thinking would moderate the relationship between self-regulation and BMI, with higher dichotomous thinking weakening the relationship, as dichotomous thinking may interrupt effective weight self-regulation (Chambers & Swanson, Citation2012; McKee et al., Citation2013).
We also hypothesised that self-regulation would vary depending on weight pattern (Chambers & Swanson, Citation2012; McKee et al., Citation2013), with W-losers showing the highest self-regulation, followed by WL-maintainers and then LL-maintainers. We predicted that W-gainers, W-regainers and W-cyclers would show lower self-regulation.
Finally, we expected dichotomous thinking would be higher in participants who categorised their weight pattern as W-regainers, W-gainers or W-cyclers, and lower for WL-maintainers and LL-maintainers (Byrne et al., Citation2004; Chambers & Swanson, Citation2012).
Method
Participants
An a priori power analysis (power = 0.8, α = 0.05; G*Power Version 3.1.9.2; Faul et al., Citation2009) showed 191 participants would be sufficient to detect the anticipated small effect size (d = 0.2). University students and community members (N = 245) were recruited via social media and university webpages. To avoid potential self-selection biases arising from having a project description that emphasised weight, we advertised for participants in a study on “behavioural and psychological factors in young Australians” lifestyles’. Participation was restricted to individuals aged 20-35. Forty-seven participants were excluded due to a combination of: (1) survey progress under 50%, (2) being out of the age range, <20, >30, and (3) survey completion under five minutes. The final sample contained 198 participants (142 females, 56 males; Mage = 24.80, SD = 4.05, range = 20-35). Males (Mage = 25.71, SD = 4.25, range = 20-34) were significantly older than females (Mage = 24.44, SD = 3.93, range = 20-35); t(196) = 2.01, p < .05.
Measures
Demographic information and weight-related variables
Age and gender information was collected. For height and weight, participants were advised to “provide your best estimate if you are not sure”. Although self-report of height and weight can be problematic (Krul et al., Citation2011; Scribani et al., Citation2014), it has been used satisfactorily in similar samples (Pursey et al., Citation2014; Quick et al., Citation2015) and was considered appropriate in this study.
There were several weight history questions, including current, lowest and highest weight since age 18. There was a forced choice selection from six weight patterns (Chambers & Swanson, Citation2012; McKee et al., Citation2013): lifelong weight maintainers (LL-maintainers), weight loss maintainers (WL-maintainers), weight regainers (W-regainers), weight cyclers (W-cyclers), weight losers (W-losers), and weight gainers (W-gainers). Two motivation questions, a weight goal question, and a free text entry about weight history, were also asked but are not presented here.
The behavioural weight self-regulation questionnaire
The Behavioural Weight Self-Regulation Questionnaire (BEWS-Q) was developed within this study from a review of self-regulation and body weight management research (Bandura, Citation1996; Carver & Scheier, Citation1982; Chambers & Swanson, Citation2012; Hernandez et al., Citation2016; Joki et al., Citation2017; Kanfer & Goldstein, Citation1986; McKee et al., Citation2013), and from free responses in qualitative studies. The scale was intended to measure self-regulation behaviours, and we posited four subscales: goal-setting, self-monitoring, self-evaluation, and taking action.
University academics and postgraduate psychology students provided pilot data and feedback on an initial 99-item version of the BEWS-Q. Several items were modified and 43 were removed for psychometric reasons or wording overlap, resulting in a 56-item scale. Participants indicated how true statements were of them, using a 5-point Likert scale, with 41 positively-keyed and 15 negatively-keyed items (1 = all of the time, to 5 = none of the time). After recoding, higher scores indicated a greater number and frequency of weight management self-regulation behaviours.
Dichotomous thinking in eating disorders scale (DTEDS-11)
The DTEDS-11 measures a cognitive style characterised by rigid black-and-white thinking (Byrne et al., Citation2008). The scale has a 7-item general subscale (DTEDS-11-General) measuring general cognitions (e.g., “I either get on very well with people or not at all”), and a 4-item eating subscale (DTEDS-11-Eating) measuring eating, dieting and weight-related cognitions (e.g., “I think of food as either ‘good’ or ‘bad’”). Participants respond to statements on a 4-point scale (1 = not at all true of me to 5 = very true of me. The mean of the two subscale means is the total scale score (Byrne et al., Citation2008). Higher scores indicated greater dichotomous thinking.
The DTEDS-11 has been used with diverse samples (Byrne et al., Citation2008, Citation2004; Dove et al., Citation2009; Egan et al., Citation2007). The subscales have good psychometric properties: DTESD-11-General (α = .86), DTEDS-11-Eating (α = .79) (Byrne et al., Citation2008). The DTEDS-11-Total reliability was not available, but was good for an earlier version of the scale, the DTEDS-12-Total (α = .88, Byrne et al., Citation2008).
SCOFF
Eating disorders might indicate unhealthy and unhelpful weight self-regulation. The SCOFF (Morgan et al., Citation1999) is a non-diagnostic self-report scale for screening eating disorders consisting of five yes/no questions (e.g., “do you worry that you have lost control over how much you eat?”). Concerns raised in piloting the current study led to modification of two questions, similar to those made by Hill et al. (Citation2010). Two or more “yes” responses suggest a “likely case” of anorexia nervosa or bulimia nervosa (Morgan et al., Citation1999).
The SCOFF has 100% sensitivity for anorexia nervosa and bulimia nervosa patients, and 87.5% specificity for controls (Morgan et al., Citation1999), and has been used across diverse samples (e.g., Eisenberg et al., Citation2011; Hefner & Eisenberg, Citation2009; Hill et al., Citation2010; Mond et al., Citation2008; Parker et al., Citation2005; Perry et al., Citation2002).
Design and procedure
The study had a cross-sectional correlational design. The survey was administered online (using Qualtrics) and took 15-20 minutes. Participants were given information about the study’s purpose and nature and told participation was voluntary and anonymous. They then provided informed consent. The survey consisted of three blocks: (1) demographics and weight history, (2) BEWS-Q, and (3) SCOFF and DTEDS-11. Participants were presented with (1) first, then (2) and (3) were counterbalanced. BEWS-Q item presentation was randomised. On survey completion, participants could enter a prize draw or receive course credit. This study was approved by the University’s Human Research Ethics Committee.
Results
Screening and cleaning
Data were screened and cleaned prior to analyses. Five cases reported their highest weight and height as the same. This was treated as an error due to incongruence with other weight information provided. Four cases were modified based on other data, and one was deleted because a highest weight estimate could not be ascertained. The following data was missing: BEWS-Q (48 items; <0.01%), DTEDS-11 (18 items, <0.01%), SCOFF (20 items, 0.02%), weight pattern (1 item, <0.01%). The weight pattern missing data point was replaced based on other responses. One case was deleted due to missing 48.2% of BEWS-Q items. Cases with missing data were subsequently deleted listwise.
BMI
BMI was calculated (kg/m2) for each participant for each time point. Current BMI, lowest BMI, and highest BMI were all non-normal with univariate outliers. Neither a log nor square root transformation sufficiently reduced skewness. Correlations with key variables showed no appreciable differences between the transformed and untransformed variables, so we report untransformed BMI results. BMI was categorised into underweight, normal, overweight and obese categories using World Health Organization (Citation2016b) guidelines (underweight, <18.5; normal weight, 18.5-24.9; overweight, 25-29.9; obese, ≥30).
BEWS-Q
Reliability and principal component analyses were conducted for the BEWS-Q. We factor analysed the whole scale for evidence for the four hypothesised subscales (goal-setting, self-monitoring, self-evaluation, and taking action), and analysed the scale reliability characteristics for each of the four subscales.
A Principal Components Analysis was appropriate given sampling adequacy was sufficient (KMO = .871) and Bartlett’s Test of Sphericity was significant (p < .001). An initial extraction using Kaiser’s criterion extracted 13 components with eigenvalues greater than one (eigenvalues were 14.93, 4.57, 2.94, 2.70, 1.93, 1.84, 1.51, 1.41, 1.28, 1.22, 1.15, 1.11 and 1.09). This initial pattern suggests a single factor.
We then tried to improve the fit by conducting an oblimin rotation, specifying four factors. These explained 26.67%, 8.16%, 7.03%, and 2.70% of the variance, respectively. The components were all positively but not highly correlated – the correlations ranged from .142 to .275, with a mean of .198. The pattern matrix showed the items did not load onto meaningful subscales.
A forced extraction of one factor was run and this was compared with the reliability analyses and separate factor analyses for the specified subscales. These converging analyses identified the same 14 underperforming items, which were subsequently deleted.
These procedures produced a final 42-item revised BEWS-Q presumably measuring one “general weight self-regulation” factor, accounting for 30.57% of the total variance, and with good reliability (α = .94). After recoding, mean scores were calculated for each participant. These were normally distributed with no univariate outliers. The 42 items are produced in Appendix A.
DTEDS-11
The DTEDS-11 was internally consistent: DTEDS-11-Total (α = .89), DTEDS-11-General (α = .84), DTEDS-11-Eating (α = .84). Skewness and kurtosis were acceptable with no univariate outliers present.
SCOFF
Internal consistency for the SCOFF was moderate (α = 0.60). It would have improved (to α = 0.69) by removing item 3: “have you recently lost more than 6.3 kg (one stone/14lb) in a 3-month period?” but the item was retained as it is important in screening for anorexia nervosa.
Descriptive statistics
Descriptive statistics are presented in . shows a correlation matrix for continuous variables.
Table 1. Descriptive statistics for the behavioural weight self-regulation questionnaire (BEWS-Q); current, lowest, and highest body mass index responses; and the dichotomous thinking in eating disorders scale (general and eating subscales, and total scale)
Table 2. Descriptive statistics for Weight Pattern, BMI category (lowest, highest, current), and SCOFF categories
Table 3. Pearson’s bivariate correlations between behavioural weight self-regulation questionnaire (BEWS-Q); current, lowest, and highest body mass index responses; and the dichotomous thinking in eating disorders scale (general and eating subscales, and total scale)
Hypotheses
Self-regulation, BMI, and dichotomous thinking
As per , BEWS-Q was only significantly positively correlated with highest BMI (r = .21, p < .01). Three consecutive one-way ANOVAs, with BEWS-Q as the dependent variable (DV) and BMI category as the independent variable (IV), showed no effect of current or lowest BMI category on BEWS-Q scores. There was an effect of highest BMI category on BEWS-Q scores, F(3,188) = 3.93, p = .009, η2 = 0.06. Tukey’s HSD indicated that BEWS-Q scores were lower (p = .042) for participants whose highest BMI fell into the normal weight (N = 101, M = 2.69, SD = 0.66) rather than overweight (N = 55, M = 2.98, SD = 0.61) category. The difference between normal weight (N = 101, M = 2.69, SD = 0.66) and obese (N = 34, M = 3.01, SD = 0.65) categories was marginally significant (p = .064).
The relationship between BEWS-Q score and BMI varied by gender. Males showed a significant correlation between BEWS-Q score and BMI across all time points, whereas females only showed this relationship with highest BMI (see ).
Table 4. Pearson’s bivariate correlations between behavioural weight self-regulation questionnaire (BEWS-Q) and BMI, by Gender
Three consecutive moderation analyses were run using PROCESS V.3 Model 1 (Hayes, Citation2018) with BEWS-Q score as the predictor, DTEDS-11-Total as the moderator, and each BMI time point as the outcome variable. No significant moderation effects were found: Current BMI, BEWS-Q x DTEDS-11-Total (b = −0.37, p = .53); lowest BMI, BEWS-Q x DTEDS-11-Total (b = −0.23, p = .67); highest BMI, BEWS-Q x DTEDS-11-Total (b = −0.33, p = .67). The moderation analyses were re-run by gender, but there were no significant interactions.
DTEDS-11-Total (and subscales) correlated positively with BEWS-Q, and with highest BMI (see ). Three consecutive one-way ANOVAs, with DTEDS-11-Total as the DV and BMI category as the IV, showed no effect of current, lowest or highest BMI category on DTEDS-11-Total scores.
Self-regulation and weight pattern
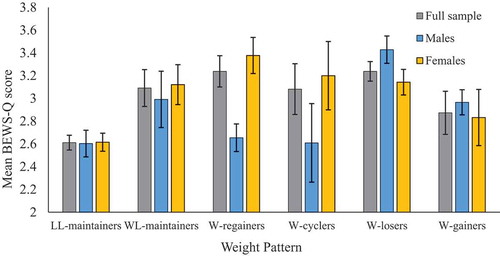
The hypothesis of a significant relationship between self-regulation and weight pattern was examined using a one-way ANOVA. The assumptions of ANOVA were all met, (Tabachnick & Fidell, Citation2013). The effect of BEWS-Q score on weight pattern was significant, F(5,186) = 5.55, p < .001, η2 = 0.13. Tukey’s HSD indicated that BEWS-Q scores were lower for LL-maintainers (M = 2.61, SD = 0.61) than W-regainers (p < .01, M = 3.21, SD = 0.67), W-cyclers (p = .012, M = 3.08, SD = 0.68), and W-losers (p = .049, M = 3.24, SD = 0.67).
For females, the effect of BEWS-Q score on weight pattern was significant, F(5,131) = 5.11, p < .001, η2 = 0.16. Tukey’s HSD indicated that BEWS-Q scores were lower for female LL-maintainers (M = 2.61, SD = 0.61) than W-regainers (p < .01, M = 3.37, SD = 0.63) and female W-cyclers (p = .012, M = 3.20, SD = 0.71), but not for female W-losers. For males, the effect of BEWS-Q score on weight pattern was not significant, F(5,49) = 1.99, p = .096, η2 = 0.17 (see ).
Figure 2. BEWS-Q scores by weight pattern and gender. Error bars represent standard error
Dichotomous thinking and weight pattern
The hypothesised relationship between dichotomous thinking and weight pattern was examined using a one-way ANOVA. The assumptions of ANOVA were met (Tabachnick & Fidell, Citation2013). There was a significant effect of weight pattern on DTEDS-11-Total scores, F(5,187) = 3.40, p = .006, η2 = 0.08. Tukey’s HSD indicated that DTEDS-11-Total scores were lower (p < .01) for LL-maintainers (M = 2.0, SD = 0.60) than for W-cyclers (M = 2.61, SD = 0.79). Similar ANOVA results were found for DTEDS-11-General, F(5,187) = 2.65, p = .024, η2 = 0.07, and DTEDS-11-Eating, F(5,187) = 3.16, p = .009, η2 = 0.08.
For females, there was an effect of weight pattern on DTEDS-11-Total scores, F(5,132) = 2.92, p = .016, η2 = 0.11. Tukey’s HSD indicated that DTEDS-11-Total scores were lower (p < .01) for female LL-maintainers (M = 1.96, SD = 0.59) than for female W-cyclers (M = 2.61, SD = 0.84), with similar results for DTEDS-11-General and DTEDS-11-Eating. For males, there was no significant effect of weight pattern on DTEDS-11-Total, DTEDS-11-General, or DTEDS-11-Eating scores.
Disordered eating
The SCOFF responses were dichotomised into an eating disorder status variable, with two or more “yes” responses suggesting an eating disorder (ED), and no or one “yes” response suggesting no eating disorder (no ED). More females (32.5%) than males (7.1%) had an ED. All males with an ED identified as W-gainers. Females with an ED exhibited various weight patterns, mostly W-gainers or W-cyclers. For those with no ED, distribution of weight pattern was similar across genders (see ). For current BMI, both males and females with an ED and with no ED showed a similar distribution across BMI categories (see ).
Table 5. Percentage breakdown of weight pattern group, by eating disorder status and gender
Table 6. Percentage breakdown of current BMI category, by eating disorder status and gender
ED status correlated with BEWS-Q score (rpb = .43, p < .001). This varied by gender, with a relationship between ED status and BEWS-Q for females (rpb = .47, p < .001), but not for males (rpb = .19, p = .177).
DTEDS-11-Total scores were compared for those with and those without an ED, in the full sample and by gender. DTEDS-11-Total scores were higher (p < .001) for those with an ED (M = 2.69, SD = 0.63) than with no ED (M = 1.97, SD = 0.61). The difference was significant (p < .001) for females (ED, M = 2.71, SD = 0.63; no ED, M = 1.98, SD = 0.59), but not for males (ED, M = 2.38, SD = 0.59; no ED, M = 2.09, SD = 0.64).
Discussion
Can self-regulation and dichotomous thinking help explain differences in BMI? We hypothesised that higher self-regulation would result in lower BMIs, particularly given individuals in the normal BMI category use self-regulation behaviours for weight management (Hernandez et al., Citation2016; Joki et al., Citation2017). However, self-regulation was unrelated to current or lowest BMI; and for highest lifetime BMI, higher self-regulation scores predicted larger BMIs. Unexpectedly, dichotomous thinking did not moderate the relationship between self-regulation and BMI. Significant relationships between self-regulation and weight pattern, and self-regulation and dichotomous thinking, were not in the hypothesised direction. The relationships between several variables varied by gender.
Self-regulation
The self-regulation results were not as hypothesised. Self-regulation was positively correlated with highest BMI: as self-regulation increased, so too did maximum lifetime weight. We expected self-regulation would be negatively correlated with dichotomous thinking, but found the opposite: higher self-regulation was associated with losing and gaining weight multiple times (W-cyclers), whereas lifelong weight maintainers (LL-maintainers) had lower self-regulation. Moreover, self-regulation was higher in participants with an eating disorder than those not.
We used self-regulation theory as a framework for understanding BMI. This is not new, as Carver and Scheier (Citation1982) proposed control theory (later, self-regulation) to understand how individuals manage their physical wellbeing. We used the BEWS-Q scale to quantify self-regulation behaviours described in qualitative research with individuals who maintain weight in the normal BMI category (Hernandez et al., Citation2016; Joki et al., Citation2017), but it may have captured elements of body image such as overvaluation of, and preoccupation with, weight and shape, which are predictors of disordered eating (Sharpe et al., Citation2018), all counterproductive to healthy weight management.
In previous studies (Chambers & Swanson, Citation2012; Hernandez et al., Citation2016; Joki et al., Citation2017), LL-maintainers and weight loss maintainers (WL-maintainers) seemed less conscious about their weight self-regulation behaviours than those who had lost and regained weight (W-regainers). In fact, maintaining a healthy weight may involve thinking less about one’s weight. Automaticity and habit formation may help in weight management also. Hernandez et al. (Citation2016) suggested that self-regulation had become habitual and automatic for their normal BMI participants. Automatising habits means they are performed more frequently (Gardner, Citation2012).
In this study, those higher on the BEWS-Q may have been more conscious of their behaviours because they were less automatic. Conversely, those with lower BEWS-Q scores may have been less conscious of their behaviours because they performed them more automatically. Research has investigated lessening the automaticity of unhelpful behaviours and increasing that of new helpful behaviours (Ferentzi et al., Citation2018). Future research could explore the automaticity of health behaviours in individuals who maintain a normal weight BMI, and examine why the relationship between BEWS-Q and BMI varied by gender.
Dichotomous thinking
Dichotomous thinking did not moderate the relationship between self-regulation and BMI as hypothesised. However, higher dichotomous thinking was associated with higher BEWS-Q scores. Despite our intentions, the BEWS-Q may have inadvertently measured rigid dichotomous thinking, which is unhelpful to weight management (Byrne et al., Citation2008).
While dichotomous thinking did not vary significantly within BMI categories, it did vary by weight pattern. Consistent with (Chambers & Swanson, Citation2012; McKee et al., Citation2013), dichotomous thinking was higher in W-cyclers than LL-maintainers (but not for males). Researchers often compare W-regainers with WL-maintainers (often after weight loss interventions), but this does not consider participants’ previous weight pattern (i.e. have they lost and regained weight once or more in the past). Future research should consider weight patterns.
This study supported use of the DTEDS-11 (Byrne et al., Citation2008). It showed good psychometric properties with the young adult sample and highlighted gender differences in response patterns. Also, of the three scales, the DTEDS-11-Eating subscale was most strongly correlated with BEWS-Q scores, suggesting concurrent validity regarding eating and weight issues. However, the BEWS-Q scale needs more psychometric work to better establish validity and reliability.
Disordered eating
The SCOFF is a screening tool for anorexia nervosa and bulimia nervosa (Morgan et al., Citation1999). The Australian prevalence of eating disorders meeting diagnostic criteria is estimated at 3% for men and 15% for women (Hay et al., Citation2015). Our sample showed a similar ratio (women were about five times more likely to an ED than men), but a higher frequency, likely because we had a younger sample (associated with a greater proportion of eating disorders, Hay et al., Citation2015), used a non-diagnostic tool, and did not specifically include binge-eating disorder. Binge-eating disorder was not a recognised diagnosis when the SCOFF was developed (Solmi et al., Citation2015). A revised SCOFF could incorporate this, as binge-eating disorder is a common feature of obesity (Hay et al., Citation2015).
In the current study, the relationship of SCOFF with key variables varied by gender. eating disorder (ED) status and BEWS-Q were significantly related for females, but not for males. There was variation in the ED status and weight pattern across genders, but the distribution of weight patterns across current BMI categories for each gender was comparable. This suggests different processes for males and females. However, we note the small number of males with an ED, so further research is needed with larger and more even group numbers.
Limitations
The main limitations to this study include uneven groups and self-selection into the study potentially resulting in a high proportion of normal BMI participants. Also, as others have found (e.g., Mond et al., Citation2008), the internal consistency for the SCOFF was poor and further psychometric development is required (Crosby & Mitchell, Citation2000).
Although the study emphasised weight across time (i.e. weight pattern), it was cross-sectional. A longitudinal study would not rely on poor or flawed recollections of weight changes across time, and could assess ascertain directionality of effects. Weight pattern may influence thinking style, or vice versa. For example, an individual may be more preoccupied with their weight because it changes frequently or easily.
The study also convenience sampled undergraduate psychology students and respondents who chose to respond to advertisements about the study posted on various social media. This clearly limits the generalizability of our results. The novel results reported here require further investigation with more rigorous sampling of participants from defined populations.
Our study was possibly underpowered to detect interactions between self-regulation and dichotomous thinking, especially when the number of males was small relative to the number of females. Against this, though, the study did generate many significant results, so by backwards argument it must have had adequate power to detect them. We also found a significant correlation between BEWS-Q and BMI for males but not for females, despite having more than twice as many females as males, suggesting adequate statistical power.
Finally, our study shares some limitations with the broader literature on self-regulation of body weight. Self-regulation models mostly neglect consideration of wider social and environmental influences. Also, cross-cultural differences in the obesogenicity of a city or country play a role, which should be considered in future research.
Clinical relevance and conclusions
This study supports prior research suggesting that identifying and addressing dichotomous thinking around weight and eating should be part of weight interventions. This could be addressed as part of a preventative strategy, for example, with children and adolescents who are not yet overweight. Flexibility and automaticity of behaviours may also be crucial to weight management. Recent weight interventions based on self-regulation and automaticity show promising results (Kliemann et al., Citation2017).
The current study highlights gender differences in weight management. A one-size-fits-all approach is unlikely to be effective, and more research is needed with males. The findings also suggest that focusing on weight behaviours and eating may in fact be counterproductive. Perhaps treatment would benefit from helping clients to focus on non-weight related behaviours. An increased focus on other life areas may lead to normal weight, allowing automatic self-regulation to happen with less disturbances from weight and shape related cognitions.
In conclusion, self-regulation as measured in the current study appeared to be more helpful in understanding the differences in weight across time rather than BMI category.
The findings suggest four main messages for research and clinical practice: (1) consider gender, (2) seek ways to encourage automaticity, (3) find out about weight pattern across time, and (4) be aware that it may not be productive for individuals to focus too much on weight-related behaviours.
Disclosure statement
No potential conflict of interest was reported by the authors.
References
- Australian Bureau of Statistics. (2015). National health survey: First results, Australia, 2014-15. www.abs.gov.au.
- Bandura, A. (1996). Failures in self-regulation: Energy depletion or selective disengagement? Psychological Inquiry, 7(1), 20–24. https://doi.org/10.1207/s15327965pli0701_6
- Byrne, S. M., Allen, K. L., Dove, E. R., Watt, F. J., & Nathan, P. R. (2008). The reliability and validity of the dichotomous thinking in eating disorders scale. Eating Behaviors, 9(2), 154–162. https://doi.org/10.1016/j.eatbeh.2007.07.002
- Byrne, S. M., Cooper, Z., & Fairburn, C. G. (2004). Psychological predictors of weight regain in obesity. Behaviour Research and Therapy, 42(11), 1341–1356. https://doi.org/10.1016/j.brat.2003.09.004
- Carrard, I., & Kruseman, M. (2016). Qualitative analysis of the role of self-weighing as a strategy of weight control for weight-loss maintainers in comparison with a normal, stable weight group. Appetite, 105, 604–610. https://doi.org/10.1016/j.appet.2016.06.035
- Carver, C. S., & Scheier, M. F. (1982). Control theory: A useful conceptual framework for personality-social, clinical, and health psychology. Psychological Bulletin, 92(1), 111–135. https://doi.org/10.1037/0033-2909.92.1.111
- Chambers, J. A., & Swanson, V. (2012). Stories of weight management: Factors associated with successful and unsuccessful weight maintenance. British Journal of Health Psychology, 17(2), 223–243. https://doi.org/10.1111/j.2044-8287.2011.02030.x
- Crosby, R. D., & Mitchell, J. E. (2000). The SCOFF questionnaire: A promising instrument, but more research is needed. Western Journal of Medicine, 172, 165. https://europepmc.org/articles/pmc1070795
- Dove, E. R., Byrne, S. M., & Bruce, N. W. (2009). Effect of dichotomous thinking on the association of depression with BMI and weight change among obese females. Behaviour Research and Therapy, 47(6), 529–534. https://doi.org/10.1016/j.brat.2009.02.013
- Egan, S. J., Piek, J. P., Dyck, M. J., & Rees, C. S. (2007). The role of dichotomous thinking and rigidity in perfectionism. Behaviour Research and Therapy, 45(8), 1813–1822. https://doi.org/10.1016/j.brat.2007.02.002
- Eisenberg, D., Nicklett, E. J., Roeder, K., & Kirz, N. E. (2011). Eating disorder symptoms among college students: Prevalence, persistence, correlates, and treatment-seeking. Journal of American College Health, 59(8), 700–707. https://doi.org/10.1080/07448481.2010.546461
- Faul, F., Erdfelder, E., Buchner, A., & Lang, A. G. (2009). Statistical power analyses using G*Power 3.1: Tests for correlation and regression analyses. Behavior Research Methods, 41(4), 1149–1160. https://doi.org/10.3758/BRM.41.4.1149
- Ferentzi, H., Scheibner, H., Wiers, R., Becker, E. S., Lindenmeyer, J., Beisel, S., & Rinck, M. (2018). Retraining of automatic action tendencies in individuals with obesity: A randomized controlled trial. Appetite, 126, 66–72. https://doi.org/10.1016/j.appet.2018.03.016
- Gardner, B. (2012). Habit as automaticity, not frequency. The European Health Psychologist, 14(2), 32–36. http://www.ehps.net/ehp/index.php/contents/article/view/ehp.v14.i2.p32/1012
- Gokee-Larose, J., Gorin, A. A., & Wing, R. R. (2009). Behavioral self-regulation for weight loss in young adults: A randomized controlled trial. International Journal of Behavioral Nutrition and Physical Activity, 6(1), 1–9. https://doi.org/10.1186/1479-5868-6-10
- Hay, P., Girosi, F., & Mond, J. (2015). Prevalence and sociodemographic correlates of DSM-5 eating disorders in the Australian population. Journal of Eating Disorders, 3(1), 1–7. https://doi.org/10.1186/s40337-015-0056-0
- Hayes, A. F. (2018). The PROCESS macro for SPSS and SAS. www.processmacro.org
- Hayes, A. J., Lung, T. W., Bauman, A., & Howard, K. (2017). Modelling obesity trends in Australia: Unravelling the past and predicting the future. International Journal of Obesity, 41(1), 178–185. https://doi.org/10.1038/ijo.2016.165
- Hefner, J., & Eisenberg, D. (2009). Social support and mental health among college students. American Journal of Orthopsychiatry, 79(4), 491–499. https://doi.org/10.1037/a0016918
- Heitmann, B. L., Westerterp, K. R., Loos, R. J., Sorensen, T. I., O’Dea, K., McLean, P., Jensen, T. K., Eisenmann, J., Speakman, J. R., Simpson, S. J., & Reed, D. R. (2012). Obesity: Lessons from evolution and the environment. Obesity Reviews, 13(10), 910–922. https://doi.org/10.1111/j.1467-789X.2012.01007.x
- Hernandez, C. A., Hernandez, D. A., Wellington, C. M., & Kidd, A. (2016). The experience of weight management in normal weight adults. Applied Nursing Research, 32, 289–295. https://doi.org/10.1016/j.apnr.2016.08.009
- Hill, L. S., Reid, F., Morgan, J. F., & Lacey, J. H. (2010). SCOFF, the development of an eating disorder screening questionnaire. International Journal of Eating Disorders, 43(4), 344–351. https://doi.org/10.1002/eat.20679
- Johnson, F., Pratt, M., & Wardle, J. (2012). Dietary restraint and self-regulation in eating behavior. International Journal of Obesity, 36(5), 665–674. https://doi.org/10.1038/ijo.2011.156
- Joki, A., Makela, J., & Fogelholm, M. (2017). Permissive flexibility in successful lifelong weight management: A qualitative study among Finnish men and women. Appetite, 116, 157–163. https://doi.org/10.1016/j.appet.2017.04.031
- Kanfer, F. H., & Goldstein, A. P. (Eds.). (1986). Helping people change: A textbook of methods. Pergamon.
- Kirk, S. F., Penney, T. L., & McHugh, T. L. (2010). Characterizing the obesogenic environment: The state of the evidence with directions for future research. Obesity Reviews, 11(2), 109–117. https://doi.org/10.1111/j.1467-789X.2009.00611.x
- Kliemann, N., Vickerstaff, V., Croker, H., Johnson, F., Nazareth, I., & Beeken, R. J. (2017). The role of self-regulatory skills and automaticity on the effectiveness of a brief weight loss habit-based intervention: Secondary analysis of the 10 top tips randomised trial. International Journal of Behavioral Nutrition and Physical Activity, 14(1), 119. https://doi.org/10.1186/s12966-017-0578-8
- Krul, A. J., Daanen, H. A., & Choi, H. (2011). Self-reported and measured weight, height and body mass index (BMI) in Italy, the Netherlands and North America. European Journal of Public Health, 21(4), 414–419. https://doi.org/10.1093/eurpub/ckp228
- McKee, H. C., & Ntoumanis, N. (2014). Developing self-regulation for dietary temptations: Intervention effects on physical, self-regulatory and psychological outcomes. Journal of Behavioral Medicine, 37(6), 1075–1081. https://doi.org/10.1007/s10865-014-9557-6
- McKee, H. C., Ntoumanis, N., & Smith, B. (2013). Weight maintenance: Self-regulatory factors underpinning success and failure. Psychology & Health, 28(10), 1207–1223. https://doi.org/10.1080/08870446.2013.799162
- Mond, J. M., Myers, T. C., Crosby, R. D., Hay, P. J., Rodgers, B., Morgan, J. F., Lacey, J. H., & Mitchell, J. E. (2008). Screening for eating disorders in primary care: EDE-Q versus SCOFF. Behaviour Research and Therapy, 46(5), 612–622. https://doi.org/10.1016/j.brat.2008.02.003
- Morgan, J. F., Reid., F., & Lacey, J. H. (1999). The SCOFF questionnaire: A new screening tool for eating disorders. The BMJ, 139(7223), 1467–1468. https://doi.org/10.1136/bmj.319.7223.1467
- Ng, M., Fleming, T., Robinson, M., Thomson, B., Graetz, N., Margono, C., Mullany, E. C., Biryukov, S., Abbafati, C., Abera, S. F., & Abraham, J. P. (2014). Global, regional, and national prevalence of overweight and obesity in children and adults during 1980–2013: A systematic analysis for the Global Burden of Disease Study 2013. The Lancet, 384(9945), 766–781. https://doi.org/10.1016/s0140-6736(14)60460-8
- Olshansky, S. J., Passaro, D. J., Hershow, R. C., Layden, J., Carnes, B. A., Brody, J., Hayflick, L., Butler, R. N., Allison, D. B., & Ludwig, D. S. (2005). A potential decline in life expectancy in the United States in the 21st century. The New England Journal of Medicine, 352(11), 1138–1145. https://doi.org/10.1056/NEJMsr043743
- Parker, S., Lyons, J., & Bonner, J. (2005). Eating disorders in graduate students: Exploring the SCOFF questionnaire as a simple screening tool. Journal of American College Health, 54(2), 103–107. https://doi.org/10.3200/JACH.54.2.103-107
- Perry, L., Morgan, J., Reid, F., Brunton, J., O’Brien, A., Luck, A., & Lacey, H. (2002). Screening for symptoms of eating disorders: Reliability of the SCOFF screening tool with written compared to oral delivery. International Journal of Eating Disorders, 32(4), 466–472. https://doi.org/10.3200/JACH.54.2.103-107
- Pursey, K., Burrows, T. L., Stanwell, P., & Collins, C. E. (2014). How accurate is web-based self-reported height, weight, and body mass index in young adults? Journal of Medical Internet Research, 16(1), e4. https://doi.org/10.2196/jmir.2909
- Quick, V., Byrd-Bredbenner, C., Shoff, S., White, A. A., Lohse, B., Horacek, T., Kattelmann, K., Phillips, B., Hoerr, S. L., & Greene, G. (2015). Concordance of self-report and measured height and weight of college students. Journal of Nutrition Education and Behavior, 47(1), 94–98. https://doi.org/10.1016/j.jneb.2014.08.012
- Scribani, M., Shelton, J., Chapel, D., Krupa, N., Wyckoff, L., & Jenkins, P. (2014). Comparison of bias resulting from two methods of self-reporting height and weight: A validation study. JRSM Open, 5(6), 1–7. https://doi.org/10.1177/2042533313514048
- Sharpe, H., Griffiths, S., Choo, T.-H., Eisenberg, M. E., Mitchison, D., Wall, M., & Neumark-Sztainer, D. (2018). The relative importance of dissatisfaction, overvaluation and preoccupation with weight and shape for predicting onset of disordered eating behaviors and depressive symptoms over 15 years. International Journal of Eating Disorders, 51(10), 1168–1175. https://doi.org/10.1002/eat.22936
- Solmi, F., Hatch, S. L., Hotopf, M., Treasure, J., & Micali, N. (2015). Validation of the SCOFF questionnaire for eating disorders in a multiethnic general population sample. International Journal of Eating Disorders, 48(3), 312–316. https://doi.org/10.1002/eat.22373
- Tabachnick, B. G., & Fidell, L. S. (2013). Using multivariate statistics (6th ed.). International: Pearson.
- Teixeira, P. J., Carraca, E. V., Marques, M. M., Rutter, H., Oppert, J. M., De Bourdeaudhuij, I., Lakerveld, J., & Brug, J. (2015). Successful behavior change in obesity interventions in adults: A systematic review of self-regulation mediators. BMC Medicine, 13(1), 1–16. https://doi.org/10.1186/s12916-015-0323-6
- Vohs, K. D., & Baumeister, R. F. (Eds.). (2011). Handbook of self-regulation: Research, theory, and applications (2nd ed.). The Guildford Press.
- Wing, R. R., Tate, D. F., Espeland, M. A., Lewis, C. E., LaRose, J. G., Gorin, A. A., Bahnson, J., Perdue, L. H., Hatley, K. E., Ferguson, E., & Garcia, K. R. (2016). Innovative self-regulation strategies to reduce weight gain in young adults: The study of novel approaches to weight gain prevention (SNAP) randomized clinical trial. JAMA Internal Medicine, 176(6), 755–762. https://doi.org/10.1001/jamainternmed.2016.1236
- Wing, R. R., Tate, D. F., Gorin, A. A., Raynor, H. A., & Fava, J. F. (2006). A self-regulation program for maintenance of weight loss. The New England Journal of Medicine, 355(15), 1563–1571. https://doi.org/10.1056/NEJMoa061883
- World Health Organization. (2016a). Global Health Observatory data repository. http://apps.who.int/gho/data/view.main.GLOBAL2461A?lang=en
- World Health Organization. (2016b). Overweight and obesity. http://www.who.int/mediacentre/factsheets/fs311/en/
Appendix A
Behavioural Weight Self-Regulation Questionnaire (BEWS-Q)
I have goals about what I’d like my weight to be
I don’t have any goals about what I would like my weight to be (R)
I think of weight loss as a lifestyle change
Weight maintenance is part of my lifestyle
I have a maximum acceptable weight
I am generally aware of how much I weigh
I have no idea how much I weigh (R)
I weigh myself daily
I weigh myself weekly
I weigh myself monthly
I weigh myself less than monthly (R)
I can’t remember the last time I weighed myself (R)
I monitor my weight by looking at my body in the mirror
I monitor my weight by the fit of my clothing
I monitor my weight by my appearance in photos
I monitor my weight by the fit of my rings
I monitor my weight be the fit of my belt
In my mind, I track my calorie intake daily
I keep food diaries
I monitor my exercise
I keep exercise diaries
I keep track of my weight goals and where I’m currently at
I track my weight to see how I am processing in relation to my goal
When I weigh myself, I compare this to my goal and think about whether or not I’m in line with it
After weighing myself, I think about how this relates to my goal
Acknowledging that I’m not at my goal weight, encourages me to take action towards it
If my weight is getting really far away from my goal, I begin to feel discomfort
I don’t mind if my weight is not what I would like it to be (R)
I congratulate myself for achieving a goal regarding my weight
If I’ve maintained weight loss, I make sure to keeping congratulating myself
If my weight is similar to my ideal weight, I congratulate myself
I eat less if I don’t get a chance to exercise in a day
I consider my food and energy balance each week
I try to balance “energy-in” versus “energy-out” every day
I’ll exercise a little bit harder if I’ve recently had a big meal
If I’ve have a meal that is larger than usual for me, I will exercise more that day
If I’ve gained a little weight, I cut out a snack or two from my eating
When I’m on a diet I cut out fattening foods such as cakes and biscuits
I’m either on a diet or off a diet (R)
I exercise regularly to control my weight
I don’t have time to exercise (R)
I exercise every day
I exercise to keep my weight under control
Note: (R) indicates reverse-worded itemsa