
 ?Mathematical formulae have been encoded as MathML and are displayed in this HTML version using MathJax in order to improve their display. Uncheck the box to turn MathJax off. This feature requires Javascript. Click on a formula to zoom.
Abstract
Among neurological patients, stroke is the most common cause of mortality. It is a health problem that is very costly all over the world. Therefore, the mortality due to the disease can be reduced by identifying and modifying the risk factors. Controllable factors which are contributing to stroke including hypertension, diabetes, heart disease, hyperlipidemia, smoking, and obesity. Therefore, by identifying and controlling the risk factors, stroke can be prevented and the effects of this disease could be reduced to a minimum. Therefore, for the quick and timely diagnosis of the disease, we need an intelligent system to predict the stroke risk. In this paper, a method has been proposed for predicting the risk rate of stroke which is based on fuzzy cognitive maps and nonlinear Hebbian learning algorithm. The accuracy of the proposed NHL-FCM model is tested using 15-fold cross-validation, for 90 actual cases, and compared with those of support vector machine and k-nearest neighbours. The proposed method shows superior performance with a total accuracy of (95.4 ± 7.5)%.
1. Introduction
Stroke is considered as a prominent problem in public health and it is one of the major causes of mortality in many countries, all over the world, especially in Iran. There are huge annual costs for the diagnosis and treatment of these patients in addition to the high rate of mortality [Citation1,Citation2]. This shows the necessity of introduction and identification of the disease and providing effective methods for better treatments. Therefore, it is necessary to design an effective medical decision-making system to help physicians to predict stroke probability occurrence in order to take a small step in controlling and preventing stroke. A fuzzy cognitive map is one of the newest, most efficient and most well-known methods of artificial intelligence and it can be used to diagnose, predict, categorize and decide on diseases. It has the main features of the neural network and fuzzy logic [Citation3]. Fuzzy Cognitive Map (FCM) is provided as an alternative to display and study the behaviour of complex systems and human beings [Citation4]. The applications of the FCMs are widespread due to the ease of construction and use, flexibility in analysing and designing systems, adaptability, supporting uncertainty, simple modelling, non-time-consuming, and decision-making at a high level [Citation5]. FCMs are used as the most powerful tools in various scientific and industrial fields such as robotics, environment, military, political, computer sciences, engineering, expert systems, economics, etc. [Citation6–8]. There have been many studies in medicine over the past years using the fuzzy cognitive map and nonlinear Hebbian learning algorithm method. These studies have included the classification of the autism disorder [Citation9], modelling the Parkinson’s disease [Citation10], classification of breast lesions [Citation5,Citation11], and Grading celiac disease [Citation12]. In a previous study [Citation9], the onset of childhood autism was predicted with regard to 23 major factors of the disease, such as enjoy being swung, take an interest in other children, and climbing on things. NHL algorithm was used for increasing efficiency of FCM, as well as achieving the right answer and making the right decision. Finally, the disease was classified into 3 categories (definite autism, no autism, probable autism), and the system accuracy was reported by 79.9%. In another study [Citation10], Parkinson mathematical modelling was provided based on 6 main factors of the disease, such as tremor, rigidity, and posture. Then, the disease was classified into 6 stages (healthy, stage 1, stage 2, stage 3, stage 4, stage 5 and stage 6), the obtained results were compared and simulated with and without the use of NHL algorithm. In a study [Citation5], breast cancer classification was proposed using a two-level FCM, so that at the first level based on several risk factors (age of patient, family history, BMI, number of children, etc.), the degree of risk was classified into 3 groups (low, medium, and high) using NHL algorithm on 40 patients, and then the accuracy of NHL-FCM system of classification was evaluated using 2 standard models of viz. Gail and Tyrer-Cuzick. At the second level, also using 70 mammograms, 30 screening features and the Data -Driven Non-linear Hebbian Learning (DDNHL) algorithm were classified into 3 classes (normal, benign and malignant). Finally, the outputs of the two levels of FCM were integrated using expert rules. In this method, total accuracy was obtained by 94.3%. Also, in one study [Citation11], the classification of breast lesions was proposed based on 10 major histological features in 3 groups of UDH, ADH and DCIS on 86 cases. In this study, the accuracy of UDH classification was determined to be 88% and 86% for ADH and DCIS, respectively, UDH was considered as a benign lesion, and ADH and DCIS were considered as malignant lesions. And in another research [Citation12], celiac disease was graded as A, B1 and B2 among 89 cases considering 7 major determinant factors of the disease using FCM and Possibilistic Fuzzy C-Means (PFCM) clustering algorithm. NHL algorithm was used to increase functionality and accuracy of FCM classification. The accuracy obtained from this method was equal to 88.8% and 91% for A and B1 and B2, respectively.
For the first time, this paper presents prediction about the probability occurrence of ischemic stroke based on controllable symptoms proposed by neurologists using fuzzy cognitive maps and Nonlinear Hebbian Learning algorithm (NHL). The nonlinear Hebbian learning algorithm is a learning method based on the Hebbian rule [Citation13], which is used to train the FCM model and help to predict the risk rate of stroke. The risk rate of stroke has been identified on three different levels (low, medium, high) for every individual over the next 5 years. The obtained results are compared with the mean opinion of certain neurologists and also comparison between the results with and without the nonlinear Hebbian learning algorithm provided. Finally, the overall accuracy of the proposed method is calculated and compared with the Support Vector Machine (SVM) and K-Nearest Neighbours (KNN) classifiers. By simulating the behaviour of several neurologists, the proposed method is expected to have a better performance than one individual neurologist. This paper is composed of the following sections: Section 2 defines the fuzzy cognitive map. In Section 3, the non-linear Hebbian learning algorithm is explained for learning FCM. In Section 4, the definition of stroke and the construction and development of an FCM model is provided to predict the risk rate of stroke. Finally, in Section 5, the simulation results and the evaluation of the method have been presented. Section 6 concludes the paper.
2. Fuzzy cognitive maps
Fuzzy cognitive map is one of the methods of soft computing that is always attempted to imitate the knowledge and reasoning of the experts. It was first introduced by Kosko in 1986 as a fuzzy-signed directed graph with feedback loops and it can describe the behaviour of a complex system in the form of several concepts. An FCM consists of a collection of concepts/factors and weighted arches which are connected between the concepts; and every concept or factor is a major component of the system and is denoted by , where i = 1, … ,N (N is the number of all concepts). The relations between the concepts of
and
are determined by the weights
, which reflect the degree of their causative effects. The weights are calculated through converting fuzzy values which have been determined by experts to numerical quantities and included in the interval [−1, 1]. What relationship exists between the two concepts is shown by
, such that if
, it shows a positive or direct relationship between two concepts. If
, it shows a negative or indirect relationship between two concepts; and if
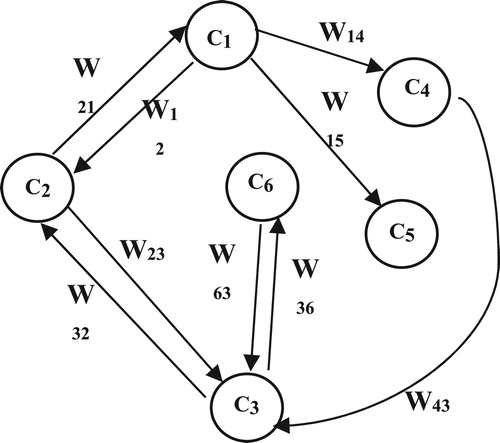
, it shows that there is no relationship between the two concepts. A simple FCM model has been shown in Figure , which has six factors and nine weighted arches. The values of each concept at each simulation step are obtained using Equation (1) in which
is the value of each concept,
in the (k + 1) is the step of simulation, and
is the value of each concept,
in the k-th step.
(1)
(1)
is a sigmoid threshold function which maps the results in the interval [0, 1] and is usually used in the Equation (2). Here, ψ ≥ 0 is the parameter that determines the slope of the function. The value of
in all the experiments is considered 0.5. All values are computed and the process is continued until the FCM converges to a constant state after several iterations [Citation3,Citation14–15].
(2)
(2)
Figure 1. A simple FCM with 6 factors.
3. Non-linear Hebbian learning algorithm
Non-linear Hebbian learning algorithm is probably the best-known unsupervised learning algorithm theory in relations which was suggested by Papageorgiou in 2003 [Citation9,Citation16]. The NHL learning algorithm improves FCM performance by adjusting the initial weights properly. The mathematical equations used in the NHL algorithms for learning FCM are presented in Equations (3) and (4). These formulas express the concepts and weights values in the FCM model.
(3)
(3)
α is a positive learning parameter and is determined by the trial and error method to optimize the final solution. Equation (4) is the modified and adjusted version of Equation (3) and is considered as the main NHL equation for our FCM model as follows:
(4)
(4)
here
is the updated weight at the Kth iteration step. β is the learning parameter of weight reduction. In the NHL algorithm, the upper and lower limits of the parameters α and β are determined by trial and error. These two learning parameters quickly guarantee the convergence to the optimal state. After conducting a lot of simulations, we observe that the large value of α makes significant changes in weights with frequent changes in their signs. Moreover, simulations with small β also makes significant changes in weights, and consequently, prevents FCM concepts from reaching the desired area. Therefore, the values of α and β are limited to the intervals 0 <α < 0.1 and 0.9 < β < 1, respectively, and the corresponding values are obtained for each problem after simulation.
The NHL algorithm continues until the termination conditions are met. Two termination conditions have been proposed for the NHL algorithm. The first termination condition is the minimization of the function, which consists of the decision concept, and it is considered by the specialists as the Decision Output Concept (DOC) and is considered as the following equation.
(5)
(5)
is the mean value of
. This type of function is suitable for NHL algorithms used in FCMs. In each stage, the
function calculates the Euclidean distance
and
. Assume that
.
is determined as follows:
(6)
(6)
If we consider an FCM model that has m to DOCs. We can calculate the by obtaining the sum of squares of the difference between m-DOCs and m-Ts as follows:
(7)
(7)
The objective is to obtain the
minimum for a set of weights. By minimizing
, the optimal balance point between FCMs and updated weights
can be achieved. The second termination condition is based on successive changes in the values of the concepts
for the kth iterations step and is considered as follows:
(8)
(8)
Where, € is a value constant. When the changes between two successive values of are less than this €, continue the training is meaningless for the system. When the algorithm ends and the final weight matrix, WNHL, is obtained.
If the termination conditions are not met after 1000 iterations, specialists are asked to re-design a new FCM, and then the steps above are repeated for the new weight matrix and the reconstructed FCM model [Citation12,Citation17–18].
4. Definition of stroke and the method for constructing FCM to predict the risk of ischemic stroke
After heart disease, stroke is the second major cause of mortality in the world and it is one of the main causes of motor, cognitive and neurological disabilities [Citation19]. The most common type of stroke is the ischemic stroke, which accounts for over 85–90% of all strokes and it has been caused by the closure of an artery with a blood clot [Citation2,Citation20]. There are many factors that play a role in stroke, which can be divided into controllable and uncontrollable factors. Genetic factors (family history), blood disorders, high age, metabolic diseases and gender are uncontrollable factors in stroke. Hypertension (high blood pressure), smoking, cardiac disorders such as disturbance in normal rhythms and heart valves, hyperlipidemia (high blood cholesterol), diabetes (high blood sugar), and obesity are controllable factors in stroke. The risk rate of stroke can be reduced by controlling and treating these factors [Citation21]. In fact, these Controllable Risk Factors (CRF) are the original concepts of FCM that are required in its design and implementation and play important roles in the occurrence of stroke. Neurologists consider these risk factors in the diagnosis of the stroke after a physical examination and observing the results of individual tests. These CRF were determined by three neurologists in this paper, i.e. Dr Rahim Mohammadzad, Dr. Ali Haghighat and Dr. Ali Asgharpour. They were collected from individuals who were referring to Amiralmomenin Hospital in Iran.
5. Simulation results of the proposed method
The cause–effect relationship between concepts was examined after determining the concepts or CRF. To this purpose, specialists/ neurologists were individually asked to determine the positive or negative effect of each concept on another concept (if any), as well as on the output concept with a causal fuzzy degree. In this method, each neurologist’s knowledge was represented as an FCM dynamic weight graph. Neurologists defined the relationships between concepts and justified their opinions. Each neurologist determined the effect of each concept on another, and then the degree of effect with the linguistic variables (low, medium, high, and very high, etc.) and then expressed it form the “if–then” fuzzy rules. Each linguistic variable belongs to the interval [0, 1].
Each linguistic variable belonged to the interval [0, 1]. Thus, any relationship was defined by a specialist with a fuzzy linguistic variable that correlated the relationship between the two concepts and determined the degree of causality between the two concepts. For example, a specialist indicated the causal relationship between the two concepts of and
with linguistic variables and using the fuzzy rules as follows:
If the value of the concept is A, then the value of the concept
is B, and therefore, the linguistic weight
is C. A, B and C are fuzzy linguistic variables [Citation9,Citation14].
As shown in Table , in this research, we used 6 fuzzy linguistic variables that include 2, 3, or 4 fuzzy sets. For example, for the concept of blood pressure, four linguistic variables (low, medium, high, and very high) were used. The low linguistic variable was considered less than 130, the medium between 131 and 150, high between 151 and 170 and very high more than 171.
Table 1. FCM model factors for prediction of ischemic stroke.
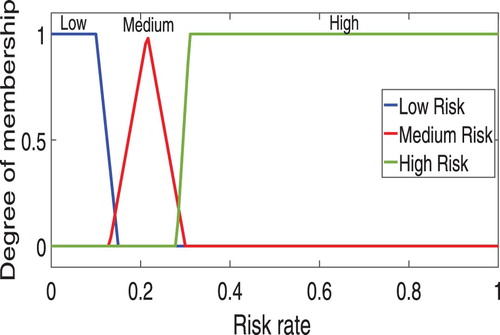
There are several methods for converting fuzzy linguistic variables because using triangular and trapezoidal membership functions in the medical context is more common than other membership functions [Citation5,Citation11–12]. The present study used triangular and trapezoidal membership functions, such that the membership functions of the output concept of risk rate is shown in Figure . Neurologists usually are not unanimous on the effect of some concepts on each other. Therefore, in order to achieve a final linguistic weight, three linguistic variables proposed by each neurologist was combined and then, through the defuzzification method, the centre of area of a general linguistic weight is created.
Figure 2. Membership functions of output concept (C7).
The advantage of this method is that neurologists do not use numerical values to define causal relationships among concepts, but qualitatively describe the causality degree among the concepts. The fuzzy rule is evaluated for each interconnection using the fuzzy inference and the inferred fuzzy weight is calculated using the centre of area defuzzification methodology and the FCM initial weight matrix is obtained [Citation3,Citation12]. The following example is presented to illustrate how the numerical values of the weights proposed by the neurologists are obtained:
Three neurologists defined the relationship between the concept of C2 (cholesterol) and C7 (risk rate) using fuzzy rules as follows:
First neurologist: If the blood cholesterol (C2) is low, then the risk rate (C7) is low.
Second neurologist: If the blood cholesterol (C2) is medium, then the risk rate (C7) is medium.
Third neurologist: If the blood cholesterol (C2) is medium, then the risk rate (C7) is medium.
Figure 3. Sum of the three linguistic variables suggested by neurologists for the concept of blood cholesterol (C2) and obtaining numerical weights by defuzzification using the centre of area method.
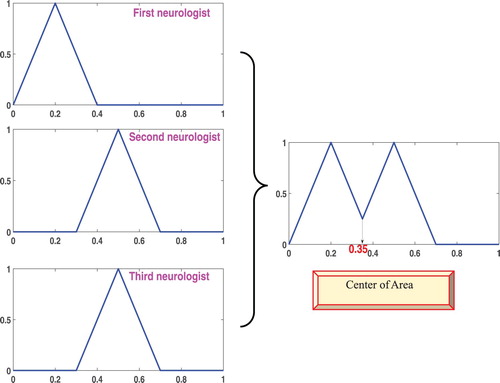
Figure 4. FCM model for predicting the risk of ischemic stroke with numerical values of the initial weights.
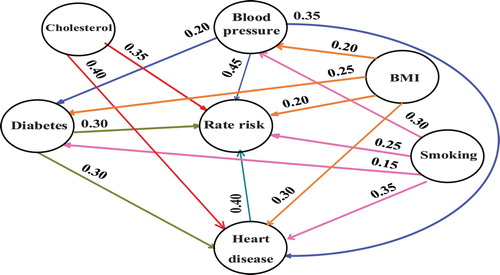
Table 2. Initial weights values,  , proposed by neurologists.
Six CRF in the occurrence of stroke are taken into account in this study by the neurologists for designing the FCM model as the input concepts and the concept of (C7) as the output concept that indicates the risk rate of stroke. The output decision concept (C7) as a variable of the fuzzy set is defined as “low”, “medium” and “high” and according to the neurologist’s opinions it can be considered as: 0 ≤ low ≤ 0.15, 0.16 ≤ medium ≤ 0.32, 0.33 ≤ high ≤ 1. In generally the neurologists’ knowledge has been used in labelling the dataset, determining the input and output concepts, designing the model of the FCM and obtaining the initial weight matrix.
To explain the issue, here are two examples of test data. Example 1: In this example, a person with Blood pressure (170), Cholesterol (240), Blood sugar (95), Heart disease (No), Smoking (Yes) and BMI (27.3) has been examined. Neurologists predict the risk of stroke for this person as “medium”.
According to the mentioned equation in [Citation5] these values are normalized in the interval [0,1] and obtained as: CInitial = [0.47 0.51 0.13 0 1 0.37 0.1]. These values of the concepts and the initial weight matrix which have been shown in Table are updated in accordance with the Equation (1) so that FCM reaches a stable point. As shown in Table , the values of FCM concepts do not change after seven iterations, which indicate its steady state. As it can be observed, the value of DOC reaches to 0.67217. This gives a risk of 34.4% according to the equation in [Citation22], and it is a high risk according to the neurologists. Therefore, the nonlinear Hebbian learning algorithm is used to adjust the relations between the factors so that the system response approaches the real value. As shown in Figure which is the diagram of the sequence of the values of concepts up to convergence.
Figure 5. Subsequent values of concepts till convergence without applying NHL algorithm.
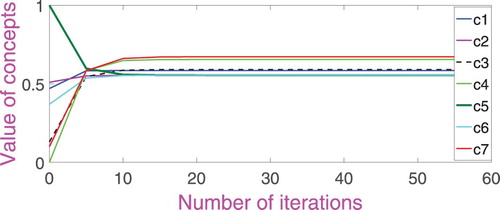
Table 3. Values of FCM concepts at 7 iterations.
When the training process is started, the initial values of the concepts and initial weights are updated according to Equations (1) and (4) to achieve desired and steady conditions, respectively. The updated weight matrix for this example is given in Table . The NHL algorithm continues until the two termination conditions achieve the values of 0.1 and 0.001 according to Equations (7) and (8). Here the learning rate is equal to 0.001 and the parameter value β is equal to 0.98.
Table 4. Updated weight matrix with NHL algorithm for the first example.
After applying the training process for the above example, the value of DOC or risk rate of stroke reaches 0.5991 after 47 iteration steps, indicating a risk level of 20%, which according to neurologists are considered as a medium risk and is belonged to the “0.16 ≤ medium ≤ 0.32” range.
Example 2: In this example, a subject with Blood pressure (140), Cholesterol (190), Blood sugar (90), Heart disease (No), Smoking (Yes) and BMI (22) was examined. Neurologists predict the risk rate of stroke for this person as “low”. The values of the above concepts are normalized as: CInitial = [0.25 0.34 0.11 0 1 0.16 0.1]. After simulation by the proposed tool FCM, the initial values are obtained as: CFCM = [0.55313 0.5347 0.55705 0.59751 0.5347 0.5347 0.60818]. As it can be observed, the value output concept or risk rate of stroke converges to 0.60818 after seven iterations, indicating a risk rate of 21%. By applying the non-linear Hebbian learning algorithm, the system response is close to real value and the decision is acceptable and correct.
As shown, after applying the training process, after 23 iteration steps, the value final concept, CFinal, reaches 0.5646, which is indicating a risk rate of 0.12, which is a low risk according to neurologists and is in the “0 ≤ low ≤ 0.15” interval.
5.1. Evaluation of the proposed method performance
Fifteen-fold cross-validation method was used for the evaluation of the performance of the proposed method for 90 real cases. In this method, 14 data sets were considered for training and one data set for testing. The accuracy and recognition rate for test data are calculated at every run. After 15 iterations, the overall accuracy of the algorithm is resulted by the mean of the accuracies is achieved by (95.4 ± 7.5)%. Table shows the accuracy and recognition rate of algorithm iteration. Table shows the comparison of the neurologist’ opinions with proposed FCM for algorithm last step. In Figure , the results of the output values of the proposed FCM are applied, which are shown for the entire dataset after the NHL. Also for better comparison, the data, used in this paper, are classified by utilizing SVM and KNN. Free parameters of SVM, such as kernel length (C), were tuned by nested cross-validation method. Table shows the accuracy and recognition rate in each algorithm iteration for the SVM classifier. In addition to SVM, in order to further ensure the accuracy of the proposed system, KNN classifier was also used. KNN classifier is one of the traditional classifiers used for machine learning, classifying a specific sample of the data of this classifier, so that K finds a sample closer to the data and acts on the basis of voting. So, each of those neighbours will regard those particular data as members of their class. Usually, Euclidean distance criterion is used to find the nearest sample K. The value of K is equal to 10 [Citation23,Citation24]. Table shows the accuracy and recognition rate in each algorithm iteration for the KNN classifier. The numbers showed in Tables , , and indicate that the proposed NHL-FCM model outshined SVM and KNN classifiers in term of accuracy as well as recognition rate.
Figure 6. Results of output values FCM for all people data after application of NHL.
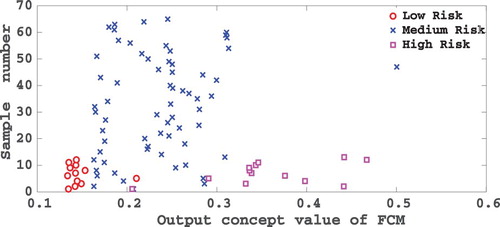
Table 5. The proposed NHL-FCM method evaluation results in 15 iterations.
Table 6. Comparison of the neurologists’ opinions with proposed model FCM for algorithm last step.
Table 7. The method evaluation results with the SVM classifier in 15 iterations.
Table 8. The method evaluation results with the KNN classifier in 15 iterations.
6. Conclusion
Since rapid diagnosis and urgent treatment of stroke are essential, and the rapid diagnosis increases the chance of survival and recovery of the patient after treatment, and protects the patient from injuries and complications of the severe strokes, this paper predicted the risk of ischemic of stroke (the most common type of stroke) with regard to CRF over the next 5 years using fuzzy cognitive maps and nonlinear Hebbian learning algorithm. To this end, the results obtained from method performance was compared with the opinions of the three neurologists. The overall accuracy obtained using the NHL-FCM method for 90 actual data is compared with those of the SVM and KNN classifiers. The results indicate that our proposed model has secured an accuracy of (95.4 ± 7.5)%, which is higher than that of SVM and KNN. The purpose of this study is not to implement the system, but to use a predefined system and extend it to a new area in order to extract new knowledge in the field of stroke disease. Until now, no other paper has proposed the use of fuzzy cognitive maps for the classification of stroke patients. In other words, using this tool is for a superior purpose, which is the same as helping to extract knowledge in the field of diagnosing and predicting of stroke. The results of our research show that the proposed method is very close to opinions of the neurologists and is capable of predicting the risk rate of stroke over the next 5 years. Also, it can be said that FCM is a reliable and flexible decision-making support system for neurologists. So the paper that we wrote is the beginning of a long way of solving both of these problems.
Disclosure statement
No potential conflict of interest was reported by the authors.
ORCID
Keivan Maghooli http://orcid.org/0000-0003-0980-0154
Amir Hooshang Mazinan http://orcid.org/0000-0002-8810-9574
References
- Hosseininezhad M, Hatamian H, Bakhshayesh-Eghbali B, et al. A survey about the temporal pattern of stroke occurrence. Caspian J Neurol Sci. 2015;1:15–19. doi: 10.18869/acadpub.cjns.1.2.15
- Deb P, Sharma S, Hassan KM. Pathophysiologic mechanisms of acute ischemic stroke: an overview with emphasis on therapeutic significance beyond thrombolysis. Pathophysiology. 2010;17:197–218. doi: 10.1016/j.pathophys.2009.12.001
- Amirkhani A, Papageorgiou EI, Mohseni A, et al. A review of fuzzy cognitive maps in medicine: taxonomy, methods, and applications. Comput Methods Programs Biomed. 2017;142:129–145. doi: 10.1016/j.cmpb.2017.02.021
- Salmeron JL. Supporting decision makers with fuzzy cognitive maps. Res Technol Manage. 2009;52:53–59. doi: 10.1080/08956308.2009.11657569
- Papageorgiou EI, Subramanian J, Karmegam A, et al. A risk management model for familial breast cancer: a new application using fuzzy cognitive map method. Comput Methods Programs Biomed. 2015;122:123–135. doi: 10.1016/j.cmpb.2015.07.003
- Salmeron JL, Palos PR. Uncertainty propagation in fuzzy grey cognitive maps with Hebbian-like learning algorithms. IEEE Trans Cybern. 2017;49:1–10.
- Papageorgiou EI, Salmeron JL. A review of fuzzy cognitive maps research during the last decade. IEEE Trans Fuzzy Syst. 2013;21:66–79. doi: 10.1109/TFUZZ.2012.2201727
- Salmeron JL, Mansouri T, Sadeghi Moghadam MR, et al. Learning fuzzy cognitive maps with modified asexual reproduction optimization algorithm. Knowl Based Syst. 2019;163:723–735. doi: 10.1016/j.knosys.2018.09.034
- Kannappan A, Tamilarasi A, Papageorgiou EI. Analyzing the performance of fuzzy cognitive maps with non-linear Hebbian learning algorithm in predicting autistic disorder. Expert Syst Appl. 2011;38:1282–1292. doi: 10.1016/j.eswa.2010.06.069
- Anninou A, Groumpos PP. Modeling of Parkinson’s disease using fuzzy cognitive maps and non-linear Hebbian learning. Int J Artif Intell Tools. 2014;23:1–17. doi: 10.1142/S0218213014500109
- Amirkhani A, Mosavi MR, Naimi A. Unsupervised fuzzy cognitive map in diagnosis of breast epithelial lesions. 22nd Iranian Conference on Biomedical Engineering, Tehran, Iran; November 2015, p. 115–119.
- Amirkhani A, Mosavi MR, Mohammadi K, et al. A novel hybrid method based on fuzzy cognitive maps and fuzzy clustering algorithms for grading celiac disease. Neural Comput Appl. 2016;30:1573–1588. doi: 10.1007/s00521-016-2765-y
- Stach W, Kurgan L, Pedrycz W. A divide and conquer method for learning large fuzzy cognitive maps. Fuzzy Sets Syst. 2010;161:2515–2532. doi: 10.1016/j.fss.2010.04.008
- Papageorgiou EI, Spyridonos P, Glotsos D, et al. Brain tumor characterization using the soft computing technique of fuzzy cognitive maps. Appl Soft Comput. 2008;8:820–828. doi: 10.1016/j.asoc.2007.06.006
- Salmeron JL, Rahimi S, Navali A, et al. Medical diagnosis of rheumatoid arthritis using data driven PSO-FCM with scarce datasets. Neurocomputing. 2017;232:104–112. doi: 10.1016/j.neucom.2016.09.113
- Papageorgiou EI, Stylios CD, Groumpos PP. Fuzzy cognitive map learning based on nonlinear Hebbian rule. Proceedings Australasian Conference on Artificial Intelligence, Berlin; 2003, p. 256–268.
- Vassiliki M, Groumpos PP. A revised approach in modeling fuzzy cognitive maps. Proceedings 24th Mediterranean Conference on Control and Automation, Athens, Greece; 2016, p. 350–354.
- Papageorgioua EI, Stylios C, Groumpos PP. Unsupervised learning techniques for fine-tuning fuzzy cognitive map causal links. Int J Hum Comput Stud. 2006;64:727–743. doi: 10.1016/j.ijhcs.2006.02.009
- Baghbanian SM, Ramezani M, Abedini M, et al. Difference between risk factors of common ischemic brain strokes on anterior and posterior circulation. J Mazandaran Med Sci. 2013;23:49–54.
- Zweifler RM. Initial assessment and triage of the stroke patient. Prog Cardiovasc Dis. 2017;59:527–533. doi: 10.1016/j.pcad.2017.04.004
- Arboix A. Cardiovascular risk factors for acute stroke: risk profiles in the different subtypes of ischemic stroke. World J Clin Cases. 2015;3:418–429. doi: 10.12998/wjcc.v3.i5.418
- Groumpos PP, Anninou AP. A theoretical mathematical modeling of Parkinson’s disease using fuzzy cognitive maps. IEEE 12th International Conference on Bioinformatics & Bioengineering, Cyprus; 2012, p. 677–682.
- Moosavian A, Ahmadi H, Tabatabaeefar A, et al. Comparison of two classifiers; K-nearest neighbor and artificial neural network, for fault diagnosis on a main engine journal-bearing. Shock Vib. 2013;20:263–272. doi: 10.1155/2013/360236
- Chen HL, Huang CC, Yu XG, et al. An efficient diagnosis system for detection of Parkinson’s disease using fuzzy k-nearest neighbor approach. Expert Syst Appl. 2013;40:263–271. doi: 10.1016/j.eswa.2012.07.014