
 ?Mathematical formulae have been encoded as MathML and are displayed in this HTML version using MathJax in order to improve their display. Uncheck the box to turn MathJax off. This feature requires Javascript. Click on a formula to zoom.
Abstract
This study aims to examine the possibility and impact of utilizing data science on blood samples to rapidly and proactively identify underlying health issues. By utilizing effective algorithms, models will be constructed to address these problems and determine potential healthcare options based on geographical location. Once data is gathered, health officials will be notified of major diseases and individuals at risk or already affected. Authentic blood samples are used to ensure the credibility and validity of the proposed system. The data was collected during a volunteer-led hemoglobin blood test camp specifically for women residing in impoverished areas, resulting in a total of 551 samples. The effectiveness of this technique has been assessed through experimental results based on Hb, RDW%, MCV, RBC, and M-Index. The proposed data analysis and deep learning algorithm achieved average values of haemoglobin count 11.67 g/dL with a 1.33 standard deviation, RDW 14.59%, MCV 81.45, RBC 4.37 per microliter with a variance of 0.5, and M-Index 19.56. The experimental results achieved 97.60% accuracy, demonstrating the effectiveness of the proposed technique for classifying anemia and its subtypes. The experimental results indicate better overlap between the automated identification of anemia and manual detection by the experts.
1. Introduction
In healthcare, the combination of medical diagnostics and cutting-edge technology has revolutionized how we detect and improve patient outcomes. One research area of study focuses on using deep learning techniques to analyze blood samples to detect Anemia, a commonly misdiagnosed blood disorder [Citation1,Citation2]. Timely detection and appropriate treatment are crucial steps in curing Anemia, as it can lead to significant health risks if left untreated. Symptoms like fatigue, weakness, and shortness of breath are critical indicators of Anemia, typically caused by low hemoglobin levels or a deficiency in red blood cells. Traditionally, hematologists or clinical experts would manually examine blood samples for Anemia, and the process was time-consuming and prone to human error [Citation3,Citation4]. However, recent developments in Information Technology and e-healthcare systems, driven by artificial intelligence and deep learning, have transformed the field of medical diagnostics [Citation5–9].
With the arrival of this new era, a large amount of collection of blood samples can be utilized to train algorithms that rely on neural networks or other systems rooted in learning. The assessment of these blood samples can now be completed in a fraction of the time. This innovative technology, particularly pattern recognition, has the potential to significantly enhance the efficiency and precision of detecting and diagnosing anemia [Citation10,Citation11].
This study attempts a serious dominion of data analysis of blood samples using advanced methodologies based on deep learning with a distinct focus on identifying Anemia. The blood samples consist of a vast repository of information; by exploiting that information, we look to develop a robust mechanism capable of not only detecting and identifying the presence of Anemia but also sensing valuable information on different subtypes and severity levels [Citation12–15].
The analysis process is fully automated, and the blood samples are not taken from pre-existing datasets. Instead, they are collected near Nagpur city in Maharashtra state, India. In Nagpur, a non-governmental organization (NGO) called Youth for Seva. Its primary objective is to motivate and engage young individuals in volunteering activities, providing them with meaningful opportunities to contribute to their community. With the assistance of a local hospital, Youth for Seva organized a blood donation camp in an underprivileged area near Shukrawari Lake in Nagpur. The reason for selecting the Shukrawari Lake area in Nagpur is, this locality has many underprivileged communities, and our work primarily focuses on detecting and classifying anemia and its subtypes in the underprivileged area. A total of 551 samples were collected: 384 (70%) were used for training, and the remaining were used for testing the algorithm. These samples are enough for training and testing the algorithm and validating the performance of the proposed system. This initiative allows government authorities to gain insight into the health situation in that specific vicinity, enabling them to take appropriate action as necessary.
Typically, laboratories are supervised by clinical experts or hematologists; they collect the donor's Age and Sex information. They extract essential attributes of the blood such as hemoglobin count, Red Blood Cell count, Red Cell Distribution Width percentage, Mean Corpuscular Volume, and Mentzer index from the provided blood samples.
Gathering this data, understanding how these constituents of blood, and applying data science to it will reduce the time health professionals need to take appropriate actions in providing adequate care under government schemes.
Constituents of blood-related to different illnesses and identification of localities, comprising of people with different immunities, results in a machine learning model which can target a locality in a time of need [Citation16]. An NGO can set up a blood donation camp, which can quickly fulfil the requirement.
The entire process is highly straightforward and streamlines the diagnostic process with deep learning, thus enabling swift and precise identification of Anemia in a diverse patient population. Furthermore, the self-operating nature of deep learning models brings down the dependence on manual processing by clinical experts or hematologists and thus improves the accuracy of the Anemia diagnosis and is within the time frame, and thus offers significant aid to the healthcare [Citation17–19].
The research also aims to develop an accurate anemia and subtype detection system. It utilizes deep learning-based YOLO techniques, specifically a deep learning-based YOLO model for detection and classification. The ultimate objective is to improve the classification accuracy of anemia and subtype detection, thereby enabling early prediction and potentially saving human lives. This paper addresses one of the most underprivileged areas in Nagpur, India, locality, and its findings can encourage the development of a similar solution to other geographic locations or populations.
The core objective of this study is to integrate the power of automation through advanced technology such as deep learning models, fine-tuning them to handle the variation of blood sample data, identifying the severity levels for Anemia and other subtypes of diseases, and validating the efficacy of our proposed system through rigorous testing and analysis [Citation20,Citation21]. The ultimate aim is to devise a solution for one of the life-threatening diseases using the intersection of healthcare and artificial intelligence, with a substantial impact on the early detection, classification, and identification of Anemia.
2. Related works
Anemia is a severe disease that poses a threat to life and contributes to the development of many other diseases. In addition to Anemia, individuals with this illness may also be susceptible to other blood-related diseases. To successfully address this issue, it is crucial to identify the disease in its early stages, helping healthcare professionals to recommend appropriate treatments. However, a traditional manual detection method is time-consuming and inaccurate. Fortunately, numerous researchers have offered advanced technologies that streamline blood sample collection and enable timely and precise disease detection.
Zhao et al. [Citation19] investigated the machine learning-based system for predicting COVID-19 disease and Pneumonia patients. Different machine learning algorithms such as Random Forest, XGBoost, Logistic regression, and deep learning neural networks were employed for the severity prediction. Detailed statistical analysis and feature interpretation were utilized to understand the relationship between clinical variables and disease outcomes. The results in terms of clinical indicators are promising and may help doctors predict the progression and spread of COVID-19 and other types of pneumonia.
A simple paper-based technique measuring blood hemoglobin is investigated by Xiaoxi Yang et al. [Citation22]. A 20 μL droplet of a mixture of blood and Drabkin reagent was deposited, and the resulting bloodstain was digitized for further analysis. The bloodstain colour intensity was used to measure Hb. A total of 54 subjects were analyzed, and the performance of the paper-based Hb with a hematology analyzer was compared. Detection of DNA damage from the blood samples was proposed by Kristina Schulze Johann et al. [Citation23]. They calculated the degradation index (DI) to assess DNA quality.
Vijayarani and Sudha [Citation24] performed the prediction of various diseases from hemogram blood samples using data mining techniques. They employed a weight-based K- K-means algorithm for classifying leukemia, bacterial, HIV infection, inflammatory, and pernicious anemia. The detailed analysis of Fuzzy C-means and K-means clustering with the proposed weight-based K-means algorithm is also evaluated. Eric Boersma et al. [Citation25] suggested a study to identify the acute risk of coronary syndrome. The detailed evolution of blood biomarkers has been studied for patients with post-acute coronary syndrome. A total of 844 patients’ data is used for the analysis, and clinical observations have been performed over a certain period.
The base of this entire study started after the collection of blood samples. The main problem is identifying suitable and willing donors and collecting the blood samples. A blood transfusion is performed to ensure the blood is free from any infection. Ahdan and Setiawansyah [Citation26] devise a solution to this problem. The advancement of information technology is integrated with the geolocation system and use the Dijkstra algorithm to find the closest route for finding blood banks and donors. The system can identify and recommend the donors according to the patients’ qualifications (specific requirements). Hai Trieu Le et al. [Citation27] also investigated the same BloodChain system using blockchain technology.
Lamia Alhazmi [Citation28] introduces a novel method exploiting a deep learning approach to identify white blood cells (WBC), red blood cells (RBC), and platelets in blood samples. In the diagnosis process of most diseases, the initial step is a blood test, allowing for the evaluation of various quality measures for finding the root cause of the disease. However, manual detection may lead to inaccuracies and be time-consuming. The proposed study offers a significant integration of technology that enables the automatic detection of cells in blood samples. Through specific proposed training of the model, they achieved reliable results, with 100% accuracy in counting WBC, 89% in RBC, and 96% in platelets.
A detailed literature review has been done, and its core finding is summarized in Table .
Table 1. Summary of literature review.
3. Materials and methods
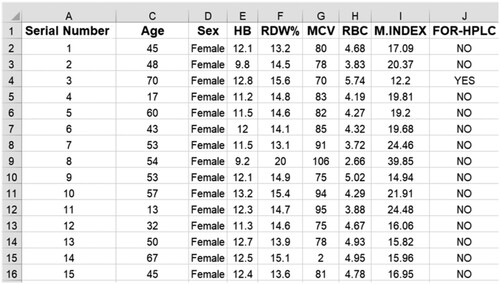
This section presents the materials, the source of the blood samples, and the algorithm used to detect and classify Anemia. Figure provides the flow diagram of the algorithm. Data was collected during a volunteer-run hemoglobin blood test camp for women living in impoverished areas, organized in cooperation with a nearby non-governmental organization (NGO). Five hundred fifty-one women and 130 men took part in the campaign. Figure shows some of the sample data used for testing the algorithm. The gathered data was then digitalized to be analyzed.
Figure 1. Steps used in proposed algorithm.
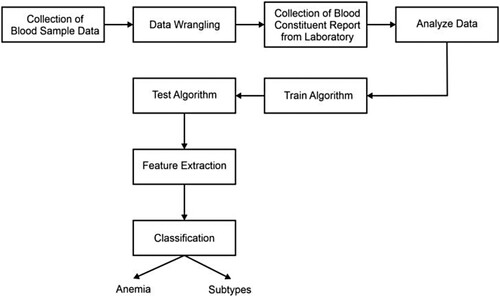
Figure 2. Sample data.
Several quality matrices become significant for assessing and interpreting the blood sample data for automatically detecting Anemia and its subtypes through deep learning techniques. How the entire dataset is distributed, its training model and its characteristics are easily understood using these quality matrices. They are a great help in the identification of probable anomalies or motifs correlated with Anemia and its subtype. The details about the quality matrices used in this study are discussed below.
Minimum value (min): This represents the lowest value in all the entity contexts used in the Anemia detection, such as age, hemoglobin count, red blood cells, RDW%, MCV, and M-Index. It evidences a crucial indicator and signifies the lowest point in the dataset distribution.
Maximum value (max): This represents the highest value in all the entity contexts used in Anemia detection, such as age, hemoglobin count, red blood cells, RDW%, MCV, and M-Index. It evidences a crucial indicator and signifies the highest point in the dataset distribution. It can also assist in identifying extreme or uncommonly high readings that might advocate other severe health issues or motifs in the data.
Average (mean): The central tendency and pattern of the data distribution in the dataset is provided employing average value. In the case of Anemia and its subtype detection, this could indicate and signify the average count of age, hemoglobin count, red blood cells, RDW%, MCV, and M-Index, thus giving a general idea of the “distinctive” value in the dataset.
Mode: Some of the values occurred frequently in the dataset; the mode is the value that signifies this repetitive pattern. In the context of the diagnosis of Anemia, how often the red blood cell count or hemoglobin level occurs is very important, and the mode is indicated the same for the dataset used.
Variance: The spread or dispersion of the data around the mean value is indicated by variance. In the case of Anemia and its subtype detection, the higher variance suggests the wide spread of the data points, and the low indicates clustered around the mean. Variance may suggest probable irregularities in the entity, such as age, hemoglobin count, red blood cells, RDW%, MCV, and M-Index across the dataset.
Standard deviation: The average amount of variation or dispersion of the data from the mean is indicated by the standard deviation parameter. In the case of Anemia and its subtype detection, the higher standard deviation may suggest a broader range of values, and the low suggests close to the mean, indicating probable irregularities in the entity such as age, hemoglobin count, red blood cells, RDW%, MCV, and M-Index across the dataset.
Any irregularities in the entity are easily accessed and identified through the quality matrices and could signal different stages, types, or levels of anemia. Moreover, understanding these quality matrices can assist in setting relevant thresholds in the diagnosis of anemia and also help to keep an eye on the efficacy of the model's predictions.
The experimentation is performed using an Apple MacBook M2 system equipped with 16 gigabytes of RAM and 256 gigabytes of storage. The software environment utilized Python 3 and Microsoft Excel 2019 for data processing and analysis.
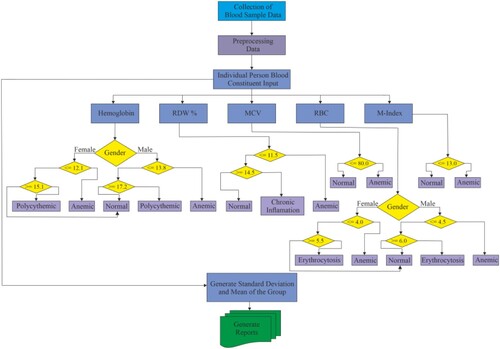
The detailed experimentation operation with the different quality parameters is shown in Figure followed by its summarization.
Pre-processing Data
Convert the collected data from Excel to CSV containing blood constituents.
Format the data and handle the missing values.
Data Analysis of the collected data
Calculate statistical metrics for each blood constituent in the dataset, such as mean, median, and standard deviation.
Define acceptable thresholds (lower and upper) for each constituent, which can be based on medical standards or local population averages.
Identify Locality-Wide Deviations
Compare the calculated statistics with the defined thresholds.
Identify constituents that deviate significantly from the expected range for the entire locality.
Generate reports or alerts for constituents with notable deviations.
Data Analysis for Individuals
For each individual in the dataset, calculate their blood constituent values.
Compare individual values with the established thresholds.
Identify Individual Deviations
For each individual, identify constituents with values outside the expected range.
Generate individual health reports highlighting deviations and indicating potential health issues.
Visualization
Create visualizations to represent data for easier understanding.
Output and reporting
Generate reports for the entire locality's health profile, including identified issues.
Generate individual health reports for each person in the dataset.
Alerting System (optional)
Implement an alerting system to notify healthcare providers or individuals when significant deviations are detected.
Regular Updates
Set up regular data updates to ensure the analysis is based on the most recent data.
Figure 3. Experimentation process.
3.1. Classification
Classification is executed to extract vital information and findings from medical images. The classification achieves higher accuracy and gives valued information about the affected area by the diseases [Citation42]. The classification complexity reduction and improvement in accuracy are noticed with the help of proper acquisition, feature extraction (extraction of quality matrices), and feature optimization (unnecessary in case only a few features or quality matrices are extracted). The suggested classification process is shown in Figure .
Figure 4. Process of classification.
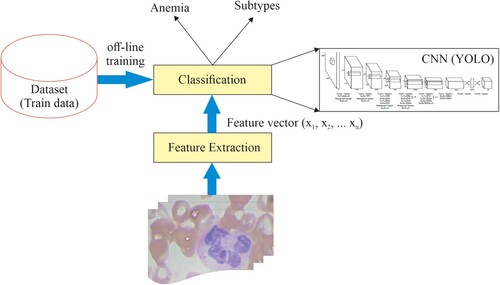
Popular classification techniques such as support vector machine (SVM), random forest (RF), Self-organizing map (SOM), and principal component analysis (PCA) classifiers are unable to support low-resolution images. Earlier work has shown that these classifiers are computationally complex and require significant time for convergence when working on larger datasets. These limitations are resolved by using the YOLOv6-based classification method [Citation43], which is proposed in this paper.
Machine learning and deep learning techniques have gained significant popularity for tumour classification. Most of these methods involve the first step of learning from training models developed from annotated images of large datasets, where they learn about features and patterns of infected tissues. CNN-based architectures such as YOLO and SSD (Single Shot Detector) have shown promising results in brain tumour detection.
Computer vision applications use the well-known object detection algorithm YOLO. It is renowned for its real-time performance and speed. YOLO breaks up an input image into a grid of cells, using which multiple bounding boxes and class probabilities for the objects in each cell are predicted. Steps to detect objects using YOLO:
Obtain a blob from the image since we require fixed-size input.
Store the various layers extracted using YOLO in a variable.
Forward the variable to the YOLO network and then receive the output.
Store the output in the layer output variable.
The dataset is trained for 160 Epochs with the input image size 224 × 224 and 0.1 as the initial learning rate for the training purpose. During the training process, standard data increment methods are used. Then, the fine-tuning of the network is considered using a 448 × 448 image size with the initial learning rate changed to 0.001 for 30 epochs, and the training is performed ten times.
The detection and identification often require fine-grained visual information; for this purpose, the network's input resolution has been increased from 224 × 224 to 448 × 448. The model YOLOv6 adjusts its filter to perform better on higher-resolution images, so it uses a higher resolution 448 × 448 input instead of 224 × 224. The accuracy on 224 × 224 images was calculated and achieved 93.41% (156 samples out of 167 samples detected correctly) and was taken at 6.26 s, whereas the same images on 448 × 448 resolution gave 97.60% (163 samples out of 167 samples detected correctly) accuracy and were taken at 3.05 s. This approach increased the accuracy by 4% after training for 30 epochs.
Our final layer effectively forecasts both class probabilities and bounding box coordinates. A linear activation function is employed for the final layer, and leaky rectified linear activation shown in (1) is used for all other layers.
(1)
(1) The YOLO algorithms are strong enough to handle multi-class classification. Image or object detection consists of two tasks:
Image classification
Object localization
Through the image classification algorithms, the type or class of an object is predicted. In contrast, object localization algorithms find the object in the image and represent it with a bounding box.
YOLO uses one of the best architectures of neural networks. Due to its simplicity, high accuracy, and high processing speed, YOLO has become a highly preferred object detection model. It predicts a class and the bounding box that defines the object's location on the input image. Each bounding box recognizes four members:
(bx; by) as the centre of the bounding box
(bw) as the width of the box
(bh) as the box height
In addition to this, it predict the corresponding number c for the predicted class and probability of the prediction (Pc).
For example, the image is divided into a grid, a 3 × 3 grid. Through the grid, it becomes easy to detect one object per grid cell compared to one object per image. In the next step, each grid cell is described by a vector. For example, in the case of brain MRI image, two classes are defined such as Normal and Abnormal, then it is described as:
Where Cr,c represents the corresponding grid cell, for example, the first cell from the 3 × 3 grid is represented as C1,1. Pc is the probability of the object class, bx and by are the coordinates of the centre of the bounding box, bh, and bw are the height and width of the bounding box relative to the entire image, and C1 and C2 are represented for the class, i.e. C1 for the “Anemia” and C2 for the “Subtypes”. The value of C1 and C2 is 0 and 1, depending on which class represents the bounding box. Algorithm (1) enlists various steps involved in implementing YOLOv6 for detecting and classifying brain tumours.
The YOLOv6 algorithm quickly accesses the trained data, even though it is also available in pretrained format. In our research, the classification is done to find two significant constraints: anemia and its subtypes. The classification algorithm performs the classification quickly and effectively if only relevant features are extracted and fed to the classifier for data analysis. Feature extraction brings more preciseness and clarity to the image, which defines the body's colour, texture, size, and edges. Feature extraction is crucial for reducing the classifier's complexity to classify an image's characteristics. Nearly 13 features were extracted from the blood samples. Through extensive analysis, it was found and observed that only five features are relevant and sufficient for detecting anemia and its subtypes. Table gives some valuable features required to analyze the blood samples, such as mean, standard deviation, Skewness, Kurtosis, and Homogeneity. Figure plots these prominent features for ten randomly selected images.
Figure 5. Plot of some prominent features.
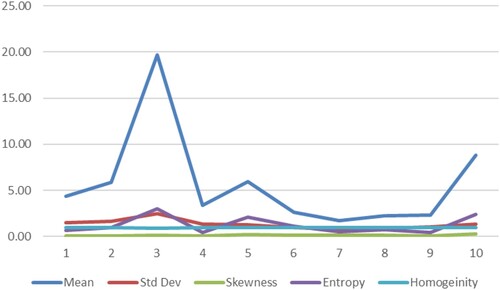
Table 2. Prominent features.
4. Results and discussion
As we age, a small change occurs in the blood's chemical composition. This aging process leads to a decrease in the total body water, resulting in a drop in the fluid content and blood volume. Additionally, evidence suggests a decrease in the production of red blood cells (RBCs) in response to disease or stress. A total of 551 female participants provided samples, ranging in age from 13 to 82 years. It was observed that the average age of the women at the camp was 49 years old. Most of the women in the camp have a mean age of 60 years, clustered around this age with a standard deviation of 17 years.
Data regarding age provides valuable insights into the socioeconomic status and demographic characteristics of the women residing near Juni Shukravari. It is worth mentioning that these women belong to the lower-income bracket and are facing economic hardships.
Table
Adult females: hemoglobin levels ranging from 12.1 to 15.1 g/dL.
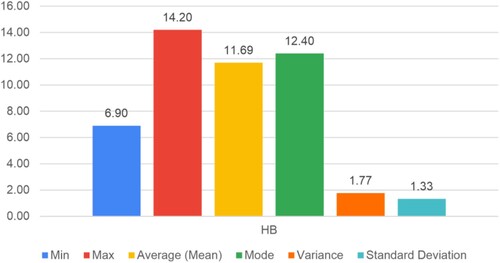
Figure shows the scatter plot between the age of the participants and their Hb count value. The investigation showed an average hemoglobin count of 11.67 g/dL, with a 1.33 standard deviation.
Figure 6. Age Vs Hb count.
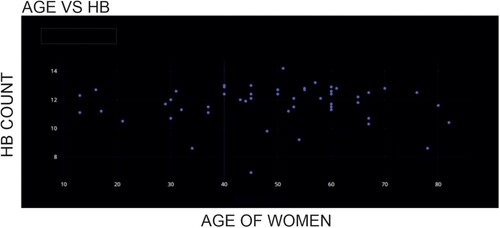
None of the women assessed had hemoglobin levels higher than 15 g/dL; the maximum amount measured was 14.2 g/dL (minimum: 6.9 g/dL). These results show that women in this location are more vulnerable to anemia, but they are less likely to be polycythemia-prone.
RDW (Red Blood Cell Distribution Width) is a measure that shows how variable the size of the red blood cells is inside a blood sample. Increased RDW% levels indicate increased variability in red blood cell sizes, which is linked to the emergence of several medical disorders, including different types of anemia. On the other hand, lower RDW% values are associated with particular diseases marked by an abnormal consistency in red blood cell size.
Figure shows the scatter plot between the age of the participants and their RDW% value. The analysis showed that the RDW (in percentage) value ranges from a minimum of 12.3% to a maximum of 21.3%, with an average value of 14.59%.
Figure 7. Age Vs RDW% value.
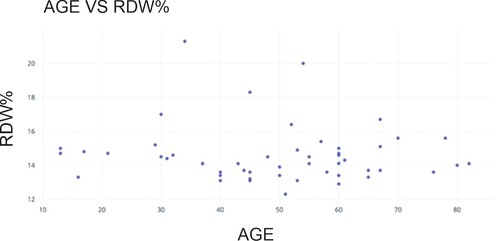
High RDW% results can be used as a proxy for several medical disorders other than anemia, such as persistent inflammation and certain vitamin deficiencies. This test allows participating healthcare facilities to identify at-risk patients sooner and possibly prevent medical emergencies.
The average size or volume of red blood cells in a specific blood sample is determined by measuring the mean corpuscular volume (MCV).
Figure shows the scatter plot between the age of the participants and their MCV value. The mean MCV value was determined to be 81.45, indicating that the MCV measurements for all female participants fell within the defined reference range, with a recorded minimum of 2 and a maximum of 106.
Figure 8. Age Vs MCV value.
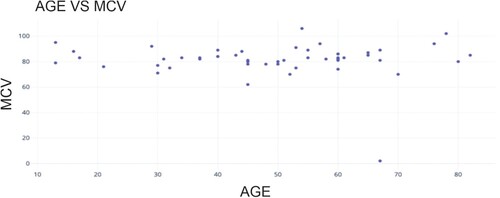
Figure 9. Age Vs RBC value.
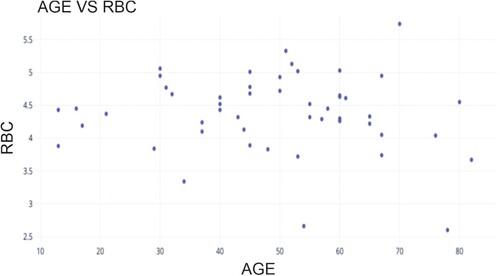
Figure 10. Age Vs M-Index value.
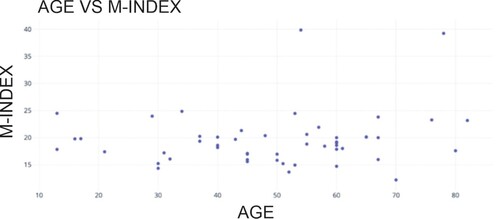
Figure 11. Quality parameters for raw data.
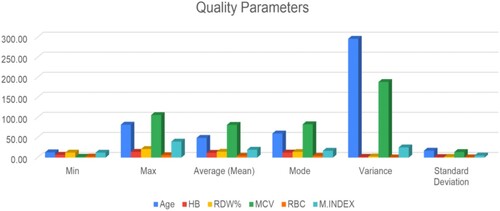
Figure 12. Quality parameters for age.
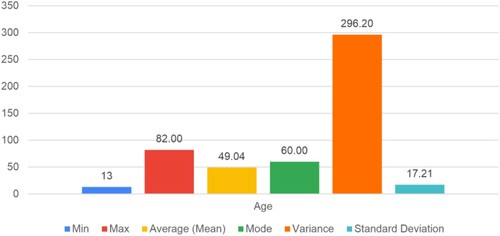
Figure 13. Quality parameters for hemoglobin count.
Red blood cell count measures a given amount of red blood cells. Reduced red blood cell count has been associated with several health issues, such as iron or vitamin deficiency anemia, long-term medical conditions, and blood loss. By contrast, conditions including lung disease, dehydration, and polycythemia vera are associated with an increased red blood cell count or erythrocytosis.
The standard reference range for RBC count is established as follows:
In adult males: A range of 4.5 to 6.0 million red blood cells per microliter.
In adult females, A range of 4.0 to 5.5 million red blood cells per microliter.
Figure shows the scatter plot between the age of the participants and their RBC value. The investigation's findings have shown that the average red blood cell count is 4.37, with a minimum of 2.6 and a maximum of 5.74, with a variance of 0.5.
The Mentzer Index (M-Index) divides the mean corpuscular volume (MCV) by the red blood cell count (RBC). It is used to differentiate between different types of Anemia, especially iron deficiency anemia.
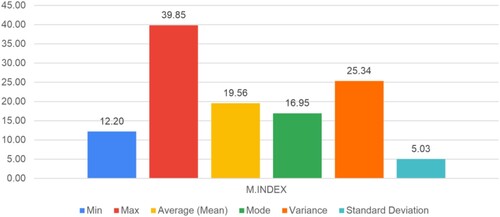
Figure shows the scatter plot between the age of the participants and their M-Index value. Our findings demonstrate that the mean value of the M-INDEX is 19.56, indicating that women in the area under study would have more red blood cells relative to their total red blood cell count. A distinctive observation like this suggests that iron deficiency Anemia, characterized by an inadequate iron supply to facilitate hemoglobin formation, may be observed.
The experimentation gives superior analysis and assessment of different blood parameters. The proposed data analysis and deep learning algorithm achieved average values of hemoglobin count 11.67 g/dL with a 1.33 standard deviation, RDW 14.59%, MCV 81.45, RBC 4.37 per microliter with a variance of 0.5, and M-Index 19.56. Also, the experimental results achieved 97.60% accuracy on 448 × 448 resolution images and 93.41% on 224 × 224 resolution images, demonstrating the effectiveness of the proposed technique for classifying anemia and its subtypes. The experimental results indicate better overlap between the automated identification of anemia and manual detection by the experts.
4.1. Comparative analysis
For the proper validation of the proposed system, all the quality parameters such as min (minimum value), max (maximum value), average (mean), mode, variance, and standard deviation for the proposed entity, such as age, hemoglobin (Hb) count, RDW%, MCV, RBC, and M-Index is calculated. For its better analysis, understanding, and interpretation, its graphical representation is shown in Figures .
Figure 14. Quality parameters for RDW.
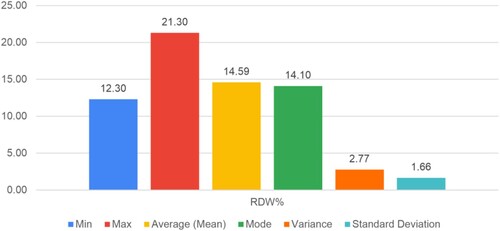
Figure 15. Quality parameters for MCV.
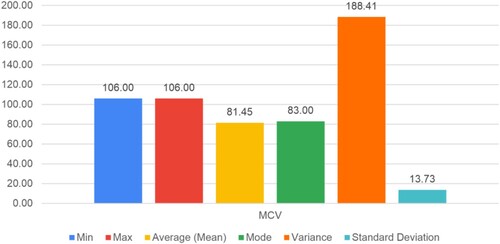
Figure 16. Quality parameters for RBC.
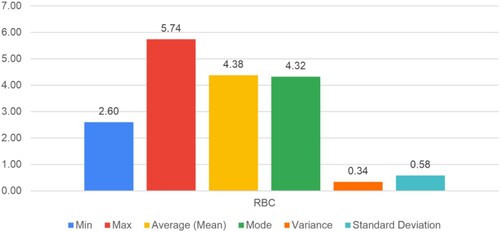
Figure 17. Quality parameters for M-Index.
5. Conclusion and future work
This study has illuminated various hematological indicators essential for knowing the health state of the women living in the region that was investigated. Analysis of hemoglobin levels, counts of red blood cells, mean corpuscular volume, and the Mentzer Index have yielded important information about the incidence of various forms of anemia, the possibility of an iron shortage, and the morphological features of red blood cells. According to our research, women in the area may be prone to iron deficiency anemia, having more red blood cells than total red blood cells. Furthermore, the examination of MCV values and RBC counts indicates that although the women's RBC counts are typically within the reference range, their red blood cells might be more prominent.
These findings are significant because they may help policymakers and medical professionals understand whether community-based iron deficiency and anemia may be addressed with focused interventions. By identifying these health trends, relevant authorities and healthcare professionals can put necessary measures in place to improve the population's general well-being.
Moreover, using measures such as RDW, RBC count, and MCV has provided an extensive understanding of the fundamental elements influencing fluctuations in hematological parameters. These insights greatly help public health experts and medical professionals trying to create customized healthcare plans to deal with specific health issues in the community.
Ethics approval
We confirmed that the experimental analysis was performed using the free dataset; therefore, ethical approval is Not Applicable.
Disclosure statement
No potential conflict of interest was reported by the author(s).
Data availability statement
The datasets used and/or analyzed during the current study are available from the corresponding author upon request.
References
- Asare JW, Appiahene P, Donkoh ET. Detection of anaemia using medical images: a comparative study of machine learning algorithms a systematic literature review. Inf Med Unlocked. 2023;40:1–10. doi:10.1016/j.imu.2023.101283
- Appiahene P, Asare JW, Donkoh ET, et al. Detection of iron deficiency anemia by medical images: a comparative study of machine learning algorithms. BioData Min. 2023;16(2):1–20.
- Bahadure NB, Ray AK, Thethi HP. Comparative approach of mri-based brain tumor segmentation and classification using genetic algorithm. J Digit Imaging. 2018;31:477–489. doi:10.1007/s10278-018-0050-6
- Bahadure NB, Ray AK, Thethi HP. A comparative approach of brain tumor detection using svm, dct and huffman coding in compressed domain. Curr Med Imaging Rev. 3 2018;14:778–787. doi:10.2174/1573405613666170629154727
- Hemasri A, Sreenidhi MD, Chaitanya VVK, et al. Detection of rbcs, wbcs, platelets count in blood sample by using deep learning. in 2023 International Conference on Sustainable Computing and Data Communication Systems (ICSCDS). 2023: 47–51.
- Gangula Y, KK AM. Detection, classification and counting rbcs and wbcs using deep learning. in 2023 Third International Conference on Secure Cyber Computing and Communication (ICSCCC), pp. 512-517, 2023.
- Mumford SL, Towler BP, Pashler AL, et al. Circulating microrna biomarkers in melanoma: tools and challenges in personalised medicine. Biomolecules. 2018;8(2). doi:10.3390/biom8020021
- Gozdzikiewicz N, Zwolinska D, Polak-Jonkisz D. The use of artificial intelligence algorithms in the diagnosis of urinary tract infectionsmdash;a literature review. J Clin Med. 2022;11(10). doi:10.3390/jcm11102734
- Chakraborty S, Kansara K, Kumar RD, et al. Non-invasive estimation of clinical severity of anemia using hierarchical ensemble classifiers. J Med Biol Eng. 2022;42:828–838. doi:10.1007/s40846-022-00750-3
- Al-Salmani K, Abbas HH, Schulpen S, et al. Simplified method for the collection, storage, and comet assay analysis of dna damage in whole blood. Free Radical Biol Med. 2011;51(3):719–725. doi:10.1016/j.freeradbiomed.2011.05.020
- Schmeiser HH, Muehlbauer K-R, Mier W, et al. Dna damage in human whole blood caused by radiopharmaceuticals evaluated by the comet assay. Mutagenesis. 2019;34(3):239–244. doi:10.1093/mutage/gez007
- Kavsaoglu AR, Polat K, Hariharan M. Non-invasive prediction of hemoglobin level using machine learning techniques with the ppg signal's characteristics features. Appl Soft Comput. 2015;37:983–991. doi:10.1016/j.asoc.2015.04.008
- Chandra A, Chauhan A, Bansal N, et al. Application of machine learning in hematological diagnosis. in 2021 International Conference on Technological Advancements and Innovations (ICTAI). 2021:665–671.
- Nithya R, Nirmala K. Detection of anaemia using image processing techniques from microscopy blood smear images. J Phys Conf Ser. 2022;2318:012043. doi:10.1088/1742-6596/2318/1/012043
- Waisberg E, Ong J, Zaman N, et al. A non-invasive approach to monitor anemia during long-duration spaceflight with retinal fundus images and deep learning. Life Sci Space Res (Amst). 2022;33:69–71. doi:10.1016/j.lssr.2022.04.004
- Alomar K, Aysel HI, Cai X. Data augmentation in classification and segmentation: a survey and new strategies. J Imaging. 2023;9(2):1–26. doi:10.3390/jimaging9020046
- Ahsan MM, Siddique Z. Machine learning-based heart disease diagnosis: a systematic literature review. Artif Intell Med. 2022;128:102289. doi:10.1016/j.artmed.2022.102289
- Rikan SB, Azar AS, Ghafari A, et al. Covid-19 diagnosis from routine blood tests using artificial intelligence techniques. Biomed Signal Process Control. 2022;72:103263. doi:10.1016/j.bspc.2021.103263
- Zhao Y, Zhang R, Zhong Y, et al. Statistical analysis and machine learning prediction of disease outcomes for covid-19 and pneumonia patients. Front Cell Infect Microbiol. 2022;12:838749. doi:10.3389/fcimb.2022.838749
- Asare JW, Appiahene P, Donkoh ET, et al. Iron deficiency anemia detection using machine learning models: a comparative study of fingernails, palm and conjunctiva of the eye images. Eng Rep. 2023;40:1–21.
- Appiahene P, Arthur EJ, Korankye S, et al. Detection of anemia using conjunctiva images: a smartphone application approach. Med Novel Technol Devices. 2023;18:100237. doi:10.1016/j.medntd.2023.100237
- Yang X, Piety NZ, Vignes SM, et al. Simple paper-based test for measuring blood hemoglobin concentration in resource-limited settings. Clin Chem. 2013;59(10):1506–1513. doi:10.1373/clinchem.2013.204701
- Johann KS, Bauer H, Wiegand P, et al. Detecting DNA damage in stored blood samples. Forensic Sci Med Pathol. 2023;19(1):50–59. doi:10.1007/s12024-022-00549-3
- Vijayarani S, Sudha S. An efficient clustering algorithm for predicting diseases from hemogram blood test samples. Indian J Sci Technol. 2015;8(17):1–8. doi:10.17485/ijst/2015/v8i17/52123
- Boersma E, Vroegindewey MM, van den Berg VJ, et al. Details on high frequency blood collection, data analysis, available material and patient characteristics in biomarcs. Data Brief. 2019;27:104750. doi:10.1016/j.dib.2019.104750
- Ahdan S, Setiawansyah S. Android-based geolocation technology on a blood donation system (BDS) using the Dijkstra Algorithm. Int J Appl Inf Technol. 2021;5(1):1–15.
- Le HT, Nguyen TTL, Nguyen TA, et al. Bloodchain: a blood donation network managed by blockchain technologies. Network. 2022;2(1):21–35. doi:10.3390/network2010002
- Alhazmi L. Detection of wbc, rbc, and platelets in blood samples using deep learning. BioMed Res Int. 2022;2022(Article ID 1499546):1–10. doi:10.1155/2022/1499546
- Dimauro G, Griseta ME, Camporeale MG, et al. An intelligent non-invasive system for automated diagnosis of anemia exploiting a novel dataset. Artif Intell Med. 2023;136:102477. doi:10.1016/j.artmed.2022.102477
- Haggenmuller V, Bogler L, Weber A-C, et al. Smartphone-based point-of-care anemia screening in rural Bihar in India. Commun Med. 2023;3(38):1–10.
- Dimauro G, Camporeale MG, Dipalma A, et al. Anaemia detection based on sclera and blood vessel colour estimation. Biomed Signal Process Control. 2023;81:104489. doi:10.1016/j.bspc.2022.104489
- Dhalla S, Maqbool J, Mann TS, et al. Semantic segmentation of palpebral conjunctiva using predefined deep neural architectures for anemia detection. Procedia Comput Sci. 2023;218:328–337. doi:10.1016/j.procs.2023.01.015
- Saputra DCE, Sunat K, Ratnaningsih T. A new artificial intelligence approach using extreme learning machine as the potentially effective model to predict and analyze the diagnosis of anemia. Healthcare. 2023;11(5):1–25.
- Kistenev YV, Vrazhnov DA, Shnaider EE, et al. Predictive models for covid-19 detection using routine blood tests and machine learning. Heliyon. 2022;8(10):e11185. doi:10.1016/j.heliyon.2022.e11185
- Kukar M, Guncar G, Vovko T, et al. Covid-19 diagnosis by routine blood tests using machine learning. Sci Rep. 2021;11:10738. doi:10.1038/s41598-021-90265-9
- Chen H, Wang F, Su L, et al. Mathematical statistics of factors affecting the unqualified quality of blood samples in medical examination. in 2020 International Conference on Public Health and Data Science (ICPHDS). 2020: 253–256.
- Pfeil J, Nechyporenko A, Frohme M, et al. Examination of blood samples using deep learning and mobile microscopy. BMC Bioinformatics. 2022;23(65):1–14.
- Alsheref FK, Gomaa WH. Blood diseases detection using classical machine learning algorithms. Int J Adv Comput Sci Appl. 2019;10(7):77–81. doi:10.14569/IJACSA.2019.0100712
- Noor NB, Anwar MS, Dey M. An effcient technique of hemoglobin level screening using machine learning algorithms. in 2019 4th International Conference on Electrical Information and Communication Technology (EICT). 2019: 1–6.
- Golap MA-u, Hashem MMA. Non-invasive hemoglobin concentration measurement using mggp-based model. in 2019 5th International Conference on Advances in Electrical Engineering (ICAEE), pp. 1–6, 2019.
- Gun_car G, Kukar M, Notar M, et al. An application of machine learning to haematological diagnosis. Sci Rep. 2018;8(1):1–12.
- Narmatha C, Eljack SM, Tuka AARM, et al. A hybrid fuzzy brainstorm optimization algorithm for the classification of brain tumor MRI images. J Ambient Intell Humaniz Comput. 2020;96(01):867–879.
- Jiang P, Ergu D, Liu F, et al. A review of yolo algorithm developments. In The 8th International Conference on Information Technology and Quantitative Management (ITQM 2020 & 2021), pp. 1066–1073, Procedia Computer Science, 2022.