
 ?Mathematical formulae have been encoded as MathML and are displayed in this HTML version using MathJax in order to improve their display. Uncheck the box to turn MathJax off. This feature requires Javascript. Click on a formula to zoom.
Abstract
The increasing importance of accurate battery state estimations in advanced Battery Management Systems (BMS) underscores the need for precise modelling of battery behaviour and characteristics. While equivalent circuit models are widely utilized for their low computational demands, they face challenges in maintaining precision and adaptability during dynamic conditions, posing a persistent concern for future advancements. This study focuses specifically on the battery hysteresis effect, a complicating factor in the modelling and estimation processes. Open circuit voltage (OCV) measurements and parameter identification for equivalent circuit models were conducted on prevalent Li-ion battery technologies, namely nickel-manganese–cobalt (NMC) and lithium-iron-phosphate (LFP). The experimental results indicate the hysteresis effect becomes more significant with lower temperatures. In this paper, a battery model covering the temperature influence on the hysteresis effect is proposed. The proposed model exhibits an average root mean square error of less than 13 mV. The model holds promise for application in modern battery management systems, offering an enhancement to state-of-charge estimation methodologies.
I. Introduction
Battery management systems play a crucial role in ensuring the safe and reliable operation of a battery pack. Nevertheless, advanced BMS systems require an accurate state of charge (SoC) and state of health (SoH) estimation. To meet these demands, modern BMS systems are equipped with battery models that rely on equivalent circuit models (ECM). This choice is driven by the ECM's ability to meet processing power requirements while providing acceptable accuracy.
To model Li-ion battery dynamic behaviour, OCV test and cell impedance measurements to estimate ECM parameters are usually employed [Citation1–5]. There are several methods for impedance parameter identification. The electrochemical impedance spectroscopy (EIS) test procedure can be used, but it requires specific instrumentation. A hybrid pulse power characterization test can be used as well. However, 30 s of rest might not be sufficient. Therefore, in [Citation1–4], longer resting periods were applied in the pulse current test.
An important aspect of battery modelling is OCV. OCV is a function of SoC, and the cell OCV values are determined empirically at numerous SOC points [Citation2,Citation6]. The OCV test is performed similarly to the pulse current test, which is described in [Citation1]. For the measurement of the close-to-equilibrium OCV, the length of the resting period is the key aspect, but there is no uniform opinion regarding the resting period length across the literature. In [Citation6], authors used a resting time of 30 minutes. In other studies, the resting time was 2 hours [Citation1], or 4 hours respectively [Citation3]. A 24-hour resting period was suggested in [Citation7], but the whole test becomes extensively time-consuming. In [Citation2], a 20-hour resting period was applied at 50% SoC, but the equilibrium still didn’t seem to be reached. However, the error between the measured voltage and the OCV decays the most within the first few hours, so 3–4 hours of resting can be regarded as a good trade-off between accuracy and time-consuming tests.
Temperature dependence on OCV was tested in [Citation1] and [Citation8]. In [Citation1], a difference of less than 2 mV was found for OCV at most temperatures. Similarly, in [Citation8] it was found that the temperature has a very little impact on OCV parameters. Therefore, it can be assumed that temperature does not have an impact on OCV if a long enough resting period is applied.
There are more ways of the OCV modelling, the most common are a lookup table and description by an analytic function. For a lookup table, the OCV is evaluated by interpolation between table values. In the case of an analytic function, the data can be fitted by a certain function. For example, a polynomial function, exponential function, Gaussian model, or a sum of sinus functions can be used [Citation9]. The OCV is then calculated by evaluating this function for a specific SoC value. A comparative study in [Citation10] showed that the 9th-order polynomial model is optimal for OCV modelling for both NMC and LFP cells.
However, the OCV modelling doesn’t sufficiently describe the hysteresis effect. Understanding this phenomenon is the key factor in accurate battery modelling. Based on [Citation11], the reasons behind the hysteresis effect are entropic effects, mechanical stress, and microscopic distortions within the active electrode materials during lithium insertion or extraction. Another paper [Citation12] shows that high current rates create strong inhomogeneities in the particles’ lithium contents. Therefore, they induce an ion transfer from lithiated particles towards delithiated particles. These inhomogeneities create the hysteresis effect. The inhomogeneities create different potentials within the particle and electrode material, which creates local SoC differences [Citation13]. That induces diffusion, which is temperature dependent. Paper [Citation13] also shows slower lithium transport within particles at lower temperatures. To quantify and reconstruct the effects under various conditions, new methods must be encountered, considering the load current intensity besides the SOC, SoH, temperature, battery history, and the load current direction as factors influencing the hysteresis [Citation12].
In [Citation14], authors model the hysteresis effect based on two independent charge and discharge OCV curves. In [Citation15], the hysteresis was modelled by a four-state system with 8 different parameters for both charging and discharging. These parameters were identified based on curve-fitting techniques. However, the temperature model for Li-ion battery cells was not included.
In [Citation16], the authors use a state-space representation for the real-time battery model and the hysteresis model. The hysteresis model parameters, which affect the hysteresis behaviour are the maximum hysteresis voltage and the convergence rate. The study includes tests at different ambient temperatures and presents temperature-dependent hysteresis parameters for temperatures of 5, 21 °C, and 35 °C. In [Citation17], a second-order ECM was used, where ECM parameters were a function of SoC and temperature. However, the hysteresis was modelled by the same method as in [Citation16] without considering the temperature effect.
The main contribution of this paper is the proposed battery model, which includes the effect of the temperature on battery hysteresis. That allows more accurate battery modelling and improves SoC estimation in BMS.
The organization of this paper is set as follows. Section II describes the methodology of battery dynamic modelling behaviour, Section III deals with the experimental equipment and experiments, Section IV contains ECM parameters identification results, the hysteresis model is proposed in Section V together with the simulation results, and Section VI concludes the paper.
II. Methodology
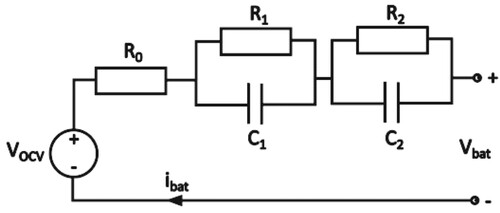
Modelling Li-ion battery cells using the equivalent circuit model commonly involves conducting the OCV test and impedance test across a broad SoC range. Through these tests, the ECM parameters are characterized as functions of SoC or temperature. In this paper, a second-order ECM is employed, and its representation is illustrated in Figure .
Figure 1. Equivalent circuit model.
A. Parameter identification of ECM
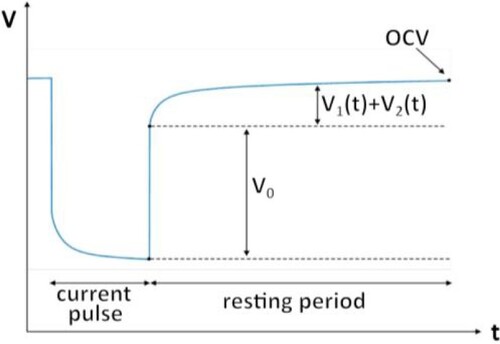
The pulse current test was chosen for the ECM parameter identification because it doesn’t require any additional equipment. The cell is commonly fully charged before the test starts, and then the cell is discharged by a constant current of 0.5C by steps of 5% SoC (Figure ). The voltage response is measured for both discharging and charging across the whole SoC range. The voltage response for RC pairs is described by the following equation [Citation1]:
(1)
(1) where
is the open circuit voltage,
is an instantaneous voltage drop across series internal resistance
,
is a time constant of each of parallel RC pairs, and
is a voltage drop across each of RC pairs in steady state. In practice, 2 RC pairs are used the most often, so this equation can be rewritten as:
(2)
(2) where
and
are shorter and longer time constants. Parameters
and
can be extracted by curve fitting as shown in Figure . Curve Fitting Toolbox in MATLAB was used to extract these parameters. The equivalent series resistance is calculated from instantaneous voltage drop and applied current [Citation2]:
(3)
(3)
(4)
(4)
(5)
(5)
(6)
(6)
(7)
(7) where
is a current of the applied pulse.
Figure 2. Pulse current test.
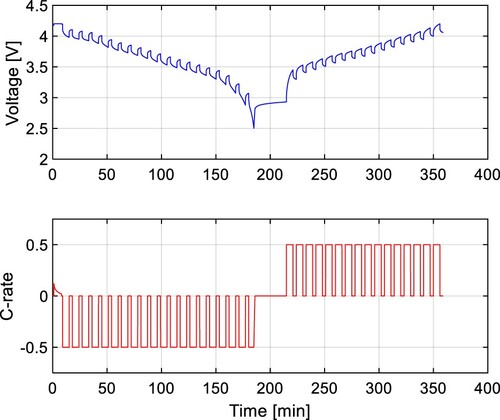
Figure 3. Voltage response on a discharging current pulse.
B. OCV Test
The OCV test follows the same procedure as the pulsed current test, with the difference that there were applied resting periods of 3 hours, and the battery current was reduced to 0.2C. The voltage of the cell, measured after this resting period, is regarded as the OCV. This test is conducted on three cells of the same sort for both battery technologies used in this study to ensure higher accuracy. Subsequently, the OCV is modelled using a lookup table.
III. Experimental setup and experiments
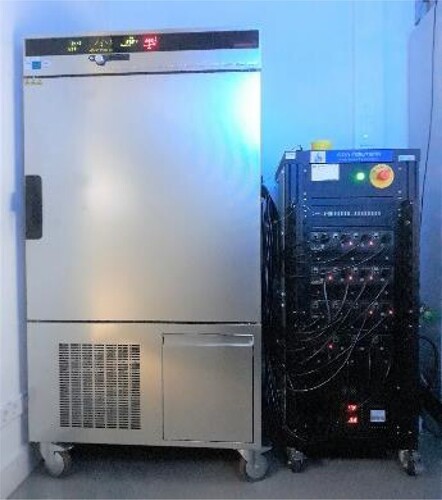
All tests were conducted on Arbin battery tester, model LBT22043 (Figure ). Every one of the 16 channels provide a current load of 10 A. The constant testing temperature was ensured by Memmert environmental test chamber CTC256 with an adjustable temperature range from – 42 °C to +190 °C.
Figure 4. Temperature chamber and battery tester.
There were selected two different Li-ion cells for battery testing and modelling. The first one is a cylindrical cell Samsung INR18650-35E, representing the Nickel Manganese Cobalt (NMC) technology of Li-ion batteries, which is widely used in the automotive industry nowadays. The second one is JGNE18650-1800 mAh representing the Lithium Ferro Phosphate technology (LFP). The LFP cells have a lower energy density compared to the NMC cells but have other advantages like a lower price and are much less likely to suffer from a thermal runaway, or they exhibit longer cycle life [Citation18]. The parameters of these two cells are stated in Table . Both cells are cylindrical with the same shape and dimensions, a length of 65 mm and a diameter of 18 mm. All cells used in this study were new and without previous cycling.
Table 1. Parameters of two selected cells.
A. OCV test results
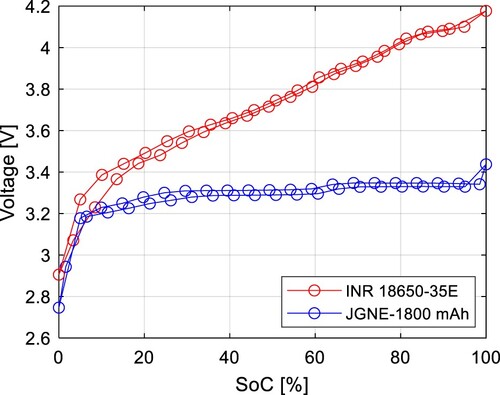
The Open Circuit Voltage (OCV) test was executed on the chosen cells, revealing a distinct difference in OCV curves during charging and discharging, as depicted in Figure . The discharging curve is identifiable by a lower voltage, whereas the charging curve exhibits a higher voltage. The NMC cell operates within a much wider voltage range up to 4.2 V, and its voltage changes noticeably with the SoC. In contrast, the OCV characteristics of the LFP cell are flatter, posing a challenge for SoC estimation, but offering a more stable characteristic.
Figure 5. OCV for discharging and charging of INR18650-35E (NMC) and JGNE-1800 mAh (LFP) cell.
B. Impedance test results
The impedance tests were performed under 5 different temperatures (0, 10, 20, 30, and 40 ˚C) with a sampling period of 1 s. The fitted parameters of the INR18650-35E cell are depicted in Figure and Figure for both discharging and charging. The parameters of the JGNE1800 mAh cell are in Figure and Figure .
Figure 6. ECM parameters of INR18650-35E cell as a function of SoC (discharging).
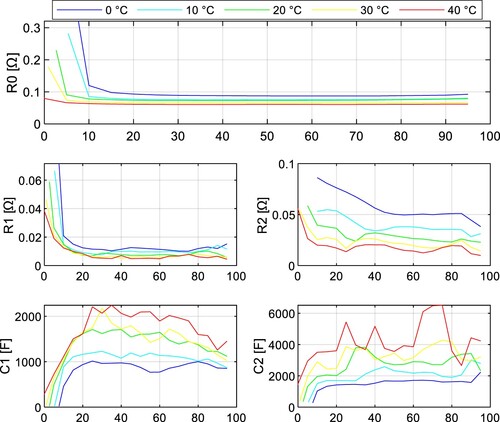
Figure 7. ECM parameters of INR18650-35E cell as a function of SoC (charging).
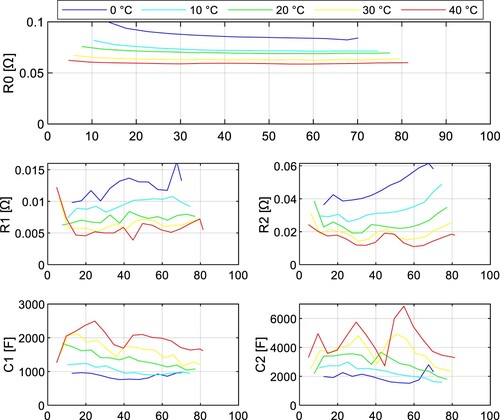
Figure 8. ECM parameters of JGNE1800 mAh cell as a function of SoC (discharging).
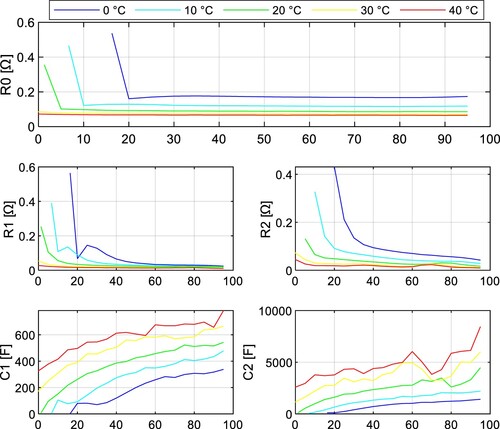
Figure 9. ECM parameters of JGNE1800 mAh cell as a function of SoC (charging).
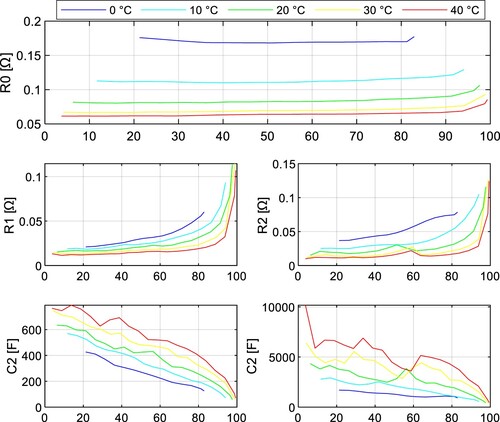
It can be seen the resistance parameters ,
, and
are increasing with lower SoC during discharging. This statement applies to both NMC and LFP battery chemistry. Note these parameters are highly temperature dependent and increase with lower temperature.
The parameter of the NMC cell increased by 43.9% at temperature 0 ˚C compared to 40 ˚C at 50% SoC, whereas for the LFP cell, it was 159.5%.
and
also increase much more dramatically for LFP cells at lower temperatures, so it can be concluded that the power capabilities of LFP cells at lower temperatures are significantly worse compared to NMC cells due to the rise of internal impedance.
IV. ECM parameters identification results
In the previous section, the OCV test and the pulse current test for various temperatures were performed to complete the ECM modelling dynamic behaviour of NMC and LFP battery cells. The model is created in MATLAB/Simulink, where the cell current is the input, and the cell voltage is the output. The SoC is calculated based on the coulomb counting method, where the cell current is integrated over time. Parameters ,
,
,
,
, and OCV are a function of SoC, so their values are set based on lookup tables. The polarity of the cell current determines whether the value set for charging or discharging is selected. The model is set to switch between charging and discharging sets as soon as the current polarity changes. The cell voltage
is then calculated as:
(8)
(8) where
is a voltage representing voltage drop across the
resistor and across both RC pairs. The simulation results of the pulse current test at different temperatures without modelling hysteresis are shown in Figure for the LFP cell and Figure for the NMC cell. It can be found that measured and simulated results correspond very well at higher temperatures (around 40 ˚C), and the lower the temperature, the greater the deviation between both waveforms.
Figure 10. Comparison of measured voltage and simulation results without modelling hysteresis at 40, 20, and 0 ˚C for LFP.
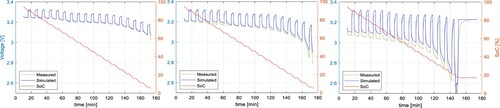
Figure 11. Comparison of measured voltage and simulation results without modelling hysteresis at 40, 20, and 0 ˚C for NMC.
That applies to both NMC and LFP cells. The difference between measured and simulated results is shown in Figure and Figure . It is clear from these figures that lower temperatures create larger deviations, and the model suffers from lower accuracy. The diffusion of lithium ions is much slower at lower temperatures, which creates larger inhomogeneities within electrode material, and different potentials across the electrode [Citation19]. It takes a longer time to get closer to the OCV, and the diffusion gradually slows down as the potential gradients decrease. The diffusion finally stops at a voltage level different from the OCV, which creates the hysteresis effect, because the cell voltage of an unloaded cell is lower than OCV during the discharging process, and higher during charging.
Figure 12. Deviation between measured and simulated results for NMC battery cell.
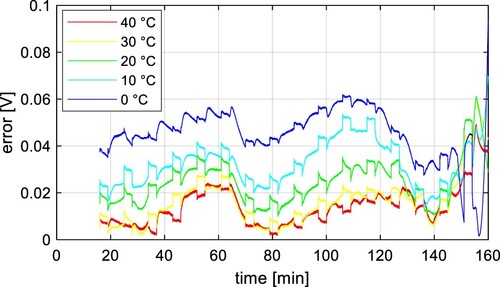
Figure 13. Deviation between measured and simulated results for LFP battery cell.

To evaluate the difference between the measured and simulated waveforms, the Root Mean Square Error (RMSE) was used. RMSE is calculated as:
(9)
(9) where
is the number of data points,
is the simulated voltage response, and
is the measured voltage. RMSE was calculated from charging and discharging data for both cells, the results are shown in Table , and visualized in Figure . RMSE clearly increases with lower temperatures. However, RMSE is much lower for charging than discharging. That means, the model is more accurate for charging, and the hysteresis effect is more significant during the discharging process.
Figure 14. The RMSE from temperature for both tested cells.
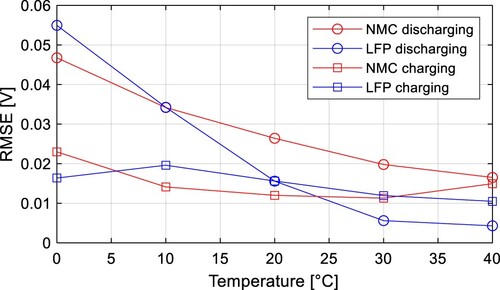
Table 2. Calculated RMSE for different temperatures.
The calculated RMSE at 20 ˚C for the NMC cell was 26.4 mV, which is relatively high, so the hysteresis effect can not be ignored for the battery modelling, especially if the operating temperatures are lower than the room temperature. Therefore, more advanced modelling approaches are needed for a better description of Li-ion battery dynamic behaviour.
V. Proposed hysteresis model and simulation
The most commonly used model of battery hysteresis can be found in [Citation20, Citation16], or [Citation14]. The hysteresis effect is described by a discrete-time equation:
(10)
(10) where
is the maximum hysteresis polarization,
is the sign function,
is the battery current, and
is represents the expression:
(11)
(11) where
stands for the battery coulombic efficiency,
representing the convergence rate,
is a sampling period of 1 s, and
is the battery capacity. These equations don’t take into account the temperature effect, which influences the maximum hysteresis polarization
. Therefore, the model can be adjusted to express
as a function of the temperature and current polarization. The RMSE values in Figure indicate the hysteresis impact. Therefore, these data can be fitted to express the maximum hysteresis polarization
. For the discharging process, these data can be fitted by exponential equation for both cell types:
(12)
(12) where
and
are fitted constants, and
is the temperature in ˚C. However, for the charging process, the data don’t exhibit exponential characteristics, so the maximum hysteresis polarization during the charging process
was calculated as an average RMSE value across the whole temperature range. All model parameters can be found in Table . Fitted results of
are shown in Figure .
Figure 15. The fitted RMSE of discharging from temperature based on the exponential equation.
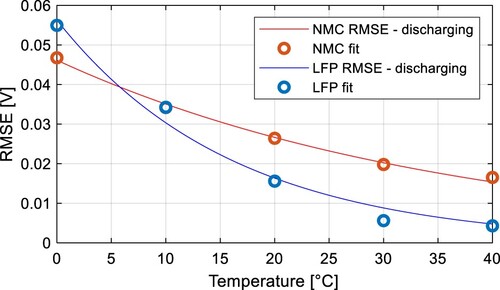
Table 3. Hysteresis model parameters.
A. The simulation results
The simulation results of the proposed model were compared to the measured waveform, and the calculated RMSE values are shown in Table . The biggest improvement was observed during discharging at 0 ˚C for the NMC, where the RMSE was reduced by 77.1%. The voltage waveforms of both simulations are shown in Figure . The simulation results of a battery model including the proposed hysteresis model exhibit much better accuracy compared to the battery model without the hysteresis model. It has also the potential to exhibit better accuracy compared to the traditional hysteresis model since the maximum hysteresis polarization is a function of the current polarity and the temperature. Even higher accuracy could be obtained by incorporating the SoC effect on the battery hysteresis. The average RMSE of the proposed model is 0.0099 V for the NMC cell, and 0.0095 V for the LFP cell.
Figure 16. Comparison of measured voltage, simulation results without the hysteresis model, and simulation results including the hysteresis model at 0 ˚C for NMC cell.
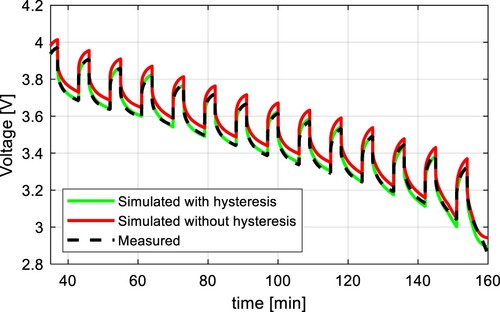
Table 4. Calculated RMSE for different temperatures including the proposed hysteresis model.
B. Model verification
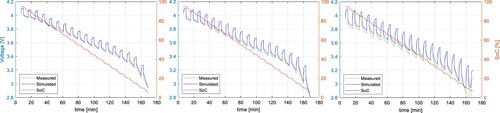
In Figure , the simulation results were compared to the measured results, where the same testing procedure was used for parameter identification tests. However, the ECM parameters may differ for different cycling profiles. Therefore, the model verification was made by applying different discharging C-rates, lengths of the discharging pulse, and temperature. The pulse current test in Figure was adjusted to use the discharging C-rates of 0.2C, 0.5C, and 1C at the ambient temperature of 25 °C. To perform the parameter identification, the length of the discharging pulse was 15 minutes for the C-rate of 0.2C, 6 minutes for 0.5C, and 3 minutes for 1C, so the ECM parameters can be identified with the step of 5% SoC.
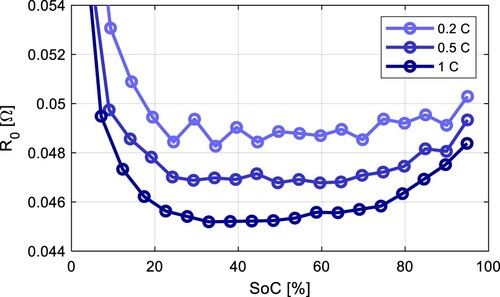
The results of these tests were compared to the simulation results of the proposed model in Figure for 0.2C, Figure for 0.5C, and Figure for 1C. All results show a high accuracy with the RMSE of 0.0121, 0.0105, and 0.0151 V respectively. Results with the C-rates different from 0.5C show slightly higher RMSE because the internal impedance slightly varies from the C-rate. The dependency of the parameter from the C-rate is shown in Figure . It can be seen, that the higher the C-rate, the lower the
parameter. This might be a consequence of a higher cell core temperature due to higher discharging C-rate and larger losses.
Figure 17. Comparison of measured voltage and simulation results of the proposed model with a discharging C-rate of 0.2C at 25 ˚C for NMC cell.
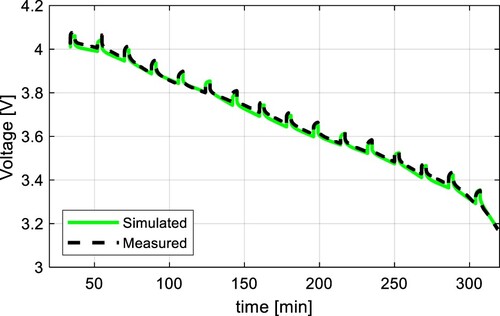
Figure 18. Comparison of measured voltage and simulation results of the proposed model with a discharging C-rate of 0.5C at 25 ˚C for NMC cell.
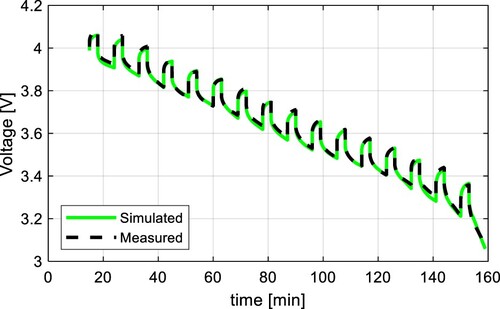
Figure 19. Comparison of measured voltage and simulation results of the proposed model with a discharging C-rate of 1C at 25 ˚C for NMC cell.
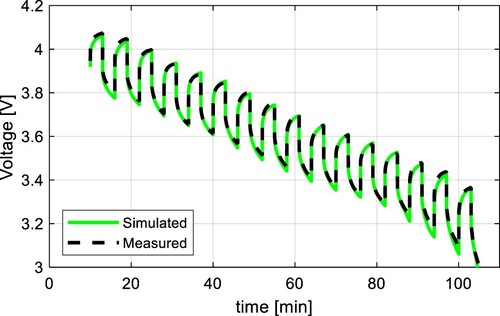
Figure 20. Parameter as a function of SoC at different C-rates.
VI. Conclusion
In this paper, the temperature dependency on Li-ion battery hysteresis was studied and an improved hysteresis model was proposed. The OCV and pulse current tests were performed to extract the OCV curve and the internal impedance parameters of NMC and LFP battery chemistries. The created battery models were subjected to a simulation of the pulse current test at different temperatures and compared to the measured waveforms. The simulation results at 40 ˚C show very high accuracy even for the model without hysteresis modelling. However, with lower temperatures, the deviations were much larger, which were visible, especially during the discharging process. The hysteresis effect becomes more significant due to the slower diffusion of lithium ions at lower temperatures. To avoid inaccurate modelling and problems with SoC estimation in BMS, the battery hysteresis model was proposed considering the effect of the temperature. The maximum hysteresis polarization was proposed as a function of the current polarity and the temperature. The model verification showed the average RMSE of 0.0125 V. Therefore, the proposed model has a great ability to estimate the battery terminal voltage, thus it can improve the SoC estimation in advanced battery management systems.
Disclosure statement
No potential conflict of interest was reported by the author(s).
Additional information
Funding
References
- Lam L, Bauer P, Kelder E. A practical circuit-based model for Li-ion battery cells in electric vehicle applications. 2011 IEEE 33rd International Telecommunications Energy Conference (INTELEC), IEEE, Oct. 2011, pp. 1–9. doi:10.1109/INTLEC.2011.6099803
- Cittanti D, Ferraris A, Airale A, et al. Modeling Li-ion batteries for automotive application: A trade-off between accuracy and complexity). 2017 International conference of electrical and electronic technologies for automotive, IEEE, Jun. 2017, pp. 1–8. doi:10.23919/EETA.2017.7993213
- Yu Y, Narayan N, Vega-Garita V, et al. Constructing accurate equivalent electrical circuit models of lithium iron phosphate and lead-acid battery cells for solar home system applications. Energies (Basel). Sep. 2018;11(9):22, doi:10.3390/en11092305
- Kwon S-J, Lee S-E, Lim J-H, et al. Performance and life degradation characteristics analysis of NCM LIB for BESS. Electronics (Basel). Dec. 2018;7(12):406), doi:10.3390/electronics7120406
- Bodnár D, Mouli GRC, Ďurovský F, et al. Semi-Empirical model of nickel manganese cobalt (NMC) lithium-Ion batteries including capacity regeneration phenomenon. IEEE Trans Transp Electrification. 2024: 1–1. doi:10.1109/TTE.2024.3396277
- Baccouche I, Jemmali S, Manai B, et al. Li-ion battery modeling and characterization: An experimental overview on NMC battery. Int J Energy Res. Mar. 25, 2022;46(4):3843–3859. John Wiley and Sons Ltd, doi:10.1002/er.7445
- Li J, Mazzola M, Gafford J, et al. A new parameter estimation algorithm for an electrical analogue battery model. 2012 twenty-seventh annual IEEE applied power electronics conference and exposition (APEC), IEEE, Feb. 2012, pp. 427–433. doi:10.1109/APEC.2012.6165855
- Birkl CR, McTurk E, Roberts MR, et al. A parametric open circuit voltage model for lithium Ion batteries. J Electrochem Soc. Sep. 2015;162(12):A2271–A2280. doi:10.1149/2.0331512jes
- Zhang R, Xia B, Li B, et al. A study on the open circuit voltage and state of charge characterization of high capacity lithium-Ion battery under different temperature. Energies (Basel). Sep. 2018;11(9):2408), doi:10.3390/en11092408
- Yu Q-Q, Xiong R, Wang L-Y, et al. A comparative study on open circuit voltage models for lithium-ion batteries. Chin J Mech Eng. Dec. 2018;31(1):65), doi:10.1186/s10033-018-0268-8
- Baronti F, Femia N, Saletti R, et al. Hysteresis modeling in Li-ion batteries. IEEE Trans Magn. Nov. 2014;50(11):22), doi:10.1109/TMAG.2014.2323426
- Roscher MA, Bohlen O, Vetter J. Ocv hysteresis in Li-Ion batteries including Two-phase transition materials. Int J Electrochem. 2011;2011:1–6. doi:10.4061/2011/984320
- Wilhelm J, Seidlmayer S, Erhard S, et al. In situ neutron diffraction study of lithiation gradients in graphite anodes during discharge and relaxation. J Electrochem Soc. Jun. 2018;165(9):A1846–A1856. doi:10.1149/2.1231809jes
- Qiu S, Chen Z, Masrur MA, et al. Battery hysteresis modeling for state of charge estimation based on Extended Kalman Filter). 2011 6th IEEE conference on industrial electronics and applications, IEEE, Jun. 2011, pp. 184–2189. doi:10.1109/ICIEA.2011.5975576
- Rahimi Eichi H, Chow M-Y. Modeling and analysis of battery hysteresis effects. 2012 IEEE energy conversion congress and exposition (ECCE), IEEE, Sep. 2012, pp. 4479–4486. doi:10.1109/ECCE.2012.6342212
- Kim T, Qiao W, Qu L. Hysteresis modeling for model-based condition monitoring of lithium-ion batteries). 2015 IEEE energy conversion congress and exposition (ECCE), IEEE, Sep. 2015, pp. 5068–5073. doi:10.1109/ECCE.2015.7310374
- Choi E, Chang S. A temperature-dependent state of charge estimation method including hysteresis for lithium-Ion batteries in hybrid electric vehicles. IEEE Access. 2020;8:129857–129868. doi:10.1109/ACCESS.2020.3009281
- Miao Y, Hynan P, von Jouanne A, et al. Current li-ion battery technologies in electric vehicles and opportunities for advancements. Energies. Mar. 20, 2019;12(6), MDPI AG, doi:10.3390/en12061074
- Bodnár D, Marcin D, Ďurovský F. Temperature dependence of Li-ion battery hysteresis for battery modeling purposes. 2023 international conference on electrical drives and power electronics (EDPE), IEEE, Sep. 2023, pp. 1–6. doi:10.1109/EDPE58625.2023.10274043
- Plett GL. Battery management systems, Volume I: Battery modeling. 2015.