Abstract
Capsule Repeated counts of fledged broods can provide a useful estimate of breeding success for most common woodland birds.
Aims To assess the efficacy of comparing fledged-brood survey data with territory mapping using simple mark–recapture analysis techniques to provide an estimate of breeding success for common woodland birds that does not involve finding nests.
Methods Three observers undertook territory mapping surveys of adults, followed by counts of fledged broods four times a week during May–July 2007 in two 15 ha woods each, both in southern England. Using known fledging to maturity periods, these counts were used to calculate daily detection probabilities for broods of ubiquitous species. These enabled fledged brood territory occupancy probabilities (i.e. brood to territory ratios) to be estimated that take account of the possibility that broods were present but missed by surveys.
Results Of the 19 species found in all six woods, mean daily detection probability estimates for fledged broods of 17 species ranged from 0.17 to 0.50 with significant variation between woods for 12 species, but within region/observer for four species. The mean probability of detecting a brood at least once was over 75% using four visits per week and over 50% using two visits. Only for Great Spotted Woodpeckers Dendrocopos major and Garden Warblers Sylvia borin was the fledging period too short and the daily detection probability too low to provide a reasonable estimate of the territory occupancy probability.
Conclusion Daily detection probabilities for fledged broods of most common woodland birds were sufficiently high to enable useable estimates of fledged-brood territory occupancy probabilities to be made based on a survey programme involving two or three visits per week between late May and the end June. The method used may have application as a means of providing a relatively easily derived productivity index for woodland bird monitoring programmes or for research studies.
The measurement of breeding success in birds can be essential in studies of population ecology and demographic processes (Newton Citation1998, Thompson Citation2007). Breeding output is a key direct measurement of individual fitness in the assessment of habitat quality (Johnson Citation2007). However, assessments in the field encounter methodological and practical difficulties that often make accurate measurement difficult. Furthermore, proven methods for estimating productivity in particular (i.e. fledging, as opposed to other reproductive parameters such as clutch or hatch size) are unavailable for many species (Gilbert et al. Citation1998). As a consequence, there have been few studies of predation of natural nests of, for example, woodland songbirds in Britain or elsewhere in Europe (Hewson & Fuller Citation2003, Nicoll & Norris Citation2010), even though around ten bird species which use British woodlands have undergone declines in recent years (Baillie et al. Citation2010, Fuller et al. Citation2005, Hewson et al. Citation2007), resulting in several being red- or amber-listed (Eaton et al. Citation2009). The populations of other woodland species have not increased, even though woodland cover in the UK has increased by at least 20% since 1980 (Forestry Commission Citation2003, Vanhinsbergh et al. Citation2002).
Two main generic methods have been used to assess productivity in woodland bird communities – nest monitoring and mist-netting. The British Trust for Ornithology's (BTO) Nest Record Scheme (NRS) involves finding nests, counting the contents, and recording the outcome through regular visits (Crick et al. Citation2003). The number of fledglings produced can usually be estimated. The stage, and sometimes cause, of nest failure can be gauged and nest survival rates estimated, depending on frequency of nest monitoring. The scheme cannot determine overall reproductive output of multiple-brooded species unless comprehensive nest searches are carried out in discrete plots (Martin et al. Citation1997). Monitoring nests with video cameras provides more detailed information of timing and causes of nest failure (e.g. Schaefer Citation2004, Stake et al. Citation2004, Thompson Citation2007, Weidinger Citation2009). Biases arise if monitored nests are less concealed than those not found, and disturbance caused during nest monitoring can inflate estimated and real nest failure rates respectively (Bart Citation1977, Crick et al. Citation2003). Also where nest predation rates are very high, estimated failure rates may be too low because only less vulnerable nests survive to be found and monitored. These biases can be avoided by radio-tracking a sample of breeding adults, but this adds substantially to the already labour-intensive and expensive nest-monitoring procedures (Crick et al. Citation2003, Martin et al. Citation1997).
Constant effort mist-netting provides an index of productivity calculated from annual variation in the adult : young ratio in captures of a species (Peach et al. Citation1996), using a variety of analytical methods (e.g. Robinson et al. Citation2007). This method is used both by the BTO in their Constant Effort Scheme (Peach et al. Citation1996, Robinson et al. Citation2009), which together with the NRS feeds into the Integrated Population Monitoring programme (Baillie Citation1990), and also by the Monitoring Avian Productivity and Survivorship (MAPS) Program in North America (DeSante et al. Citation1993). The index produced by netting combines productivity and an element of early post-fledging survival, but is not able to identify the stage or cause of failure of breeding attempts. As the method also effectively sums the output from all breeding attempts, it provides an index that is relevant to the pool of young that are potentially available for recruitment after the breeding season. However, since the ratio of adult : young captures is used to derive the index of productivity, assessment of productivity may be confounded by the presence of non-breeding ‘floaters’ (Newton Citation1998) at high population densities. Also, as post-fledging movements of young before capture could influence local capture rates, this method is not ideally suited to measuring productivity within a discrete target area. Furthermore, it is labour-intensive, because it requires multiple standardized mist-netting sessions to be carried out during and immediately after the breeding season.
There are other methods for assessing productivity in certain species or groups of birds which have not been applied to woodland birds (Gilbert et al. Citation1998). In particular, for shorebirds, waterfowl, and gamebirds, adult to young ratios can be derived from visual counts of post-breeding groups of birds. These have been employed to provide estimates of between-year variation in productivity, derived either from visual counts of waterfowl flocks (Lynch & Singleton Citation1964, U.S. Fish and Wildlife Service Citation1977) or other groups (e.g. grey partridge coveys, Game & Wildlife Conservation Trust Citation1996, Potts Citation1986) or cannon-netted shorebirds (Clark et al. Citation2006). Like mist-netting, the index produced by this method can be influenced by variation in mortality if significant time elapses between first fledging and the count. It can also be influenced by variation in the distribution of young within groups and at wider spatial scales, so possible movement patterns need to be understood (Lambeck Citation1990). For example, for waterfowl and shorebirds the index is usually based on large catchment areas, while for relatively sedentary species, such as gamebirds, it can be used for assessing productivity on individual farms (Game & Wildlife Conservation Trust Citation1996). The method provides no information on the causes or stage of failure of breeding attempts.
Assessing productivity by counting fledglings in the field is relatively quick to carry out because there is no need to find nests or to catch birds. Shorebirds and gamebirds lend themselves to this method specifically because fledged young are, at certain times, easy to see. However, ornithologists and bird watchers know that the fledged young of many common bird species found in woodlands and gardens are also regularly encountered in summer. We asked whether simple counts of fledged birds in woodland habitats could be used in conjunction with a standard adult population assessment to calculate a useful young to old ratio for some of these species. The opportunity to explore this idea arose in relation to ongoing studies of predation by non-native Grey Squirrels Sciurus carolinensis and their possible impact on productivity or population size in woodland birds (Hewson et al. Citation2004, Newson et al. Citation2010). To look at the possible effects of squirrel control on bird productivity, we required an overall index of breeding success for mainly passerine species in a number of discrete woodland areas, with the added requirement that these data should be gained without prohibitive investment of effort and resources.
This article describes a test of the method of counting fledged broods in lowland woods. Fieldwork aimed to explore the efficacy of counting recently fledged broods, without searching for nests, within areas of woodland where numbers of breeding territories had previously been estimated. These counts are confounded by the detectability of broods which may vary between species, habitats, or any other environmental gradient across which variation in productivity may be assessed. A robust method of assessing productivity through such counts must therefore account for variations in detectability. To do this, we employ an existing mark–recapture type analysis technique in a novel way: brood detection probabilities are calculated from repeated surveys and hence the probability of a brood being present on each territory can be estimated for common species. This in turn provides an insight into when and how often woods need to be visited to achieve a reasonable probability of encountering fledged broods of a particular species and hence provide a robust index of productivity.
METHODS
Study sites
In 2007 we collected data from two woodland plots in each of three counties in lowland England: Hampshire, Leicestershire, and the Norfolk–Suffolk border. To avoid large variation in bird assemblages, all plot sites were of one type of common broadleaf woodland ().While no preliminary assessments of birds were made during site selection, sites needed to have the basic attributes of woods that could provide habitat for a reasonable diversity of birds for us to study, in particular some structural diversity and shrub cover (Fuller & Henderson Citation1992).
Table 1. Characteristics of the larger woodland blocks in which the study sites were situated. All six study sites were composed primarily of lowland mixed broadleaf woodland, NVC W8 or W10 (Rodwell Citation1991), the commonest type of lowland woodland in this region of England (Forestry Commission Citation2003) with other patches of woodland type as indicated. All six study sites were of a similar size (15 ha ± 0.5 ha) and comprised part of the larger blocks as indicated.
Fieldwork was conducted by three bird surveyors, each working more or less full-time in two woods within a region. The survey areas were all single discrete plots of larger blocks (i.e. with two or three non-woodland edges, ).Woods varied in size, but the associated survey areas were set at around 15 ha (), an area at which the probability of encountering some familiar, but less widely distributed woodland species, such as Great-spotted Woodpeckers Dendrocopos major and Marsh Tits Poecile palustris, approaches 100% and at which we would expect to find at least several pairs of many common species (Hinsley et al. Citation1996). Woodlands of this size also suited the resources of the study, in that a surveyor was able to survey two plots in a single day.
Bird surveys
In spring, timed surveys were used to provide an estimate of adult breeding population density in each study wood by employing an established and proven territory mapping technique (Marchant Citation1983). Territory mapping is the most effective method for deriving absolute estimates of numbers of breeding territories within defined woodland study areas (Bibby et al. Citation2000). It avoids biases caused by, for example, the presence of non-breeding birds. Each wood was surveyed at least six times during April and early May, mostly in the morning, but also including two evening visits to maximize the recording of singing thrushes.
Commencing in early May and hence overlapping the period of adult population assessment, we increased the visit rates to woodlands to between four and five times a week until the end of July. Surveyors now looked primarily for signs of breeding and counted fledged broods. Before these surveys began, surveyors familiarized themselves with the brood specific calls of the target species. On each visit, the entire plot was searched systematically using a route which allowed all parts of the plot to be visited. Surveys commenced at several different locations, which were varied between visits, and spent 2–3 hours on each brood count in each wood. More time was spent in woods when there were more broods to record. Territory maps informed brood searches and it was useful to know approximate nest locations for previously identified adult pairs, but nests were not searched for. Encounters with young birds were recorded to give the number of recently fledged broods. The number of individuals in each brood was not sought. Fledged broods were assigned to territories based on their location and on timings using information previously gathered on the adult activities, such as carrying nesting material or food.
Data and analysis
Using values from all six woods, we calculated the overall mean ±1 se of the number of adult pairs calculated for each wood by a single map analyst using standard methods (Marchant Citation1983) and fledged first-broods (using data from four counts per week) for all species detected in all six woods. The number of encounters with individual fledged broods were used to calculate mean encounter rates for each species for each wood and then across all six woods. Similarly, mean values for the number of days over which encounters were made with individual broods (encountered more than once) of each species were calculated for each wood and the mean with errors estimated for all six woods.
The main aim of our analysis was to calculate daily detection probabilities for each species using our survey data on territories and fledged broods in combination with estimates of the fledging to maturity periods. These are the probabilities of detecting a brood in any one survey during the fledging to maturity phase for the particular species, that is, when a brood may be present. To do this we used the mark–recapture type software presence (www.mbr-pwrc.usgs.gov/software/presence.html, MacKenzie et al. Citation2002, Citation2006). The effective number of surveys for broods of each species/wood was derived using the fledging to maturity period of each species/wood from the literature (see ). The number of detections of each brood was the number of visits in which it had been seen. For individual broods observed for longer than the fledging to maturity phase, only encounters within the given period, starting with the first encounter, were used to derive the number of detections.
Table 2. For 19 bird species recorded from all six study sites, the mean number, by wood, of breeding territories and fledged broods (first broods only), mean number of times each brood was seen, mean duration of encounters with these fledged broods (excluding broods encountered only once) ± 1 se in all cases. Fledging to maturity (Fl – Mat) is taken from Cramp (Citation1985, Citation1988, Citation1992) and Cramp & Perrins (Citation1993, Citation1994). The table is ordered by the naive Territory Occupancy Probability (by fledged broods, TOP). Estimated TOPs take into account detectability of fledged broods using detection probabilities (see Methods and ). The naive and estimated TOPs for fledged broods of a species tend to be more different when the Daily Detection Probabilities (DDP) of fledged broods in are low and vice versa. [GS Woodpecker = Great Spotted Woodpecker.]
Using standard brood fledging-to-maturity periods enabled us to ensure that the correct number of ‘zeros’ (visits in which the brood was not detected) was used to estimate daily detection probabilities, even though the age of each brood was not known, i.e. we did not know in how many visits the brood had been missed before the first or after the last time it was detected. Territories where a brood was not detected were included by a case with the number of visits without brood detection, i.e. all zeros.
The presence software also initially calculated for us what it calls the naive occupancy probability for observed fledged broods for each species/wood data point. This is simply the probability of a territory producing a fledged brood (number of fledged broods detected / number of territories surveyed).Throughout this article the term ‘territory occupancy probability’ always refers to the probability of a territory being occupied by a fledged brood.
From this initial calculation, and using the daily detection probabilities for each species/wood, the analysis then estimates a new territory occupancy probability that now includes some fledged broods which the analysis estimates were present but not detected i.e. (number of broods detected + number of broods present but not detected) / number of territories. Therefore, for species for which fledged broods were seen infrequently, the estimated territory occupancy probability will be more different from (always greater than) the naive territory occupancy probability, than for species for which fledged broods were seen frequently.
We also used mean daily detection probability estimates for each species to calculate, taking account again of the fledging to maturity periods, the probability of detecting any one fledged brood on at least one occasion, given a certain weekly frequency of surveying. Therefore, for two visits per week, a species with a fledging period of 14 days would have four visits and the overall detection probability of seeing a brood with a daily detection probability (DDP) would be 1– (1 – DDP)4.
RESULTS
Nineteen species were recorded in all six study woods as adults and/or fledged broods () and hence used in the analysis. One species was recorded in just four woods (Willow Warbler Phylloscopus trochilus), two in three woods (Eurasian Jay Garrulus glandarius and Tawny Owl Strix aluco), plus several others recorded in just one or two woods. Most fledged broods were encountered in a relatively short period between and including the last week of May and the last week of June (Fig. 1). However, broods of some tit and thrush species were recorded throughout May and for most groups the peak of brood sightings was followed by a protracted period of fewer sightings, reflecting the nesting period before fledging of second broods.
The mean number of fledged broods detected in relation to the mean number of territories varied between the 19 ubiquitous species recorded in our study woods (). For Wood Nuthatch Sitta europaea, one brood was seen for each territory in all six woods, while this proportion was lowest for Blackcaps Sylvia atricapilla, Bullfinches Pyrrhula pyrrhula and Garden Warblers Sylvia borin as indicated by the naive fledged-brood territory occupancy probability. The mean number of encounters with fledged broods for each of the 19 species in varied from less than two times for Blackcaps, Dunnocks Prunella modularis, and Common Chiffchaffs Phylloscopus collybita to over four times for Long-tailed Tits Aegithalos caudatus, Marsh Tits, and Wood Nuthatches. The mean duration of encounters with individual broods varied from about 10 to 20 days for most species. The mean number and duration of encounters for the three ubiquitous migrant species (Blackcap, Chiffchaff, Garden Warbler, 1.6 ± 0.3 times and 9.0 ± 1.3 days) was lower than for the 16 ubiquitous resident species as a group (3.1 ± 1.2 times and 17.5 ± 5.7 days) (t = 2.19, df = 17, P = 0.04; t = 2.51, df = 17, P = 0.02, respectively).
For 12 of the ubiquitous species the variation in daily detection probabilities between woods was significant. However, for only four did daily detection probabilities vary between woods within pairs, i.e. with region/observer. For example, Chaffinch daily detection probabilities for individual woods () were just under 0.1 for both woods in Leicestershire but 0.23/0.24 for the other four woods, i.e. significant variation between woods but not within pairs. For Marsh Tits and Long-tailed Tits DDPs were higher in the two Leicestershire woods compared to the other four woods and for Wood Nuthatches and Eurasian Treecreepers Certhia familiaris detection was lower in the Hampshire woodland pair, again with no difference within pairs. Of the seven species that showed no variation between woods, the Garden Warbler DDP was consistently very low while for Bullfinches it was consistently quite high. Of the four species that varied within pairs, Goldcrests Regulus regulus showed very high variation within one wood pair.
Table 3 . Fledged brood Daily Detection Probabilities (DDP) for 19 bird species present in all six study woods (two woods per region). These are the probabilities of detecting a brood in any one survey during the fledging to maturity phase for the particular species (see Methods and ). Differences in probabilities between woods were tested and, when significant, differences within pairs were also tested. Mean DDP ± 1 se using wood-means are also given for each species even if differences between woods were found. This is used in combination with the fledging to maturity period for each species to calculate a mean brood Overall Detection Probability (ODP), the probability of detection at least once when visiting woods four times and two times a week. The table is ordered by ODP. [GS Woodpecker = Great Spotted Woodpecker].
Estimated territory occupancy probabilities (by fledged broods) based on these DDPs varied noticeably from naive territory occupancy probabilities for some species and not others (). Generally, where both detection probabilities and naive territory occupancy probabilities are low (), e.g. for fledged broods of Chiffchaffs, Chaffinches Fringilla coelebs, Dunnocks and Garden Warblers, the difference between the naive and estimated territory occupancy probabilities are at their highest. A very similar value between these two quantities for a particular species indicates each fledged brood was seen frequently (e.g. Treecreepers, Bullfinches, Long-tailed Tits) and/or that the number of broods detected was similar to the territory count (e.g. Marsh Tits, Coal Tits Periparus ater).
Applying our daily detection probabilities to our fledging to maturity estimates from the literature (), we find that broods of only two species, Garden Warblers and Great Spotted Woodpeckers, had a less than 75% chance of being detected (overall detection probability = 0.75) if brood surveys were undertaken four times a week or less than 50% if surveyed just twice a week (). For species with both higher DDPs and longer fledging to maturity periods, such as Nuthatches, Marsh Tits, Goldcrests, Long-tailed Tits, Treecreepers and Bullfinches, the overall detection probability is particularly high.
DISCUSSION
Given the necessary brood identification skills, our fledged-brood searching method was relatively easy to carry out as no nest-finding or bird-handling skills were required. It was not excessively demanding of time or resources and very probably caused less disturbance to the birds than mist-netting or nest monitoring. We found more than two territories per wood on average for 18 of the 19 ubiquitous bird species and broods of each were detected in most woods. Many of these broods were seen more than once during the surveys. While broods of three resident species were encountered relatively infrequently (around or just under twice on average for Chaffinches, Dunnocks and Great Spotted Woodpeckers), resident species overall had greater average brood encounter rates and duration than the three ubiquitous migrant species. Encounters with broods would end as birds matured and juvenile parties broke up, or following dispersal from the survey area or mortality. Generally migrants, plus a few other species such as Dunnocks and Great Spotted Woodpeckers, tend to have shorter fledging to maturity periods than most common residents (Cramp Citation1985, Citation1988, Citation1992, Cramp & Perrins Citation1993, Citation1994, ).
Daily detection probabilities
Using mark–recapture analysis implemented using the software presence allowed us to calculate DDPs for fledged broods in our study woods (MacKenzie et al. Citation2002, Citation2006).
These DDPs were used to estimate territory occupancy probabilities that include an estimated number of missed fledged broods. In the only other study we can find that has applied this kind of analytical approach to reproductive rate in birds, Nichols et al. Citation(2007) also found imperfect detection of young in Spotted Owls Strix occidentalis occidentalis territories and accounted for this using occupancy estimates based on detection probabilities. They were able to survey the territories of the owls throughout the breeding season and analysed these data for this single species using a multistate occupancy model (i.e. looking at overall detection probabilities of breeding adults in known territories and of broods in those territories).
The main assumptions made in calculating our DDPs were that each fledged brood was available to be observed with equal probability each day and that the standard fledging to maturity period for each species we used was broadly representative of the actual period. Regarding the first, it is likely that for some species, daily detection probabilities do change over time during the fledging to maturity phase and it is possible to model that in presence (especially when modelling detection of animals in territories over longer periods of time; MacKenzie et al. Citation2006). In particular we might expect to see detection probabilities influenced in a similar direction (i.e. downwards) during fledging to maturity. However, our multi-species data were not sufficiently fine scale (typically broods were encountered two or three times during a two-week period) to do this and for our comparisons of these probabilities between sites and species it was not necessary. Furthermore, in converting these DDPs (based on the fixed fledging to maturity period) to an overall probability of detecting a brood (given a certain number of visits and therefore again using the same fledging to maturity period) we effectively remove the effect of these time-related assumptions for the overall probability. Regarding the second assumption, it is likely that the standard fledging to maturity periods we used were broadly representative of that actual period because they are mean values based on, usually, many studies (e.g. Cramp 1985). The approach of Nichols et al. Citation(2007) to survey Spotted Owls throughout the breeding season and to calculate an overall detection probability meant they did not need to define a fledging to maturity period. While this approach avoids this assumption we needed to confine our survey period and to calculate DDPs.
Daily detection probabilities of fledged broods varied significantly between woods for 12 of the 19 ubiquitous species studied, possibly due to observer, site, or regional effects. All our surveyors were professional field ornithologists with considerable experience. They were new to systematic surveys of broods but had undertaken some identification learning before the study. However, surveyors may have differing intrinsic abilities to detect broods (e.g. Emlen & DeJong Citation1992). The experience of observers undertaking surveys of breeding birds can affect the outcome of surveys, but not in a consistent direction (i.e. first-time surveyors do not consistently see fewer birds, Eglington et al. Citation2010).
In only four species did daily detection probabilities vary between woods within pairs, i.e. with region or surveyor. While we need to bear in mind that a type II error is possible here, i.e. non-detection of a smaller difference, the wood-mean values presented in are for most species much less likely to vary significantly when woods are from a similar region and surveyed by the same person. Superficially this suggests that the method may be more suitable for studies that involve these kinds of designs (i.e. experimental studies involving a group of similar woods). However, the point of undertaking analysis of DDPs is that variations in detectability can be accounted for by the particular circumstances of a study, and hence provide a productivity estimate that is more robust to variations between individuals and regions.
Frequency of surveys and territory occupancy probabilities
Mean DDPs were over 0.2 for 13 of our 19 species and were lowest for Chaffinches, Great Spotted Woodpeckers, Blackbirds, Dunnocks, Great Tits and Garden Warblers. Although the mean detection probability of the last two species was identical (0.17), the overall likelihood of detecting a Garden Warbler brood is lower than that of a Great Tit brood, because the fledging to maturity phase is much shorter. The likelihood of finding broods when undertaking brood surveys is influenced by the DDP, the number of times surveys are undertaken, and the length of time that young take to reach maturity. Surveys of a particular site, undertaken as frequently as employed here, are onerous and will be beyond the resource of a busy woodland manager or a research programme involving many woods. For 17 of the 19 species in our analysis, the chance of seeing any one brood at least once, and usually several times more, during the fledging to maturity phase (within which 8–12 surveys would have been undertaken), was greater than 75%, and for 13 of them it was around 90% or more. For these survey frequencies and detection levels, estimates of brood territory occupancy probabilities are likely to be very accurate (MacKenzie et al. Citation2002, Citation2006).
Consequently, for applications such as long-term monitoring programmes or research studies involving numerous sites, fewer surveys may be appropriate. Our data suggest that searching for fledged broods twice a week throughout the main fledging period for 17 of the 19 species will provide a greater than 50% chance of encountering broods. At this kind of level, combined with the territory mapping data, the fledged-brood data can still provide an accurate estimate of the post-nesting fledging success for many of these species. MacKenzie et al. Citation(2002) used simulation models to show that undertaking surveys five times in total can provide very accurate estimates of occupancy probabilities when daily detection probabilities are around 0.3 or higher. In our study, daily detection probabilities were around 0.3 or more for seven species. This suggests that, for woodland bird species with fledging to maturity periods of around 2 weeks, as is the case for most of these species, two visits per week is certainly an adequate level of surveying.
MacKenzie et al. Citation(2002) suggest that for DDPs of <0.15, territory occupancy probabilities can be underestimated when the true value is very high (0.9 or more), and overestimated when it is in the 0.5–0.7 band. However, for only two species in our study (Great-spotted Woodpeckers and Garden Warblers) was the mean daily detection probability this low, although for four species (Blackbirds, Dunnocks, Great Tits and Chaffinches) it was between 0.17 and 0.20. For three of these (not including Great Tits, which have an exceptionally long fledging period), interpretation of our data in the context of the simulations by MacKenzie et al. (2002) suggests that two visits per week may also lead to slightly overestimated territory occupancy probabilities. Depending on the objectives, three visits per week may be more appropriate for a study that focuses on these birds. For the other 14 common woodland bird species, our detection probability estimates strongly suggest that brood searches undertaken in woodland twice a week will provide accurate estimates of fledged-brood territory occupancy probabilities.
Timing of surveys
Our 2007 data suggest a brood survey period that began with the last week in May and continued until the end of June would cover the busiest period for fledged first-broods in these woodlands (). However, broods of some species would have been missed had we done this; for example, & 3 indicate that there were some early broods of Song Thrushes, Blackbirds and Long-tailed Tits.
Figure 1. The mean number (± 1 se) of fledged broods encountered per visit to each wood by week; resident species and migrant species. Species occurring in all six woods. See .
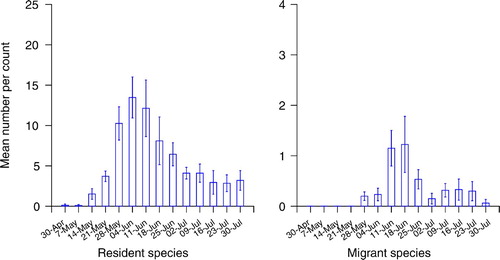
Figure 2. The mean number (± 1 se) of fledged broods encountered per visit to each wood by week; Thrushes and Wren.
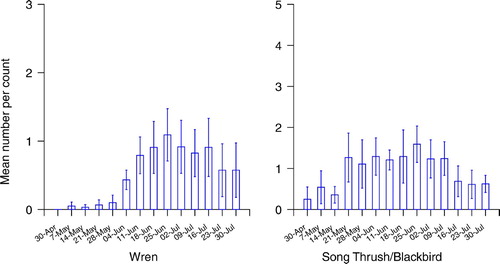
Figure 3. The mean number (± 1 se) of fledged broods encountered per visit to each wood by week; Long-Tailed Tits and other tit species.
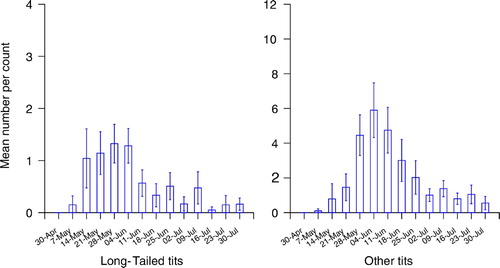
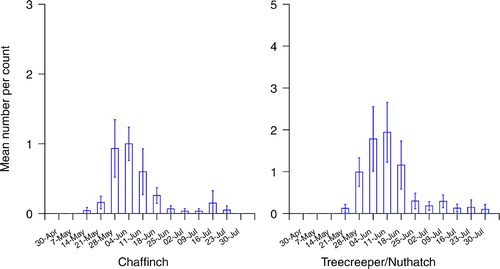
Figure 4. The mean number (± 1 se) of fledged broods encountered per visit to each wood by week; Treecreepers and Nuthatches combined and Chaffinches.
This busy period for fledged broods in our study was consistent with current predictions on mean egg laying dates for our woodland species from the BTO's Nest Record Scheme (Baillie et al. Citation2010). However, year-to-year variations in timing of breeding can be considerable, dependant on the weather, particularly temperature. The timing of egg-laying has actually shown a trend over time in recent decades, to earlier laying in response to warmer springs (Crick & Sparks Citation1999). Survey start dates need to take account of possible early fledging in warmer springs. A few missed early broods may not be significant, in a study or long-term monitoring programme, particularly when comparing between sites or years on the same basis.
Conclusions and further work
The method investigated here provides a labour-efficient way of determining, for some common woodland bird species in discrete woodland areas, a parameter that is otherwise difficult to measure in an unbiased way. Broods of most species are detected using as few as twice-weekly fledged-brood searches during the main fledging season. These data can be used to calculate detection probabilities and hence to estimate actual fledged-brood territory occupancy probabilities. While fledged-brood detection probabilities can vary between sites, our data provide some insight into this. Fledged-brood searches rely on visual and aural detection techniques, so the field methods employed could be applied to most woodland situations in which territory mapping can also be undertaken.
There are various potential applications for this method. In research, there have been few studies of, for example, the role of predators or food availability on the population dynamics of woodland birds (Fuller et al. Citation2005, Nicoll & Norris Citation2010). The application of a method like this may allow properly replicated yet affordable studies of these processes. For example, in terms of monitoring specific sites over time, a woodland ranger may want to identify the benefit to breeding birds of habitat management work, and it is possible that fledged brood counts undertaken twice a week may show a response when standard spring assessments of adults do not. Potentially this is a valuable method for studying breeding phenology in any situation where it is not practical to find nests, or simply for gathering evidence of breeding.
Similarly, the method could be used in large-scale monitoring programmes of breeding success in woodland birds.
Counting fledged broods in woodlands provides no information on the cause or stage of nest failure. We did not attempt to assess the number of young present in each fledged brood because it was usually too time-consuming and, for many species, too difficult. We therefore provide no information on partial nest losses or an overall young to old ratio. However, it may be possible to do this, at least for some species. Territory occupancy probabilities could also be modelled as a function of territory specific covariates. It would also be possible to look at occupancy models where detection probabilities vary with time within a fledging to maturity period or during the season. This would require more detailed studies of individual species. It may be useful to refine further the actual fledged-brood count method, to look at using transect surveys rather than whole area searches, for example. It could be that certain types of woodland not included in our study sample have particularly low (or high) detection probabilities for fledged broods and it would be useful to look at this, and the relationship between brood movements and woodland size, particularly in relation to monitoring programmes. It would be useful to understand the causes of variance in detection probabilities for species in different woods, in particular the relationship between brood movements and woodland size. Information on the applicability of the method to less common woodland species would also be useful. We also need to remember that changes in productivity in woodland birds are not necessarily reflected in breeding population size, if this is of interest (Newton Citation1992, Citation1998). A provisional unpublished pilot study suggests the method may be suitable for assessing breeding success in birds in farmland hedgerows and it may also be suitable in urban gardens.
ACKNOWLEDGEMENTS
This study was funded by the European Squirrel Initiative and Lord Barnby's Foundation. We are grateful to the owners of the six woodlands used in this study, and to the editor and two reviewers for their constructive comments.
REFERENCES
- Baillie , S. R. 1990 . Integrated population monitoring of breeding birds in Britain and Ireland . Ibis , 132 : 151 – 166 .
- Baillie , S. R. , Marchant , J. H. , Leech , D. I. , Joys , A. C. , Noble , D. G. , Barimore , C. , Grantham , M. J. , Risely , K. and Robinson , R. A. 2010 . Breeding Birds in the Wider Countryside: Their Conservation Status 2009 BTO Research Report No. 541. BTO, Thetford. http://www.bto.org/birdtrends
- Bart , J. 1977 . Impact of human visitations on avian nesting success . Living Bird , 16 : 187 – 192 .
- Bibby , C. J. , Burgess , N. D. , Hill , D. A. and Mustoe , S. 2000 . Bird Census Techniques , 2 , London : Academic Press .
- Clark , J. A. , Robinson , R. A. , Clark , N. A. and Atkinson , P. W. 2006 . “ Measuring wader recruitment ” . In Waterbirds Around the World , Edited by: Boere , G. C. , Galbraith , C. A. and Stroud , D. A. 488 – 489 . Edinburgh : The Stationery Office .
- Cramp , S. (ed.) . 1985, 1988, 1992 . Birds of the Western Paleartic Vols. 4, 5, 6 , Oxford : Oxford University Press .
- Cramp , S. and Perrins , C.M. 1993, 1994 . Birds of the Western Paleartic Vols. 7, 8 , Edited by: Cramp , S. and Perrins , C.M. Oxford : Oxford University Press .
- Crick , H. Q.P. and Sparks , T. H. 1999 . Climate change related to egg-laying trends . Nature , 399 : 423 – 424 .
- Crick , H. Q.P. , Baillie , S. R. and Leech , D. I. 2003 . The UK Nest Record Scheme: its value for science and conservation . Bird Study , 50 : 254 – 270 .
- DeSante , D. F. , Williams , O. E. and Burton , K. M. 1993 . “ The Monitoring Avian Productivity and Survivorship (MAPS) program: overview and progress ” . In Status and Management of Neotropical Migrant Birds , Edited by: Finch , D. M. and Stangel , P. W. 208 – 222 . USDA Forest Service Publication: GTR RM-229, Fort Collins, CO .
- Eaton , M. A. , Brown , A. F. , Noble , D. G. , Musgrove , A. J. , Hearn , R. D. , Aebischer , N. J. , Gibbons , D. W. , Evans , A. and Gregory , R. D. 2009 . Birds of Conservation Concern 3: the population status of birds in the United Kingdom, Channel Islands and the Isle of Man . Br. Birds , 102 : 296 – 341 .
- Eglington , S. M. , Davis , S. E. , Joys , A. C. , Chamberlain , D. E. and Noble , D. G. 2010 . The effect of observer experience on English Breeding Bird survey population trends . Bird Study , 57 : 129 – 141 .
- Emlen , J. T. and DeJong , M. J. 1992 . Counting birds: the problem of variable hearing abilities . J. Field Ornithol , 63 : 26 – 31 .
- Forestry Commission . 2003 . National Inventory of Woodland and Trees: Great Britain , Edinburgh : Forestry Commission .
- Fuller , R. J. and Henderson , A. C.B. 1992 . Distribution of breeding songbirds in Bradfield Woods, Suffolk, in relation to vegetation and coppice management . Bird Study , 39 : 73 – 88 .
- Fuller , R. J. , Noble , D. G. , Newson , S. E. and Baillie , S. R. 2005 . Recent declines in populations of woodland birds in Britain: a review of possible causes . Br. Birds , 98 : 116 – 143 .
- Game & Wildlife Conservation Trust . 1996 . The Annual Partridge Count Scheme: August Brood Count Recording Form and Instructions , Fordingbridge : The Game & Wildlife Conservation Trust .
- Gilbert , G. , Gibbons , D. W. and Evans , J. 1998 . Bird Monitoring Method: A Manual of Techniques for Key UK. Species RSPB, Sandy
- Hewson , C. M. and Fuller , R. J. 2003 . Impacts of Grey Squirrels on Woodland Birds: An Important Predator of Eggs and Young? BTO Research Report 328. British Trust for Ornithology, Thetford
- Hewson , C. , Fuller , R. , Mayle , B. and Smith , K. 2004 . Possible impacts of Grey Squirrels on birds and other wildlife . Br. Wildlife , 15 : 183 – 191 .
- Hewson , C. M. , Amar , A. , Lindsell , J. A. , Thewlis , R. M. , Butler , S. , Smith , K. and Fuller , R. J. 2007 . Recent changes in bird populations in British broadleaved woodland . Ibis , 149 : 14 – 28 .
- Hinsley , S. A. , Bellamy , P. E. , Newton , I. and Sparks , T. H. 1996 . Influences of population size and woodland area on bird species distributions in small woods . Oecologia , 105 : 100 – 106 .
- Johnson , M. D. 2007 . Measuring habitat quality: a review . Condor , 109 : 489 – 504 .
- Lambeck , R. H.D. 1990 . The applicability of age ratio and brood size counts in population dynamic studies of the Brent Goose. Branta b. bernicla. Ardea . 78 : 414 – 425 .
- Lynch , J. J. and Singleton , J. R. 1964 . Winter appraisals of annual productivity in geese and other waterbirds . Wildfowl Trust Annual Report , 15 : 114 – 126 .
- MacKenzie , D. I. , Nichols , J. D. , Lachman , G. B. , Droege , S. , Royle , J. A. and Langtimm , C. A. 2002 . Estimating site occupancy rates when detection probabilities are less than one . Ecology , 83 : 2248 – 2255 .
- MacKenzie , D. I. , Nichols , J. D. , Royle , J. A. , Pollock , K. H. , Bailey , L. L. and Hines , J. E. 2006 . Occupancy Estimation and Modelling – Inferring Patterns and Dynamics of Species Occurrence , Elsevier Publishing, London .
- Marchant , J. H. 1983 . BTO Common Birds Census Instructions , Tring : BTO .
- Martin , T. E. , Paine , C. R. , Conway , C. J. , Hochachka , W. M. , Allen , P. and Jenkins , W. 1997 . BBIRD Field Protocol , Montana , , USA : Montana Cooperative Wildlife Research Unit, University of Montana, Missoula .
- Newson , S. E. , Leech , D. I. , Hewson , C. M. , Crick , H. Q.P. and Grice , P. V. 2010 . Potential impact of Grey Squirrels Sciurus carolinensis on woodland bird populations in England . J. Ornithol , 151 : 211 – 218 .
- Newton , I. 1992 . Experiments on the limitation of bird numbers by territorial behaviour . Biol. Reviews , 67 : 129 – 173 .
- Newton , I. 1998 . Population Limitation in Birds , London : Academic Press .
- Nichols , J. D. , Hines , J. E. , MacKenzie , D. I. , Seamans , M. E. and Gutierrez , R. J. 2007 . Occupancy estimation and modeling with multiple states and state uncertainty . Ecology , 88 : 1395 – 1400 .
- Nicoll , M. and Norris , K. 2010 . Detecting an impact of predation on bird populations depends on the methods used to assess the predators . Method. Ecol. Evol , 1 : 300 – 310 .
- Peach , W. J. , Buckland , S. T. and Baillie , S. R. 1996 . The use of constant effort mist-netting to measure between-year changes in the abundance and productivity of common passerines . Bird Study , 43 : 142 – 156 .
- Potts , G. R. 1986 . The Partridge: Pesticides, Predation and Conservation , London : Collins .
- Robinson , R. A. , Freeman , S. N. , Balmer , D. E. and Grantham , M. J. 2007 . Cetti's Warbler: analysis of an expanding population . Bird Study , 54 : 230 – 235 .
- Robinson , R. A. , Julliard , R. and Saracco , J. F. 2009 . Constant effort: studying avian population processes using standardized ringing . Ring. Migr , 24 : 199 – 204 .
- Rodwell , J. S. 1991 . British Plant Communities, Vol 1: Woodlands and Scrub , Cambridge University Press : Cambridge .
- Schaefer , T. 2004 . Video monitoring of shrub nests reveals nest predators . Bird Study , 51 : 170 – 177 .
- Stake , M. M. , Faaborg , J. and Thompson , F. R. 2004 . Video identification of predation at Golden-cheeked Warbler nests . J. Field Ornithol , 75 : 337 – 344 .
- Thompson , F. R. 2007 . Factors affecting nest predation on forest songbirds in North America . Ibis , 149 ( suppl. 2 ) : 98 – 109 .
- U.S. Fish and Wildlife Service . 1977 . Standard Operating Procedures for Productivity Surveys of Geese, Swans and Brant U.S. Fish and Wildlife Service, Washington, DC
- Vanhinsbergh , D. , Gough , S. , Fuller , R. J. and Brierley , E. D.R. 2002 . Summer and winter bird communities in recently established farm woodlands in lowland England . Agric. Ecosyst. Environ , 92 : 123 – 126 .
- Weidinger , K. 2009 . Nest predators of woodland open-nesting songbirds in Central Europe . Ibis , 151 : 352 – 360 .