
Abstract
Capsule Territory density of the Dusky Orange-crowned Warbler Oreothlypis celata sordida, endemic to the California Channel Islands, USA, varied with vegetation greenness and oak coverage on Santa Catalina Island.
Aims To model factors affecting territory density of warblers on Santa Catalina Island.
Methods Breeding warblers were monitored in a dry and a more mesic habitat on the island in 2006–2008 and modelled using a GIS tool to predict territory density. Data of three-year territory boundaries with ecological covariates were used to develop a regression tree and project the distribution of territory density on an island-wide scale. The fitted model was indirectly evaluated using the island-wide point counts.
Results The territory density of warblers differed between mesic and xeric habitats in response to oak coverage and food abundance in oaks. In the model, Normalized Difference Vegetation Index and oak coverage were the best predictors. Individual density estimates from distance sampling were comparable with the model prediction.
Conclusion Plot-based surveying and statistical modelling provided an insight on how breeding warblers responded to resource abundance. This approach may facilitate the management of these insular birds that are highly dependent on oak habitats on the island where habitat loss has been occurring due to anthropogenic fire.
Many theoretical and empirical studies have sought to discover which abiotic and biotic factors influence abundance and habitat selection of a species (Block & Brennan Citation1993, Jones Citation2001). The distribution and abundance of a species may be constrained due to a wide range of microclimate factors, vegetation structure, food availability, conspecific interactions, interspecific competition, predation risk, and/or even phylogenetic constraints (Cody Citation1978, Smith & Shugart Citation1987, Root Citation1988, Stamps Citation1988, Suhonen et al. Citation1994, Bollinger Citation1995, Forstmeier et al. Citation2001). Furthermore, studies of the relationship between species abundance and these environmental components play an important role in developing wildlife habitat modelling approaches (Johnson Citation1980, van Horne & Weins Citation1991), which can then provide informative criteria for studying habitat selection processes in conservation biology and species management.
The Orange-crowned Warbler Oreothlypis celata is a territorial and socially monogamous New World paruline, and its breeding range covers the western and northern parts of North America (Sogge et al. Citation1994). The species prefers habitats with shrubs and low vegetation, often in patchy oak or aspen forest, or in riparian areas or chaparral (Sogge et al. Citation1994). Wooded habitat with understory provides suitable conditions for the Orange-crowned Warbler's nest that is built on or off the ground (Sogge et al. Citation1994). Males defend territories for foraging and nesting during the breeding season (i.e. Type A territory; Nice Citation1941) with some year-to-year variations in their boundaries (Sogge et al. Citation1994; see also Yoon et al. Citation2012, Citation2013). Their territory sizes are likely to be determined by habitat quality for foraging and nesting (Sogge et al. Citation1994). Within the species, four subspecies (O. c. celata, O. c. lutescens, O. c. orestera, and O. c. sordida) are also recognized that differ in plumages, moult patterns, breeding distributions, migratory routes, and life histories (Sogge et al. Citation1994; see also Horton et al. Citation2010, Yoon et al. Citation2012, Citation2013, Sofaer et al. Citation2013). For example, most subspecies are strongly migratory, but O. c. sordida (hereafter Dusky Orange-crowned Warbler) is endemic to the California Channel Islands, representing the southern edge of the breeding range of the species: Dusky Orange-crowned Warblers breeding along and off the California coast may move only short distances to the mainland during the non-breeding season (Sogge et al. Citation1994).
Grazing by non-native herbivores, fires and development have altered the landscape of Santa Catalina Island, one of the California Channel Islands, over the past 150 years (Knapp Citation2002, Keeley Citation2006). Wildlife habitats on the island are also affected by variation in annual precipitation, which frequently results in a series of extreme dry and wet seasons (Schonher & Nicholson Citation1989). The interactive effect of a Mediterranean climate and human-related activities has led to an altered fire regime, resulting in a significant loss of wildlife habitat (Lynch & Johnson Citation1974, Keeley Citation2006). The aims of this study were to model spatial variation in territory density using a multiple-year territory boundary data set as a function of abiotic and biotic factors (i.e. measures of habitat suitability) and to project these results to the landscape level to estimate the distribution of territory density across the entire island. Then, I indirectly evaluate the predictions of the model using an island-wide distance sampling data of Dusky Orange-crowned Warblers' abundance. Finally I discuss the potential loss of Dusky Orange-crowned Warbler habitats due to past fires on this insular environment.
METHODS
Study area and species
I studied Dusky Orange-crowned Warblers breeding on a 28-ha plot along a mesic–xeric habitat gradient in Bulrush Canyon on Santa Catalina Island, southern California, USA (33°22′30″N, 118°25′56″W) in three consecutive years (March–May 2006–2008). The warblers on this island were mostly single-brooded, and the males established and consistently defended territories during the breeding season (February to mid-May or June). The two habitats in succession were arrayed along a habitat gradient: one 14-ha plot was located in mesic vegetation along the canyon bottom, with relatively tall and dense Island Scrub-oak Quercus pacifica woodland (82.1% of total mesic area), and the other 14-ha plot was situated on the canyon's south-facing and xeric slope, which had shorter-stature and sparse oak woodland (55.3% of total xeric area). Common plant species included the Island Scrub-oak, Toyon Heteromeles arbutifolia, Lemonade Berry Rhus integrifolia, California Sagebrush Artemisia californica, Black Sage Salvia mellifera, Willow Salix sp., Mule Fat Baccharis salicifolia, Coyote Bush Baccharis pilularis, Chamise Adenostoma fasciculatum, Harding Grass Phalaris aquatica, and a range of other native and non-native grasses (see also Minnich Citation1980).
Habitat-related characteristics of Dusky Orange-crowned Warblers
To assess the differences in food abundance between the mesic–xeric habitats, I observed foraging behaviour of the warblers including plant substrates and then sampled insects from the major plant substrate. Foraging behaviours were first recorded between 0600 and 1200 PDT (March–May 2006–2007) to determine the per cent use of oaks and other plant species by Dusky Orange-crowned Warblers. I visually located a focal individual (see below for marking individuals), using 8 × 40 binoculars, and waited 10 seconds before recording its foraging behaviour (i.e. the plant species that was used in each foraging bout; see Dobbs et al. Citation2007). The observation effort per individual lasted between 30 seconds and 5 minutes, but generally not more than 2 minutes. I did not take multiple observations from one focal individual on the same day, and the average number of observations per focal individual was 2.0 ± 0.2 se per season, ranging from one to seven observations per individual, per season (i.e. 193 foraging observations from 88 individuals for two breeding years).
To examine the difference in food abundance between the two habitats, I used a branch clipping method (Johnson Citation2000) to quantify habitat-specific Lepidopteran larvae (hereafter caterpillar) biomass in Q. pacifica on the study plots. Dusky Orange-crowned Warblers are insectivorous, mainly foraging on caterpillars in the canopy of oaks on Santa Catalina Island (Sogge et al. Citation1994). Once every two weeks from March to May (2006–2007), I sampled approximately 0.5 m3 of vegetation (i.e. an oak crown including leaves and branches) from 24 randomly selected oak trees (i.e. 12 oak trees per habitat), which were placed in plastic bags in a 0°C freezer for approximately one week to prevent the loss of live arthropods. All arthropods were then manually separated from the vegetation and returned to the freezer for later processing; vegetation (i.e. leaves only) was weighed to the nearest mg (hereafter wet leaf mass) and discarded. Caterpillars were manually sorted from other arthropods, dried in an 80°C oven for 24 hours, and weighed (hereafter caterpillar dry biomass). I used caterpillar dry biomass (mg) that was standardized by wet leaf mass (g) as an index of Dusky Orange-crowned Warbler food availability. I used a linear mixed model to compare food abundance between the two plots, controlling for each year as a random effect in SPSS version 13 (SPSS Inc., 2004, Chicago, IL).
To facilitate individual identification and territory mapping for territory density (the number of territories/ha), Dusky Orange-crowned Warblers on both habitats were captured with mist-nets, individually banded with a unique combination of three colour leg bands and a US Geological Survey, numbered aluminium leg band, and classified by sex and age based on plumage and morphological characters (Pyle Citation1997). The study plot was delineated into 25 m × 25 m grids with flagging to facilitate mapping of Dusky Orange-crowned Warbler's territories (; see also Kirsch et al. Citation2007). All territories were mapped by observing territorial disputes and movements of banded males and females throughout the breeding season. In the field, I marked the location of individuals on a high-resolution aerial photograph and the points were entered and updated in ArcGIS 9.1 (ESRI Inc., 2005). Territory boundaries were delineated with the minimum convex polygon method (Ford & Myers Citation1981).
Figure 1. Illustration of the neighbourhood scale over which territory density was calculated as a dependent variable. The number of territories over a neighbourhood areas (dotted circles) was calculated, which was determined by averaged nearest neighbour distance from the randomly selected sampled grid. Grey polygons indicate individual territories, filled circles show sampled grids, and unfilled circles illustrate centres of territories.
I found Dusky Orange-crowned Warbler's nests on territories in each breeding season and monitored them once every two days to measure reproductive success (i.e. clutch size and number of fledglings). I used a two-tailed t test to compare annual territory density (territories/ha) between the two habitats and a linear mixed model (restricted maximum likelihood) to compare territory size, clutch size, and the number of fledglings between the two habitats, controlling for each year as a random effect in SPSS version 13.0.
Dependent variable and predictors in the model
To generate a response variable in the regression tree (RT) model, an alternative technique to traditional statistical methods (Breiman et al. Citation1984, Ripley Citation1996, Elith et al. Citation2006), I used the three-year territory map data set to calculate mean territory size and determine a Dusky Orange-crowned Warbler's neighbourhood scale (see below for the extent of neighbourhood) in GIS, which allowed us to measure variation in territory density as a numerical dependent variable. Recently, classification and RTs have been used in modelling wildlife habitats due to advantages including flexibility to include a variety of response variable types, insensitivity to the types of explanatory variables used, ease and robustness of tree construction, and easy interpretation (De'ath & Fabricius Citation2000, Fan et al. Citation2006). Territory density was counted from the randomly selected grid points in a neighbourhood scale along the habitat gradient (). Here, the extent of neighbourhood was defined using the diameter (i.e. 42 m) of average territory area over both study plots, which was a circular polygon with the radius of 42 m to count neighbouring territories at the centre of a neighbourhood (i.e. four times larger than average territory area; Estep et al. Citation2005). The dependent variable in the RT model was territory density as estimated by the number of intersected centres of territories within the neighbourhood polygons from 20 randomly selected grid points per study plot and per season (). Thus, a total of 120 territory densities over 40 randomly selected neighbourhoods for three years were used in the RT model.
To build the initial RT model, I obtained model predictors from six raster data sets including abiotic (i.e. topography) and biotic (i.e. productivity and food resource) factors presumed to affect the habitat quality of the study species on Santa Catalina Island. Four topographic elements were: (1) aspect (a categorical variable in eight cardinal directions), (2) slope (a continuous variable in degrees), (3) hillshade reflecting the interactive effect of aspect and slope of the terrain (relative to the sun's azimuth and sun's altitude) derived from a 10 m × 10 m digital elevation model raster data set, and (4) landform (a categorical variable of canyons, north-facing/sheltered slopes, northeast-/northwest-facing slopes, east-/west-facing slopes, southeast-/southwest-facing slopes, and south-facing/exposed ridges) reflecting variation in potential insolation influenced by a combination of aspect, slope, hillshade, and Topographic Position Index (TPI; adapted from Weiss Citation2001). These four topographic attributes were anticipated to play a key role in determining a moisture gradient influenced by the intensity of received solar radiation on the mesic–xeric study plots. The last two ecological predictors were: (5) Normalized Difference Vegetation Index (NDVI) reflecting the degree of greenness in vegetation, calculated from the near infra-red (NIR) and red (R) spectral bands as NDVI = (NIR − R)/(NIR + R) using a 5 m × 5 m IKONOS satellite image, photographed in May 2005 (see Kumar & Monteith Citation1982, Goward & Huemmrich Citation1992 for the formula). Although NDVI in just one specific period was used for the analysis, this was anticipated to provide sufficient information on the distribution of woody plants that were less variable seasonally during the warbler's breeding season, excluding grass and/or forbs that were mostly dried up in May. (6) Oak coverage (%) was derived from a GIS layer of community-level vegetation classification (0.4 m × 0.4 m resolution; Knapp Citation2005) constructed by the Catalina Island Conservancy (hereafter CIC). All calculations and data acquisition were performed with Hawth's Analysis Tool (Beyer Citation2004) in ArcGIS.
Model calibration
The full RT model considered six predictors (i.e. aspect, slope, hillshade, landform, NDVI, and per cent oak coverage) of territory density. To select a best-fitting RT model, territory density was consecutively partitioned into two exclusively homogeneous groups by a series of if-then split conditions of the six predictors (Breiman et al. Citation1984, Ripley Citation1996). The size of the final RT was determined by minimal cost-complexity pruning (i.e. selecting the optimal-sized tree). That is, controlling for the tree size, the number of splits was indirectly controlled by parameter complexity (cp ) that puts a cost on each additional split, where splitting stops when increases in cost outweigh reduction in misclassification rates. All analytical procedures for building a RT model were conducted using Package rpart (recursive partitioning and RT; Therneau & Atkinson Citation1997) in Program R (R Development Core Team Citation2009). The best-fitting RT model was used in the Spatial Analyst's Raster Calculator module in ArcGIS to generate a map of territory density on an island-wide scale.
Indirect model evaluation
I indirectly evaluated the projected territory density from the best-fit RT model using an independent data set, an island-wide point count survey conducted by the CIC in mid-May of 2002–2006. The CIC systematically established 80 permanent survey points across the island; the survey points were at least 400 m apart (mean distance = 717 m). A survey team of one observer and one data recorder conducted 5-minute bird counts (i.e. species, number of individuals, and distance) between 0600 and 1000 PDT. Dusky Orange-crowned Warblers, including other avian species, were detected with both visual and auditory cues, although due to the cryptic behaviour of the study species, the great majority of individuals were detected by vocalizations. The breeding season of Dusky Orange-crowned Warblers typically starts declining in terms of song activity in May on Santa Catalina Island (Yoon et al. Citation2012); most individuals, including males, females, and juveniles, communicate vocally via call or chip notes (J. Yoon, pers. obs.). Therefore, the CIC distance sampling surveys counted not only singing males but also females and juveniles.
I used Program DISTANCE (Thomas et al. Citation2009) to estimate individual density (individual/ha) from the CIC data set, and assumed the following distance sampling criteria (Buckland et al. Citation2001): (1) perfect detectability at zero distance from a survey point; (2) no movement in response to observers during the survey period; and (3) accurate measurement of direct distances from a survey point. Some violations in these assumptions might possibly have occurred when estimating a large distance during the simultaneous survey, although the study species exhibited conspicuous vocalizations of calls (i.e. chips) and songs (see also Yoon et al. Citation2012) allowing easy spatial location of calling birds in most cases. Prior to model fitting, I inspected the histograms of survey distances and truncated obvious right-sided outliers beyond 100 m to provide a better fit of detection functions to the distance sampling data. I then used the natural breaks tool in ArcGIS (Jenks’ Citation1967, optimization algorithm) to post-stratify the 80-point count circles into three habitat types based on predicted individual density from the best-fit RT model: low (less than 1.60 territories/ha, n = 38), intermediate (1.60–2.87 territories/ha, n = 27), or high (2.87–4.26 territories/ha, n = 15). I used half-normal and hazard-rate detection functions with three adjustment terms (cosine, simple polynomial, and hermite polynomial; Buckland et al. Citation2001) to estimate individual density separately for low, intermediate, and high habitats and for the entire island without habitat classes. Thus, I fitted the four model sets, each with the six candidate models for detectability. The most parsimonious detection function within each set of six candidate models was selected with second-order Akaike's Information Criterion corrected for small sample size (AICc; Burnham & Anderson Citation2002), and the fit of each candidate model was assessed with a Goodness of Fit (GoF) χ2 test (Buckland et al. Citation2001). In the low-density stratum, the hazard-rate key function with cosine and hermite polynomial adjustments fitted the data for detection function, where the probability of GoF χ2 tests (df = 7) ranged from 0.17 to 0.92. In the intermediate-density stratum, the hazard-rate key function with three adjustments fitted the data for detection function where the probability of GoF χ2 tests (df = 7) ranged from 0.01 to 0.36. In the high-density stratum, the hazard-rate key function with three adjustments fitted the data for detection function where the probability of GoF χ2 tests (df = 7) ranged from 0.09 to 0.95. Detection probability means decreased from low- (0.28, ranging from 0.18 to 0.45) to intermediate- (0.16, ranging from 0.06 to 0.33) and high-density strata (0.12, ranging from 0.06 to 0.16). I estimated island-wide individual density of the study species (the number of individuals/ha) and also examined its year-to-year variation for 2002–2006 in relation to annual precipitation from to
(adapted from Morrison & Bolger Citation2002).
RESULTS
Habitat-related characteristics of Dusky Orange-crowned Warblers
Foraging behaviour was similar in the two habitats: Island Scrub-oaks were the primary foraging substrate used by Dusky Orange-crowned Warblers (mesic: 86.9% of total foraging observations, n = 282; xeric: 92.9%, n = 99. Food abundance, territory density, and reproductive output of Dusky Orange-crowned Warblers were different, however, between mesic canyon bottoms and xeric uplands in Bulrush Canyon. First, caterpillar biomass on Island Scrub-oaks was significantly greater in the mesic (0.44 ± 0.07 se mg/g) compared to the xeric habitat (0.13 ± 0.07 se mg/g; linear mixed model: F 1,218 = 12.4, P < 0.01). Second, territory density was significantly higher in the mesic habitat compared to that on the xeric habitat (mesic: 4.41 ± 0.40 se territories/ha; xeric: 1.85 ± 0.17 se territories/ha; two-tailed t test: t 4 = 5.3, P = 0.01). Third, territory size was significantly smaller in the mesic habitat (0.11 ± 0.01 se ha) compared to the xeric habitat (0.23 ± 0.02 se ha; linear mixed model: F 188.3 = 64.7, P < 0.001). There were no significant differences in either clutch size (mesic: 3.52 ± 0.08 se eggs/clutch; xeric: 3.40 ± 0.12 se eggs/clutch; linear mixed model: F 1,84 = 0.7, P = 0.39) or number of young fledged (mesic: 1.56 ± 0.50 se fledglings/nest; xeric: 1.02 ± 0.56 se fledglings/nest; linear mixed model: F 1,82.1 = 1.9, P = 0.17) between the two habitats in two combined years of 2006 (35 nests in mesic vs. 12 nests in xeric) and 2008 (26 nests in mesic vs. 13 nests in xeric).
Territory density model
The best-fit RT model had a cross-validated error rate of approximately 1.19 (root node error rate × potential misleading error; a) and predicted territory density as a function of two variables, NDVI and per cent oak coverage (b). Collectively, the areas containing more dense vegetation (i.e. higher NDVI value) as well as higher per cent oak coverage were associated with higher territory density on the plot-based study. Projection of the RT model indicated that 38.0% of the island was low-density habitat (<1.60 territories/ha), 20.4% was intermediate-density habitat (1.60–2.87 territories/ha), and 41.6% was high-density habitat (>2.87 territories/ha; ). This model predicted an island-wide mean breeding density of 1.92 territories/ha (±1.04 sd).
Figure 2. Graphical summary of model calibration for the RT model to predict territory density of Dusky Orange-crowned Warblers in Bulrush Canyon, Santa Catalina Island, California, USA, in 2006–2008. (a) Cross-validated relative error rate as a function of the number of splits; the best-fitting model has two splits and exhibits the minimum misclassification rate and the smallest tree size. (b) Decision tree for the best-fit RT predicting neighbourhood density in relation to NDVI and oak coverage (%); splits are labelled with conditional cut-off values (e.g. If NDVI is less than 0.10, then territory density is 0.75 territories/neighbourhood. Otherwise, it is 2.36 territories/neighbourhood); nodes denote the predicted number of territories within a neighbourhood scale (with the converted territory density/ha in parentheses); and the number of cases assigned to parameterize the model (n).
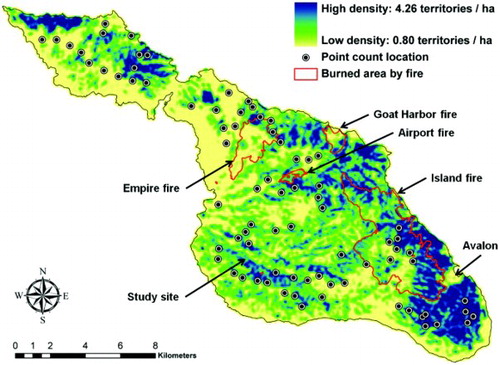
Figure 3. Territory density of breeding Dusky Orange-crowned Warblers on Santa Catalina Island as predicted by the best-fit RT model. Black dots indicate point count survey locations. Red polygons delineate areas burned by wildfires in 1999–2007.
Model evaluation using distance sampling density estimates
The CIC landbird survey detected 505 individuals of Dusky Orange-crowned Warblers in May 2002–2006. Estimated individual densities from Program DISTANCE were comparable to predicted territory densities from the RT model (). Island-wide mean individual density was 2.89 individuals/ha weighted by five-year strata (95% log-based confidence interval (CI): 2.30–3.64). Detection probability was low, averaging 0.13, and ranging from 0.01 to 0.21. The hazard-rate key function with three adjustments fitted the data for detection function where the probability of GoF χ2 tests (df = 7) ranged from 0.11 to 0.79 over the five-year data.
Figure 4. Indirect evaluation of the RT model using habitat-specific distance sampling density estimates: territory density from the RT model and individual density from the distance sampling analyses. Each bar represents mean density estimate with 95% CIs with the number of survey points (see results for the statistics).
The post-stratified distance sampling analysis estimated that individual density in both the intermediate- and high-density strata was higher than territory density predicted by the RT model (). However, five-year individual density estimates from DISTANCE followed the same pattern as the prediction from the RT model (i.e. low- < intermediate- < high-density habitats; ). Density estimates also varied between years (). Two wet years (2003 and 2005) had higher estimated individual density than the five-year average (2.89 individuals/ha) whereas two dry years (2002 and 2004) had below-average density estimates, relatively.
Table 1. Estimated individual density of Dusky Orange-crowned Warblers on Santa Catalina Island, California, from surveys in May 2002–2006. Parameter and variance estimates taken from the model with the smallest second-order Akaike's Information Criterion (AICc; see Methods).
DISCUSSION
The distribution of oak coverage and food availability associated with this vegetation appear to be the best predictor of territory density of Dusky Orange-crowned Warblers breeding on Santa Catalina Island. The plot-based data suggest that larger oak coverage in mesic drainages likely provides the study subspecies with more food (i.e. caterpillar) relative to xeric ridges, which are characterized by lower territory density and larger territories. The habitat-specific variation in territory density that I document here has been found in other studies of insectivorous birds. For example, breeding Red-eyed Vireos (Vireo olivaceus) selected territories based on foliage density cues reflecting the abundance of caterpillar (Marshall & Cooper Citation2004). Johnson and Sherry (Citation2001) also found a positive association between abundance of wintering American Redstarts (Setophaga ruticilla) and arthropod biomass. Thus, breeding conspecific density is likely to be a robust predictor of resource abundance for Dusky Orange-crowned Warblers on Santa Catalina Island. It is also worth noting that other ecological and behavioural factors such as predation risk, social attraction, and/or social dominance may interact with resource abundance to shape their territory density. Also, the best-fit RT model indicates that NDVI and per cent oak coverage explain an ecologically important component of variation in territory density on the study plot, ranging from the mesic drainage to xeric ridge habitat, and even the entire island. Adams and Anderson (Citation1980) found a continuous and gradual change in bird species composition along a moisture gradient from mesic to xeric habitats. Indeed, satellite-derived remote-sensing data such as NDVI have been considered as a useful predictor of environmental changes that may impact biodiversity or animal populations (reviewed in Nagendra Citation2001, Pettorelli et al. Citation2005).
The territory mapping approach has both strengths and weaknesses as a method for evaluating and monitoring the habitat quality of Dusky Orange-crowned Warblers on Santa Catalina Island as well as other study systems. This method excludes non-territorial adults and juveniles, thereby reducing the likelihood of overestimating territory density and making spurious conclusions about density–habitat quality relationships (van Horne Citation1983). Moreover, intensive territory mapping minimizes the potential underestimation of density when relatively low breeding activities and detectability occur seasonally or annually. For example, the song activities of breeding male O. celata decrease as the breeding season progresses (Yoon et al. Citation2012), making territory mapping a more reliable way that is less sensitive to annual and seasonal variation in reproductive behaviour of the study species, compared to point count surveys. However, intensive territory mapping is time consuming although it may be relatively efficient with uniquely colour-marked individuals. Also, the study plots encompassed only two habitat types; additional data are needed to confirm that the results apply to all habitats occupied by breeding Dusky Orange-crowned Warblers on Santa Catalina Island.
The RT model and distance sampling analysis in the present study produced comparable, habitat-specific territory density estimates on a landscape scale although distance sampling yielded higher estimates of individual density in high-quality habitat than did the RT model. Distance sampling and the RT, however, consider different metrics of Dusky Orange-crowned Warblers' abundance: distance sampling estimates individual density, whereas the RT predicts territory density. Moreover, CIC's point count surveys were conducted in May when many territories had fledglings. This likely leads to overestimate individual densities of adults especially in high-density stratum where not only the fledglings could be mistaken for adults, but also per-area reproductive success would likely have been highest during this survey period. Individual density estimates from distance sampling varied with annual rainfall and were relatively low in dry years when reproductive effort (Langin et al. Citation2009) and hence Dusky Orange-crowned Warbler's vocalizations were low. Also, detection probability decreased as territory density increased, which might also reflect the density dependence of their vocal activity (see also Yoon et al. Citation2012). Nevertheless, I have observed that territory density on the study plots tended to be stable between years. For example, mean territory density in the mesic plot ranged from 3.42 to 5.28 territories/ha in 2003–2009 (J. Yoon, pers. obs.), which was much less variable than the individual densities estimated from the CIC point counts. Thus, the point counts with some plausible violations in the distance sampling assumptions are also likely to bias individual density estimates depending upon annual and seasonal variation in breeding behaviour of Dusky Orange-crowned Warblers.
The RT model with a GIS tool provides useful means of assessing the effect of habitat loss on the Santa Catalina Island population of Dusky Orange-crowned Warblers. Fires may have caused extensive degradation and destruction of Dusky Orange-crowned Warbler's habitats over the past decade (). For example, there were a number of wild fires on the island since 1999 (named by the CIC): Goat Harbor Fire in 1999 (108 ha burned), Airport Fire in 2003 (51 ha burned), and Empire Fire in 2006 (430 ha burned). The most recent human-ignited fire in 2007 (Island Fire) burned 1900 ha, which was likely to be equivalent to approximately 4800 territories out of a total 37 400 territories on the island, based on the predictions of the RT model. The present data indicated that the fire may have destroyed approximately 12.8% of Dusky Orange-crowned Warbler's habitats on the island. An increase in the frequency of extreme droughts and human ignitions could therefore have a detrimental effect on the availability of Dusky Orange-crowned Warbler's habitats on Santa Catalina Island.
In conclusion, the plot-based surveying and statistical modelling framework that I present here provides an insight for understanding how the distribution and abundance of Dusky Orange-crowned Warblers on Santa Catalina Island may respond to habitat changes in the coming decades. The present models could be improved in the two key ways: (1) the application of large-scale data on territory density and reproductive success over a broader range of habitat types and annual precipitation and (2) CIC landbird point count surveys in March to coincide with the onset of breeding of many bird species on the California Channel Islands. Furthermore, the use of independent data sets to parameterize and validate habitat-specific abundance models (Gale et al. Citation2009) may advance the better understanding of avian habitat selection.
ACKNOWLEDGEMENTS
The Catalina Island Conservancy (CIC) generously provided affordable housing and vehicles. Frank Starkey and Carlos de la Rosa of the CIC provided logistical support, and many people helped with the fieldwork, especially J. Coumoutso, L. Caldwell, B. Horton, K. Langin, H. Montag, and H. Sofaer. This manuscript was improved by the comments of T. S. Sillett, C. K. Ghalambor, L. Angeloni, P. Doherty, and two anonymous reviewers.
FUNDING
The study was partially supported by the Nature Conservancy, the Smithsonian Institution, and Colorado State University.
REFERENCES
- Adams, D.E. & Anderson, R.C. 1980. Species response to a moisture gradient in central Illinois forests. Am. J. Bot. 67: 381–392. doi: 10.2307/2442348
- Beyer, H.L. 2004. Hawth's Analysis Tools for ArcGIS. Available at http://www.spatialecology.com/htools
- Block, W.M. & Brennan, L.A. 1993. The habitat concepts in ornithology: theory and applications. Curr. Ornithol. 11: 35–91. doi: 10.1007/978-1-4757-9912-5_2
- Bollinger, E. 1995. Successional changes and habitat selection in hayfield bird communities. Auk 112: 720–730.
- Breiman, L.J., Friedman, J.H., Olshen, R.A. & Stone, C.J. 1984. Classification and Regression Trees. Chapman & Hall, Monterey, CA.
- Buckland, S.T., Anderson, D.R., Burnham, K.P., Laake, J.L., Borchers, D.L. & Thomas, L. 2001. Introduction to Distance Sampling: Estimating Abundance of Biological Populations. Oxford University Press, New York, NY.
- Burnham, K.P. & Anderson, D.R. 2002. Model Selection and Multimodel Inference: A Practical Information-theoretic Approach, 2nd edn. Springer-Verlag, New York, NY.
- Cody, M.L. 1978. Habitat selection and interspecific territoriality among the sylviid warblers in England and Sweden. Ecol. Monogr. 48: 351–396. doi: 10.2307/2937239
- Déath, G. & Fabricius, K.E. 2000. Classification and regression trees: a powerful yet simple technique for ecological data analysis. Ecology 81: 3178–3192. doi: 10.1890/0012-9658(2000)081[3178:CARTAP]2.0.CO;2
- Dobbs, R.C., Sillett, T.S., Rodenhouse, N.L. & Holmes, R.T. 2007. Population density affects foraging behavior of male black-throated blue warblers during the breeding season. J. Field Ornithol. 78: 133–139. doi: 10.1111/j.1557-9263.2007.00096.x
- Elith, J., Graham, C.H., Anderson, R.P., Dudík, M., Ferrier, S., Guisan, A., Hijmans, R.J., Huettmann, F., Leathwick, J.R., Lehmann, A., Li, J., Lohmann, L.G., Loiselle, B.A., Manion, G., Moritz, C., Nakamura, M., Nakazawa, Y., Overton, J.M., Peterson, A.T., Phillips, S.J., Richardson, K., Scachetti-Pereira, R., Schapire, R.E., Soberón, J., Williams, S., Wisz, M.S. & Zimmermann, N.E. 2006. Novel methods improve prediction of species’ distributions from occurrence data. Ecography 29: 129–151. doi: 10.1111/j.2006.0906-7590.04596.x
- Estep, L.K., Mays, H., Keyser, A.J. Jr., Ballentine, B. & Hill, G.E. 2005. Effects of breeding density and plumage coloration on mate guarding and cuckoldry in blue grosbeaks (Passerina caerulea). J. Can. Zool. 83: 1143–1148. doi: 10.1139/z05-110
- Fan, Z., Kabrick, J.M. & Shifley, S.R. 2006. Classification and regression tree based survival analysis in oak-dominated forests of Missouri's Ozark highlands. Can. J. Forest Res. 36: 1740–1748. doi: 10.1139/x06-068
- Ford, R.G. & Myers, J.P. 1981. An evaluation and comparison of techniques for estimating home range and territory size. Stud. Avian Biol. 6: 461–465.
- Forstmeier, W., Bourski, O.V. & Leisler, B. 2001. Habitat choice in Phylloscopus warblers: the role of morphology, phylogeny and competition. Oecologia 128: 566–576. doi: 10.1007/s004420100678
- Gale, G.A., Round, P.D., Pierce, A.J., Nimnuan, S., Pattanavibool, A. & Brockelman, W.Y. 2009. A field test of distance sampling methods for a tropical forest bird community. Auk 126: 439–448. doi: 10.1525/auk.2009.08087
- Goward, S.N. & Huemmrich, K.F. 1992. Vegetation canopy PAR absorptance and the normalized difference vegetation index: an assessment using the SAIL model. Remote Sens. Environ. 39: 119–140. doi: 10.1016/0034-4257(92)90131-3
- van Horne, B. 1983. Density as a misleading indicator of habitat quality. J Wildlife Manage. 47: 893–901. doi: 10.2307/3808148
- van Horne, B. & Weins, J.A. 1991. Forest bird suitability models and the development of general habitat models. U.S. Department of Interior Fish and Wildlife Service Research Report 8, pp. 1–31.
- Horton, B.M., Yoon, J., Ghalambor, C.K., Moore, I.T. & Sillett, T.S. 2010. Seasonal and population variation in male testosterone levels in breeding orange-crowned warblers (Vermivora celata). Gen. Comp. Endocr. 168: 333–339. doi: 10.1016/j.ygcen.2010.04.019
- Jenks, G.F. 1967. The data model concept in statistical mapping. Int. Yearbook Cartogr. 7: 186–190.
- Johnson, D.H. 1980. The comparison of usage and availability measurements for evaluating resource preference. Ecology 61: 65–71. doi: 10.2307/1937156
- Johnson, M.J. 2000. Evaluation of an arthropod sampling techniques for measuring food availability for forest insectivorous birds. J. Field Ornithol. 71: 88–109. doi: 10.1648/0273-8570-71.1.88
- Johnson, M.D. & Sherry, T.W. 2001. Effects of food availability on the distribution of migratory warblers among habitats in Jamaica. J. Anim. Ecol. 70: 546–560. doi: 10.1046/j.1365-2656.2001.00522.x
- Jones, J. 2001. Habitat selection studies in avian ecology: a critical review. Auk 118: 557–562. doi: 10.1642/0004-8038(2001)118[0557:HSSIAE]2.0.CO;2
- Keeley, J.E. 2006. South coast bioregion. In Sugihari, N.G., van Wangtendonk, J.W., Shaffer, K.E., Fites-Kaufman, J., and Thoede, A.E. (eds.) Fires in California's Ecosystem, 350. University of California Press, Berkeley.
- Kirsch, E.M., Gray, B.R., Fox, T.J. & Thogmartin, W.E. 2007. Breeding bird territory placement in riparian wet meadows in relation to invasive reed canary grass, Phalaris arundinacea. Wetlands 27: 644–655. doi: 10.1672/0277-5212(2007)27[644:BBTPIR]2.0.CO;2
- Knapp, D.A. 2002. The status of island scrub-oak (Quercus pacifica) on Catalina Island, California. USDA Forest Service General Technical Report PSW-GTR-184.
- Knapp, D.A. 2005. Vegetation community mapping on Santa Catalina Island using orthorectification and GIS. In Garcelon, D.K. & Schwemm, C.A. (eds.) Proceedings of the Sixth California Islands Symposium, 193–203. Institute for Wildlife Studies, Ventura, CA.
- Kumar, M. & Monteith, J.L. 1982. Remote sensing of plant growth. In Smith, H. (ed.) Plants and the Daylight Spectrum, 133–144. Academic Press, London.
- Langin, K.M., Sillett, T.S., Yoon, J., Sofaer, H.R., Morrison, S.A. & Ghalambor, C.K. 2009. Reproductive consequences of an extreme drought for orange-crowned warblers on Santa Catalina and Santa Cruz Islands. In Damiani, C.C. & Garcelon, D.K. (eds.) Proceedings of the Seventh California Islands Symposium, 293–300. Institute for Wildlife Studies, Ventura, CA.
- Lynch, J.F. & Johnson, N.K. 1974. Turnover and equilibria in insular avifaunas, with special reference to the California Channel Islands. Condor 76: 370–384. doi: 10.2307/1365812
- Marshall, M.R. & Cooper, R.J. 2004. Territory size of a migratory songbird in response to caterpillar density and foliage structure. Ecology 85: 432–445. doi: 10.1890/02-0548
- Minnich, R.A. 1980. Vegetation of Santa Cruz and Santa Catalina Islands. In Power, D. M. (ed.) The California Islands: Proceedings of a Multidisciplinary Symposium, 123–138. Santa Barbara Museum of Natural History, Santa Barbara, CA.
- Morrison, S.A. & Bolger, D.T. 2002. Variation in a sparrow's reproductive success with rainfall: food and predator-mediated processes. Oecologia 133: 315–324. doi: 10.1007/s00442-002-1040-3
- Nagendra, H. 2001. Using remote sensing to assess biodiversity. Int. J. Remote Sens. 22: 2377–2400. doi: 10.1080/01431160117096
- Nice, M.M. 1941. The role of territory in bird life. Am. Midland Nat. 26: 441–487. doi: 10.2307/2420732
- Pettorelli, N., Vik, J.O., Mysterud, A., Gaillard, J.M., Tucker, C.J. & Stenseth, N.C. 2005. Using the satellite-derived NDVI to assess ecological responses to environmental change. Trends Ecol. Evol. 20: 503–510. doi: 10.1016/j.tree.2005.05.011
- Pyle, P. 1997. Identification Guide to North American Birds – Part 1. Slate Creek Press, Bolinas, CA.
- R Development Core Team. 2009. R: A Language and Environment for Statistical Computing. R Foundation for Statistical Computing, Vienna. Available at http://www.R-project.org.
- Ripley, B.D. 1996. Pattern Recognition and Neural Networks. Cambridge University Press, Cambridge.
- Root, T. 1988. Energy constraints on avian distributions and abundances. Ecology 69: 330–339. doi: 10.2307/1940431
- Schonher, T. & Nicholson, S.E. 1989. The relationship between California rainfall and ENSO events. J. Climate 2: 1258–1269. doi: 10.1175/1520-0442(1989)002<1258:TRBCRA>2.0.CO;2
- Smith, T.M. & Shugart, H.H. 1987. Territory size variation in the ovenbird: the role of habitat structure. Ecology 68: 695–704. doi: 10.2307/1938475
- Sofaer, H.R., Chapman, P.L., Sillett, T.S. & Ghalambor, C.K. 2013. Advantages of nonlinear mixed models for fitting avian growth curves. J. Avian Biol. 44: 469–478.
- Sogge, M.K., Gilbert, W.M. & Riper, C.V. III. 1994. Orange-crowned warbler (Vermivora celata). In Poole, A. & Gill, F. (eds.) The Birds of North America, No. 101. Academy of Natural Sciences and American Ornithologists’ Union, Philadelphia, PA.
- Stamps, J.A. 1988. Conspecific attraction and aggregation in territorial species. Am. Nat. 131: 329–347. doi: 10.1086/284793
- Suhonen, J., Norrdahl, K. & Korpimaki, E. 1994. Avian predation risk modifies breeding bird community on a farmland area. Ecology 75: 1626–1634. doi: 10.2307/1939623
- Therneau, T.M. & Atkinson, E.J. 1997. An introduction to recursive partitioning using the RPART routines. Technical report, Mayo Foundation. [Distributed in PostScript with the RPART package].
- Thomas, L., Laake, J.L., Rexstad, E., Strindberg, S., Marques, F.F.C., Buckland, S.T., Borchers, D.L., Anderson, D.R., Burnham, K.P., Burt, M.L., Hedley, S.L., Pollard, J.H., Bishop, J.R.B. & Marques, T.A. 2009. Distance 6.0. Release 2. Research Unit for Wildlife Population Assessment. University of St. Andrews, St. Andrews. Available at http://www.ruwpa.st-and.ac.uk.
- Weiss, A.D. 2001. Topographic positions and landforms analysis (conference poster). ESRI International User Conference. San Diego, CA, 9–13 July.
- Yoon, J., Sillett, T.S., Morrison, S.A. & Ghalambor, C.K. 2012. Breeding density, not life history, predicts interpopulation differences in territorial aggression in a passerine bird. Anim. Behav. 84: 515–521. doi: 10.1016/j.anbehav.2012.05.024
- Yoon, J., Sillett, T.S., Morrison, S.A. & Ghalambor, C.K. 2013. Male's return rate, rather than territory fidelity and breeding dispersal, explains geographic variation in song sharing in two populations of an oscine passerine (Oreothlypis celata). Behav. Ecol. Sociobiol. 67: 1691–1697. doi: 10.1007/s00265-013-1579-5