
ABSTRACT
Capsule: In the Scottish Highlands, Black Grouse Tetrao tetrix females with young broods selected areas rich in wet flushes, grasses and Sphagnum mosses.
Aims: To identify associations between young Black Grouse broods and habitat characteristics.
Methods: We located brood-rearing Black Grouse females in four areas of moorland-forest mosaic in the Scottish Highlands. Each brood was paired with a random reference location 100 m away. We recorded cover of different habitats and fine-scale vegetation and structure within squares of 1 and 0.25 ha, respectively. Associations between brood occurrence and habitat and vegetation variables were examined at the two scales.
Results: Black Grouse broods were positively associated with wet flushes (1 ha), and with Heather Calluna vulgaris, sedges Carex spp., grasses, Sphagnum mosses and taller vegetation with intermediate levels of height variability (0.25 ha).
Conclusions: This study highlights the importance of wet habitats for young Black Grouse chicks. In addition, relatively tall field-layer vegetation comprising Heather, sedges, grasses over a layer of Sphagnum mosses attracted brood-rearing Black Grouse females. Many management practices associated with peatland restoration, including drain-blocking, Sphagnum re-establishment and the avoidance of burning on deep peat soils, are therefore consistent with favourable habitat management for Black Grouse.
To understand and halt bird population declines, it is important to examine associations between a species and habitat characteristics (Bradbury et al. Citation2000, Anderson et al. Citation2009). Such species-habitat associations might vary between ages, sexes and seasons (Blanco-Fontao et al. Citation2012, Sim et al. Citation2013) and between different activities, such as breeding, roosting and feeding (Baines Citation1994, Sim et al. Citation2013). Therefore, combinations of habitats may be required to cater for a species’ various needs (Benton et al. Citation2003, Brambilla et al. Citation2008). In general, habitat associations that are consistent across regions and have a clear mechanistic interpretation are more likely to be a sound basis for conservation interventions.
For nidifugous bird species (i.e. species whose chicks leave the nest shortly after hatching and feed for themselves), there are strong selection pressures to select food-rich habitats with low predation risk and protection from inclement weather (Green Citation1984, Hill Citation1985, Hannon & Martin Citation2006). In addition, these habitats should be in close conjunction, as there is evidence that chick mortality increases with the distance the brood moves (for examples of this effect in Pheasants Phasianus colchicus and Lapwings Vanellus vanellus, see Hill Citation1985, Galbraith Citation1988). For most galliform birds, population growth is sensitive to survival of chicks (Hannon & Martin Citation2006, Aebischer & Ewald Citation2010, Summers et al. Citation2010), so land management providing food-rich habitat plays an important role in increasing population size (Calladine et al. Citation2002, Baines et al. Citation2004, Aebischer & Ewald Citation2010).
The Black Grouse Tetrao tetrix, a nidifugous galliform that often inhabits the transitional areas between forests and open land (e.g. moorland, grassland and mires; Watson & Moss Citation2008, Patthey et al. Citation2012), has experienced population declines in western and central Europe in recent decades (Ludwig et al. Citation2009b). In Great Britain, a long-term range contraction and population decline since the early 1800s (Holloway Citation1996, Sim et al. Citation2008), including a 29% range contraction during the last 40 years (Balmer et al. Citation2013), means that there are now relatively small and isolated populations in Wales and northern England. Most of the British population (approximately 70% of the estimated number of lekking males), is currently found in Scotland with the main area of contiguous range restricted to the Scottish Highlands (Sim et al. Citation2008, Balmer et al. Citation2013). Some of the remaining populations are still declining at a considerable rate, and the Black Grouse is therefore a species of high conservation concern and a priority species under the UK Biodiversity Action Plan (Eaton et al. Citation2011).
Large-scale habitat and land-use changes have been suggested as the main ultimate cause of long-term declines of Black Grouse in Europe (Pearce-Higgins et al. Citation2007, Ludwig et al. Citation2009a, Citation2009b). In Britain, agricultural intensification in lowlands and marginal uplands, increased levels of grazing, and afforestation of moorland areas with non-native conifer species are thought to have adversely affected Black Grouse habitats (Baines Citation1996, Calladine et al. Citation2002, Pearce-Higgins et al. Citation2007). Low breeding productivity and chick survival are key proximate causes of the decline of Black Grouse in Great Britain (Calladine et al. Citation2002, Summers et al. Citation2004, Citation2010). In particular, chicks younger than two weeks that are dependent on invertebrate food are vulnerable to the interacting effects of cold and wet weather (Moss Citation1986, Summers et al. Citation2004), lack of food and predation (Baines Citation1996). Black Grouse chicks older than four weeks have a plant-dominated diet (Starling-Westerberg Citation2001). This dietary shift starts around two weeks after hatching (Kolstad & Wegge Citation1985, Wegge & Kastdalen Citation2008), at the same time as the chicks start to thermoregulate independently. Older chicks are therefore more tolerant to cold and wet weather than young chicks. The age-related dietary shift from invertebrate to plant food could lead to important differences in habitat selection by young and old broods (Parr & Watson Citation1988, Baines Citation1996), yet most studies of Black Grouse brood habitat selection have been dominated by older, plant-feeding chicks (i.e. chicks aged 4–12 weeks, after which the chicks become independent and at least the female chicks disperse; Warren & Baines Citation2002). The few studies of young chicks have only measured the habitat immediately surrounding the current location of the brood without inclusion of paired control sites (e.g. Baines et al. Citation1996, Starling-Westerberg Citation2001). This combined with the importance of chick production to Black Grouse population dynamics (Baines et al. Citation2007, Summers et al. Citation2010), means that there is an urgent need to better understand habitat selection by young Black Grouse broods within their current British range.
This study compares the habitat used by young (i.e. under two weeks of age) Black Grouse broods with paired nearby reference locations across the Scottish Highlands. We included both coarse-scale habitat categories, using the percentage cover of National Vegetation Classification (NVC) habitat communities (Rodwell Citation1991, Citation1992) within a 1 ha square centred on the brood and reference locations, and fine-scale vegetation cover and structure, within a 0.25 ha square centred on the brood and reference locations. One of the few studies on habitat selection by young Black Grouse broods suggested that there is a merit in analysing these scales separately (Baines et al. Citation1996), and we did not have an a priori view of which of the scales that would describe brood presence best. However, we hypothesized that Black Grouse broods would be associated with habitat types and vegetation composition associated with wet and waterlogged conditions, because these often support high abundance of invertebrates eaten by Black Grouse chicks (Parr & Watson Citation1988, Baines Citation1996, Baines et al. Citation1996, Wegge & Kastdalen Citation2008), as well as vegetation structures that previous studies have linked to high invertebrate food availability and protection from weather and predators (i.e. vegetation that has high heterogeneity in height and vertical density; e.g. Baines Citation1996, Baines et al. Citation1996, Vandenberghe et al. Citation2009).
Methods
Brood locations
We located Black Grouse broods during three seasons (2003, 2004 and 2005) in four study areas in the Scottish Highlands: East Sutherland, the Beauly catchment, Badenoch & Strathspey and Lochaber (). In each region, we searched for broods in areas within 1.5 km of known spring lek (mating display) sites of male Black Grouse, because female Black Grouse associated with a particular lek usually nest within this radius (Starling-Westerberg Citation2001). Based on previous work on Black Grouse habitat associations (), we randomly selected a starting point located in generally suitable habitat and decided a route (i.e. a search area) that would encompass all available habitat types, except closed-canopy Sitka spruce Picea sitchensis forestry plantations, water and built-up areas, as they are avoided by Black Grouse (e.g. Parr & Watson Citation1988, Pearce-Higgins et al. Citation2007). Search areas comprised belt transects of 0.59–8.3 km in length (mean ± se: 4.11 km ± 0.28; the short transects were used when rivers and closed-canopy forestry blocked transects).To minimize the risk of spatial auto-correlation in habitat use, we only used one transect located near each lek. The monitoring of regions varied between years, with East Sutherland searched in 2003 and 2004, the Beauly catchment in 2003 and 2005, and both Badenoch & Strathspey and Lochaber searched in all three years. We visited each lek only in one year to minimize the chances of locating different broods of the same female in different years. In total, we collected data at 59 brood and 59 reference locations, and for all analyses, we pooled data over years, because sample sizes were too small to formally model the effect of year.
Figure 1. The brood and reference locations in the four study areas in the Scottish Highlands. The number of locations appears lower than indicated in the text due to the short distance between some brood locations. The inset shows the location of the regions in Great Britain.
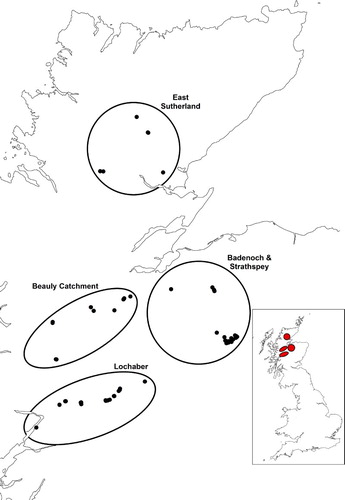
Table 1. List of habitat and vegetation cover variables and rationale for inclusion in coarse and fine-scale habitat analyses.
We located broods by walking these transects with a trained dog, which searched for Black Grouse broods by scent over an area of approximately 50 m on either side of the transect (Parr & Watson Citation1988). Thus, an average of 0.4 km2 (i.e. 5.8%) was searched out of a possible 7.1 km2 within 1.5 km of each lek. In Scotland, most Black Grouse chicks hatch around mid-June (Watson & Moss Citation2008). Therefore, we undertook all searches between 10 June and 15 July, to maximize the chances that broods found were less than two weeks old, and still dependent on an invertebrate diet (Wegge & Kastdalen Citation2008). The broods were found mainly in June (mean date ± se: 23 June ± 1.1 day; earliest date: 13 June; latest date: 12 July). The fieldworkers found several incubating female Black Grouse, which indicates that the timing of the fieldwork was highly accurate. When finding a brood, the fieldworkers assessed the age of chicks, using photographs of chicks of known age as a reference. The few broods found with chicks estimated to be older than two weeks were not included in the analyses. We recorded an eight-figure grid reference using a handheld Global Positioning System receiver (i.e. identifying a 10 × 10 m square) for each young brood and marked the site with a cane. The relatively low mobility of young chicks suggests that it was low risk that the Black Grouse females moved their broods away from the point where the dog located the brood. This is supported by the fact that the dog was observed constantly during searches, and in no instance was the brood located further than 10 m from the point where the dog indicated presence of a brood.
Habitat assessments
We paired each brood location with a reference location, which was situated 100 m from the associated brood location, in a direction that was randomly selected but constrained to ensure that it occurred within the area searched by the dog. The distance of 100 m was chosen because it was close enough to the brood location to be available to the female but far away enough to be definitely not in use by the female when found. We assessed the habitat at brood and reference locations at both coarse and a fine scales. The coarse-scale approach involved visually assessing the percentage cover of NVC plant communities (Rodwell Citation1991, Citation1992) within a 100 × 100 m area centred on the brood or reference location. To minimize the risk of observer effects, only staff with previous experience of NVC upland and woodland plant communities did these assessments. The same person assessed the habitat and vegetation at each pair of brood and reference locations, thereby minimizing potential bias between the two types of locations. For analyses, we retained any NVC communities which occurred on at least ten locations. We combined some similar communities, giving the following list of coarse-scale habitats; acid flush (M6 community), blanket bog (M17, M18 and M19 communities), dry heath (H10 and H12 communities), Purple Moor Grass Molinia caerulea mire (M25 community), wet heath (M15 community), bracken (U20 community), open Scots pine Pinus sylvestris woodland (W18 community) and acid grassland (U4 and U5 communities).
Fine-scale habitat assessments involved measuring vegetation composition and structure. Sampling was based on a grid of 25 equally spaced points aligned on a 50 × 50 m grid, centred on the brood and reference locations. At each sampling point, we estimated the percentage cover of all plant species within a 1 m2 quadrat to the nearest 5%. Following the methods used by Pearce-Higgins & Grant (Citation2006), we measured vegetation structure at the centre of each quadrat, recording maximum height (hereafter ‘top height’) using a cane with markings every 5 cm and the maximum height below which the stick was obscured by vegetation (hereafter ‘vegetation density’). For some species-rich plant genera, for example, grasses and sedges other than Trichophorum spp. and Eriophorum spp., we pooled the cover of all species to form the groups ‘grasses’ and ‘sedges’, respectively. We calculated mean percentage cover values for each plant species (or species grouping) for each brood and reference location, as well as mean top vegetation height and mean vegetation density. Additionally, we calculated the coefficient of variation in top height and density at each brood and reference location, as well as the mean height difference between adjacent points. From the plant cover data, 11 taxa (species or species groupings) of dwarf shrubs, grasses and mosses were selected for consideration in the subsequent analyses, based upon their known relevance to Black Grouse biology (; which also provides scientific names of all plant species). For example, Blaeberry, Cotton grass and Heather are important food plants for old chicks and adult Black Grouse (Parr & Watson Citation1988, Baines Citation1996, Wegge & Kastdalen Citation2008), but these plant species have also been associated with high survival of young broods in Finland (Ludwig et al. Citation2010). Other plant species are indicative of wet habitats, which might be selected by brood-rearing females (McFarlane Citation2002, Ludwig et al. Citation2010; ).
Pre-analysis checks revealed significant differences in habitat and vegetation structure between the four study areas and between brood and reference locations in terms of coarse and fine-scale habitat characteristics (Online Appendix 1). Most noticeably, the western areas (Beauly Catchment and Lochaber) had more Molinia and wet heath, and less dry heath, whereas Badenoch & Strathspey had the most Scots pine woodland.
Data exploration
All data exploration and statistical modelling was done in the statistical software R (R Development Core Team Citation2011). The dependent variable in all analyses was the occurrence of a brood (i.e. a binomial variable, where 1 = presence and 0 = absence). We conducted separate analyses of the coarse-scale habitat and fine-scale measures of vegetation attributes. Following Zuur et al. (Citation2010), we examined the data for outliers, normality of the explanatory variables and collinearity among them, as well as nonlinear relationships between dependent and explanatory variables. These checks revealed only one strong correlation (i.e. r ≥ 0.70) between two fine-scale explanatory variables: coefficient of variation of vegetation height and mean height difference between points (Pearson’s r = 0.70). Based on univariate tests, we selected the variable with the lowest P-value (i.e. mean height difference between points), and we therefore used this variable in further analyses. In addition, we used Variance Inflation Factors (VIF) to examine any remaining collinearity among explanatory variables (Zuur et al. Citation2009). For the coarse-scale analyses, the variable wet heath had a VIF above 5. After removing wet heath, all remaining explanatory variables had VIF below 5. For the fine-scale analyses, rushes and Purple Moor Grass had high VIF-values (i.e. above 10), but after removing these variables, the remaining variables had VIF-values below 5.
To further explore the data, we used Generalized Additive Models (Wood Citation2006) to assess analytically whether there were nonlinear relationships between brood occurrence and habitat variables. Two coarse-scale habitat variables, blanket bog and acid flush, and two fine-scale habitat variables, grasses and mean height difference, had nonlinear, approximately quadratic relationships with the presence of Black Grouse broods. For these variables, both linear and quadratic terms were included in the subsequent multivariate analyses, whereas we only incorporated the linear term for the other variables. The data exploration left us with seven linear and two quadratic coarse-scale habitat variables and 13 linear (9 cover and four structure variables) and two quadratic fine-scale habitat variables for further analyses (Online Appendix 1).
Statistical modelling
The univariate pre-analysis tests did not account for the effects of other explanatory variables and the paired brood-reference data structure. Therefore, we fitted Generalized Linear Mixed Models in the package lme4 in R (Bates et al. Citation2014) with a binomial error structure and a logit link function to investigate relationships between Black Grouse brood occurrence and the habitat and vegetation features. Due to the paired structure of brood and reference locations within study area, we also included the variable ‘Pair’, nested within ‘Study area’, as a random effect in all models. We explored whether including ‘Study area’ as a fixed factor changed the outcome of our modelling, but that was not the case (i.e. Study area was highly non-significant: P = 0.92). Ideally, the effect of ‘Year’ should have been included, but due to low sample sizes for some year-study area combinations, these models failed to converge. We therefore excluded the effect of year in the models. All variables remaining after the data exploration exercise were included in full models (i.e. separately for the coarse and fine scales), and we then conducted a sequential backward elimination procedure (Murtaugh Citation2009) to produce final Minimum Adequate Models (MAMs) of variables significant at P = 0.05 for both the coarse and fine scales. As a precaution, we re-fitted the global models at the coarse and fine scales with the previously excluded variables (wet heath, rushes and Purple Moor Grass), but reassuringly we ended up with identical MAMs as before. For the coarse and fine-scale MAMs, we predicted the brood occurrence given the data from the four study areas. As the lme4 does not compute predicted errors around the mean, we generated 95% Confidence Intervals (CIs) around the predicted occurrence of Black Grouse through a bootstrap procedure. For this, we re-sampled, re-fitted and re-predicted the MAM 1000 times and computed the 2.5% and 97.5% quantiles of these predictions (Bolker Citation2015).
Assessment of model performance
Using the ‘predict’ command in the package lme4 in R (Bates et al. Citation2014), we used the derived parameter estimates from the MAMs for the coarse and fine-scale habitat analyses separately to predict the probability of brood occurrence at each sampling location. As we did not have an independent dataset to validate our model against, the predictions were made on our empirical data set. This is not ideal, but low sample size prevented us from using a cross-validation approach. It should therefore be noted that this non-independence might give rise to a slightly better model fit than if an independent data set was used. The predicted values were then used in Receiver Operating Characteristics (ROC) analyses (for an introduction to ROC analyses, see e.g. Guénette & Villard Citation2004), using package pROC in R (Robin et al. Citation2011). The resulting Area Under the Curve (AUC; ±95% CIs) was used as an overall estimate of the model performance. To examine how well the MAMs performed in the four different study areas, we used a study area-specific subset of the full data set and repeated the predictive exercise, which was based on the MAMs generated using the whole data set, and the ROC analysis for the four study areas.
Results
Coarse-scale habitat associations
A total of 59 Black Grouse broods were located during searches, with 6, 11, 24 and 18 in East Sutherland, the Beauly catchment, Badenoch & Strathspey and Lochaber, respectively.
The MAM of associations between brood presence and coarse-scale habitats contained only two significant variables: the percentage cover of acid flushes and its quadratic term (a). Model predictions suggested that the probability of brood occurrence was highest in areas with between 25% and 75% cover of acid flushes (). However, the inclusion of the quadratic term of acid flushes was dependent on one influential brood-reference plot pair, so further analyses focused on the linear effect only (). The relatively low variation in the amount of acid flush recorded at both brood and reference points suggested that this association was relatively weak.
Figure 2. The fitted probability (blue thick solid line) and 95%CIs (blue dashed lines) of Black Grouse brood occurrence in relation to the percentage of acid flush cover. This relationship has been calculated for the MAM (a, i.e. including the quadratic term of acid flush cover) by varying the percentage of acid flushes between 0% and 100% with increments of 1%. Overlaid is the fitted probability (red dashed line) and 95% CIs (red dotted lines) of Black Grouse brood occurrence in relation to the percentage of acid flush cover when the pair of observations with 90% and 100% acid flush cover at brood and reference locations, respectively, had been removed. We used 1000 iterations to calculate the CIs. The observed number brood (1) and reference (0) locations in relation to percentage acid flush cover is illustrated by the histograms.
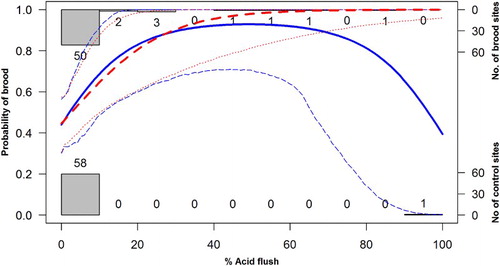
Table 2. MAMs of associations between Black Grouse brood presence and (a) coarse-scale habitat and (b) fine-scale vegetation variables, respectively, across four study areas in Scotland.
Fine-scale habitat associations
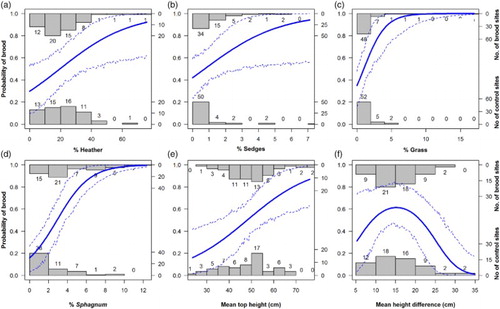
The final model of associations between brood occurrence and fine-scale vegetation measures contained seven variables, of which four were measures of vegetation cover and three of vegetation structure (b). Model predictions suggested that the cover of Heather, sedges, grass and Sphagnum mosses were all positively associated with the occurrence of Black Grouse broods (a–d). For the structural variables, model predictions suggested that the probability of brood occurrence increased linearly with mean top vegetation height (e) and showed a nonlinear relationship with the mean height difference (i.e. the difference in vegetation height between adjacent sampling stations; f). The latter relationship and associated large CI at low values of mean height difference suggest that the effect on brood occurrence was uncertain when the mean height difference was below approximately 10 cm. However, broods were positively associated with 10–20 cm mean height difference, and tended not to occur where the vegetation had larger height difference.
Figure 3. The fitted probability (solid line) and 95%CIs (dashed lines) of Black Grouse brood occurrence in relation to the percentage cover of (a) Heather, (b) Sedges, (c) Grass and (d) Sphagnum mosses, as well as in relation to (e) mean top vegetation height and (f) mean height difference. These relationships have been calculated for the MAM (b), with all fine-scale habitat variables, other than the variable of interest, held at their mean value. We used 100 values of the variable of interest equally spread between the observed minimum and maximum values of the explanatory variable, and used 1000 iterations to calculate the CIs. The observed number brood (1) and reference (0) locations in relation to the modelled variable is illustrated by the histograms.
Assessment of general and regional model performance
The ROC plot analyses and the resulting AUC estimates suggested that the coarse-scale habitat model had a relatively poor fit to the observed occurrence of Black Grouse, and predictions were only marginally better than expected by chance (AUC = 0.605, 95% CI 0.504–0.706%). Study area assessments of the coarse-scale habitat model revealed that the predictions for Badenoch & Strathspey was in fact poorer than chance (i.e. AUC < 0.5; ), whereas it had slightly better predictive value for East Sutherland and Lochaber. The model did not converge for the Beauly catchment, and we could therefore not assess the model performance for this area. The mean (± sd) AUC for the three study areas was 0.631 (± 0.164).
In contrast, the ROC plot analyses for the fine-scale vegetation variables suggested very good model performance (). Using the whole dataset, the model predictions were high (AUC = 0.828, 95% CI 0.754–0.901). The model did not converge for East Sutherland, but the remaining three study areas had AUC > 0.8 with CIs not overlapping 0.5. The mean (± sd) AUC for the three study areas was 0.884 (± 0.053).
Table 3. Assessment of the performance of the coarse-scale habitat and fine-scale vegetation MAMs () at predicting Black Grouse brood occurrence using ROC curve analysis. The assessments were carried out using all regions and each region separately and is based on AUC values (± 95% CIs), with AUC = 1.0 for models successfully explaining all presences and absences and AUC = 0.5 depicting a model that is no better at predicting occurrence than chance.
Discussion
Brood habitat associations
Our results suggested that brood-rearing Black Grouse females with young, insectivorous broods were weakly positively associated with the cover of acid flush, that is, wet, herb-rich habitat enriched by flowing water (a, ). In addition, brood occurrence was associated with tall vegetation with intermediate variation in height (i.e. 10 to 20 cm between sampling stations; e and 3f) and with high cover of grasses, sedges, Sphagnum mosses and in Heather (a–d). However, the generally low cover of sedges, that is, between 0 and 7% and the wide CIs above approximately 2.5% sedge cover (cf. b), makes this relationship less certain. In general, our results suggest that the habitat selection of female Black Grouse with young broods is best described by the fine-scale vegetation measures, whereas the coarse NVC classification is a less suitable predictor for habitat associations at this life-stage. We interpret our results as the brood-rearing females select patches with good cover from predators and human disturbance (i.e. tall vegetation; see also Patthey et al. Citation2012), but with shorter vegetation available nearby (i.e. heterogeneous vegetation height), where invertebrate food might be more available to the young chicks. Overall, our results are similar to the general findings from studies from open moorland in Great Britain regarding the importance of wet habitats for older Black Grouse chicks that have switched to a plant-dominated diet (Picozzi & Hepburn Citation1984, Parr & Watson Citation1988, Baines Citation1996, Calladine et al. Citation2002).
Across Europe, Black Grouse often inhabit areas that are transitional between woodland and open land (e.g. moorland, mires, clearcuts and meadows with interspersed trees; Ramanzin et al. Citation2000, Ludwig et al. Citation2008, Watson & Moss Citation2008, Ludwig et al. Citation2009b, Signorell et al. Citation2010), and our study areas’ mix of open moorland, commercial conifer forestry plantations and naturally regenerating mixed deciduous-conifer woodlands was consistent with this. However, our Scottish study areas have different underlying geology than many areas where Black Grouse have been studied in continental Europe. For example, our study area had high rainfall and large peat formations on top of acid bedrock (i.e. low pH), whereas continental studies have been carried out in areas with more basic geology (i.e. high pH). Our finding that young Black Grouse broods selected acid flushes suggests that even in landscapes where pH is low and invertebrate abundance is likely also to be lower than over more buffering geologies (Coulson & Butterfield Citation1985, Buckton & Ormerod Citation1997), wet habitats are still important. One possible explanation is that sawfly (Symphyta) larvae, which forms an important part of Black Grouse chick diet (i.e. Starling-Westerberg Citation2001), occur in higher densities in these flushes than elsewhere. For example, a study from northern England showed that brood-rearing females selected damp areas with Soft Rush Juncus effusus, which had high abundance of sawfly larvae (Starling-Westerberg Citation2001). Several studies have also suggested that moth caterpillars are important prey items for young Black Grouse chicks (Baines et al. Citation1996, Ludwig et al. Citation2008, Wegge & Kastdalen Citation2008, Ludwig et al. Citation2010), and Baines et al. (Citation1996) found that such caterpillars occur at high densities in Bog Myrtle/grass wet flushes in Scotland. In addition, the timing of the hatching of Black Grouse clutches coincides with the peak in moth caterpillar biomass (Baines et al. Citation1996, Wegge et al. Citation2010). Such an adaptation has been shown to increase the survival of the Black Grouse chicks (Ludwig et al. Citation2006).
Our result showing a positive association between brood presence and Sphagnum mosses could stem from the fact that larval tipulids occur at high densities on Sphagnum peat. Tipulids make up the bulk of the diet of Golden Plover Pluvialis apricaria chicks (Pearce-Higgins & Yalden Citation2004), and it is likely that also Black Grouse chicks consume tipulids. Overall, results from this and other studies highlight an association between Black Grouse broods and wet areas. Thus, habitat management aimed at drainage in the interest of agriculture or forestry are likely to be detrimental for Black Grouse (Baines Citation1996, Calladine et al. Citation2002, Ludwig et al. Citation2008).
Changes to vegetation structure caused by livestock and Red Deer Cervus elaphus grazing might also influence Black Grouse populations. For example, Black Grouse chicks had significantly higher survival in areas of moorland where grazing had been reduced than in grazed moorland (Calladine et al. Citation2002). However, the effects of vegetation height and structure on Black Grouse are unlikely to be straightforward, and multiple scenarios are plausible, including trade-offs between predation risk, invertebrate food availability and chilling effects during cold, wet weather (Vandenberghe et al. Citation2009, Signorell et al. Citation2010, Patthey et al. Citation2012). For instance, in the Central European Alps, brood-rearing female Black Grouse selected a mosaic of grassy shrubland with scattered trees in preference to open grassland with higher arthropod abundance (Signorell et al. Citation2010, Patthey et al. Citation2012).
Apart from drainage and intense grazing, many other factors related to land use have been proposed to reduce habitat quality for Black Grouse. These include agricultural intensification, increased human settlement (Ludwig et al. Citation2009a, Citation2009b), and commercial coniferous plantations. However, the forestry plantations also include a phase of suitable early succession forest of around 10–15 years, which thereafter quickly develops a closed shading canopy that causes reduction of the critical field-layer vegetation and invertebrate communities, leading to declines in Black Grouse numbers (Pearce-Higgins et al. Citation2007, Watson & Moss Citation2008). In addition, nest predation by generalist predators such as corvids and Red Fox Vulpes vulpes may reduce breeding success and recruitment into the population (Baines Citation1996, Summers et al. Citation2010).
Management implications
Overall, the poorer performance of the coarse-scale habitat model indicated that there was an advantage in describing brood locations using more detailed measures of vegetation cover and structure. This suggest that when implementing common forms of upland land management, such as heather burning and cutting, livestock grazing and deer management, land managers should aim at achieving the fine-scale habitat relationships described in this study to improve the conditions for Black Grouse. Crucially, our results suggest that many of the management practices associated with peatland restoration, including drain-blocking, Sphagnum re-establishment and the avoidance of burning on deep peat soils (reviewed in e.g. Glaves et al. Citation2013, Grant et al. Citation2013), are consistent with favourable habitat management for Black Grouse. We therefore suggest that it would be valuable to test more formally whether this species is a co-beneficiary of peatland restoration driven by ecosystem service and climate change mitigation objectives through, for example, increases in invertebrate prey abundance, breeding success and chick survival.
ORCID details
Staffan Roos http://orcid.org/0000-0002-4088-2875
Supplementary Appendix
Download MS Word (25 KB)Acknowledgements
Habitat description fieldwork was carried out under contract by Ruth Maier. Brood search field work was assisted under contract by David Lambie. Bob Moncrieff and Neighan the setter conducted the brood searches at RSPB Abernethy National Nature Reserve. Andy Amphlett and Dave Beaumont gave valuable advice regarding the design of the study. We thank Professor Jeremy Wilson and two anonymous reviewers for valuable comments on a previous version of the manuscript.
Additional information
Funding
Related Research Data
References
- Aebischer, N.J. & Ewald, J.A. 2010. Grey Partridge Perdix perdix in the UK: recovery status, set-aside and shooting. Ibis 152: 530–542. doi: 10.1111/j.1474-919X.2010.01037.x
- Anderson, B.J., Arroyo, B.E., Collingham, Y.C., Etheridge, B., Fernandez-De-Simon, J., Gillings, S., Gregory, R.D., Leckie, F.M., Sim, I.M.W., Thomas, C.D., Travis, J.M.J. & Redpath, S.M. 2009. Using distribution models to test alternative hypotheses about a species’ environmental limits and recovery prospects. Biol. Conserv. 142: 488–499. doi: 10.1016/j.biocon.2008.10.036
- Baines, D. 1994. Seasonal differences in habitat selection by Black Grouse Tetrao tetrix in the northern Pennines, England. Ibis 136: 39–43. doi: 10.1111/j.1474-919X.1994.tb08129.x
- Baines, D. 1996. The implications of grazing and predator management on the habitats and breeding success of black grouse Tetrao tetrix. J. Appl. Ecol. 33: 54–62. doi: 10.2307/2405015
- Baines, D., Wilson, I.A. & Beeley, G. 1996. Timing of breeding in black grouse Tetrao tetrix and capercaillie Tetrao urogallus and distribution of insect food for the chicks. Ibis 138: 181–187. doi: 10.1111/j.1474-919X.1996.tb04327.x
- Baines, D., Moss, R. & Dugan, D. 2004. Capercaillie breeding success in relation to forest habitat and predator abundance. J. Appl. Ecol. 41: 59–71. doi: 10.1111/j.1365-2664.2004.00875.x
- Baines, D., Warren, P. & Richardson, M. 2007. Variations in the vital rates of black grouse Tetrao tetrix in the United Kingdom. Wildlife Biol. 13: 109–116. doi: 10.2981/0909-6396(2007)13[109:VITVRO]2.0.CO;2
- Balmer, D.E., Gillings, S., Caffrey, B.J., Swann, R.L., Downie, I.S. & Fuller, R.J. 2013. Bird Atlas 2007–2011: The Breeding and Wintering Birds of Britain and Ireland. BTO Books, Thetford.
- Bates, D., Maechler, M., Bolker, B. & Walker, S. 2014. lme4: Linear mixed-effects models using Eigen and S4. R package version 1.1-7, http://CRAN.R-project.org/package=lme4
- Beeston, R., Baines, D. & Richardson, M. 2005. Seasonal and between-sex differences in the diet of Black Grouse Tetrao tetrix. Bird Study 52: 276–281. doi: 10.1080/00063650509461400
- Benton, T.G., Vickery, J.A. & Wilson, J.D. 2003. Farmland biodiversity: is habitat heterogeneity the key? Trends Ecol. Evol. 18: 182–188. doi: 10.1016/S0169-5347(03)00011-9
- Blanco-Fontao, B., Obeso, J.R., Banuelos, M.J. & Quevedo, M. 2012. Habitat partitioning and molting site fidelity in Tetrao urogallus cantabricus revealed through stable isotopes analysis. J. Ornithol. 153: 555–562. doi: 10.1007/s10336-011-0776-0
- Bolker, B.M. 2015. Linear and generalized linear mixed models. In Fox, G.A., Negrete-Yankelevich, S. & Sosa, V.J. (eds.) Ecological Statistics: Contemporary Theory and Application: 309–334. Oxford University Press, Oxford.
- Bradbury, R.B., Kyrkos, A., Morris, A.J., Clark, S.C., Perkins, A.J. & Wilson, J.D. 2000. Habitat associations and breeding success of yellowhammers on lowland farmland. J. Appl. Ecol. 37: 789–805. doi: 10.1046/j.1365-2664.2000.00552.x
- Brambilla, M., Guidali, F. & Negri, I. 2008. The importance of an agricultural mosaic for Cirl Buntings Emberiza cirlus in Italy. Ibis 150: 628–632. doi: 10.1111/j.1474-919X.2008.00822.x
- Buckton, S.T. & Ormerod, S.J. 1997. Effects of liming on the Coleoptera, Hemiptera, Araneae and Opiliones of catchment wetlands in Wales. Biol. Conserv. 79: 43–57. doi: 10.1016/S0006-3207(96)00083-3
- Calladine, J., Baines, D. & Warren, P. 2002. Effects of reduced grazing on population density and breeding success of black grouse in northern England. J. Appl. Ecol. 39: 772–780. doi: 10.1046/j.1365-2664.2002.00753.x
- Cayford, J.T. 1990. The distribution and habitat preferences of black grouse in commercial forests in Wales: Conservation and management implications. Union of Game Biologists Congr. 19: 435–447.
- Coulson, J.C. & Butterfield, J.E.L. 1985. The invertebrate communities of peat and upland grasslands in the north of England and some conservation implications. Biol. Conserv. 34: 197–225. doi: 10.1016/0006-3207(85)90093-X
- Eaton, M.A., Balmer, D.E., Cuthbert, R., Grice, P.V., Hall, J., Hearn, R.D., Holt, C.A., Musgrove, A.J., Noble, D.G., Parsons, M., Risely, K., D.A., S. & Wotton, S. 2011. The State of the UK’s Birds 2011. 40 pp. RSPB, BTO, WWT, CCW, JNCC, NE, NIEA and SNH, Sandy, Bedfordshire.
- Galbraith, H. 1988. Effects of agriculture on the breeding ecology of lapwings Vanellus vanellus. J. Appl. Ecol. 25: 487–503. doi: 10.2307/2403839
- Glaves, D.J., Morecroft, M., Fitzgibbon, C., Lepitt, P., Owen, M. & Phillips, S. 2013. Natural England Review of Upland Evidence 2012 – The Effects of Managed Burning on Upland Peatland Biodiversity, Carbon and Water. Natural England Evidence Review, Number 004, 156 pp. Natural England, Exeter.
- Grant, M.C., Mallord, J.W., Stephen, L. & Thompson, P.S. 2013. The Costs and Benefits of Grouse Moor Management to Biodiversity and Aspects of the Wider Environment: A Review. RSPB Research Report Number 43, 103 pp. RSPB, Sandy, Bedfordshire.
- Green, R.E. 1984. The feeding ecology and survival of partridge chicks (Alectoris rufa and Perdix perdix) on arable farmland in East Anglia. J. Appl. Ecol. 21: 817–830. doi: 10.2307/2405049
- Guénette, J.-S. & Villard, M.-A. 2004. Do empirical thresholds truly reflect species tolerance to habitat alteration? Ecolol. Bull. 51: 163–171.
- Hannon, S.J. & Martin, K. 2006. Ecology of juvenile grouse during the transition to adulthood. J. Zool. 269: 422–433. doi: 10.1111/j.1469-7998.2006.00159.x
- Haysom, S.L. 2001. Aspects of the ecology of Black Grouse (Tetrao tetrix) in plantation forests in Scotland. PhD, University of Stirling.
- Hill, D.A. 1985. The feeding ecology and survival of pheasant chicks on arable farmland. J. Appl. Ecol. 22: 645–654. doi: 10.2307/2403218
- Holloway, S. 1996. Black grouse. In Holloway, S. (ed.) The Historical Atlas of Breeding Birds in Britain and Ireland: 1875–1900, 136–137. T. & A. D. Poyser Ltd., London.
- Kolstad, M. & Wegge, P. 1985. The habitat ecology of Black Grouse during spring and summer in East Norway. Meddelelser Fra Norsk Viltforskning: 13: 1–46.
- Ludwig, G.X., Alatalo, R.V., Helle, P., Linden, H., Lindstrom, J. & Siitari, H. 2006. Short- and long-term population dynamical consequences of asymmetric climate change in black grouse. Proc. R. Soc. B-Biol. Sci. 273: 2009–2016. doi: 10.1098/rspb.2006.3538
- Ludwig, G.X., Alatalo, R.V., Helle, P., Nissinen, K. & Siitari, H. 2008. Large-scale drainage and breeding success in boreal forest grouse. J. Appl. Ecol. 45: 325–333. doi: 10.1111/j.1365-2664.2007.01396.x
- Ludwig, T., Storch, I. & Graf, R.F. 2009a. Historic landscape change and habitat loss: the case of black grouse in Lower Saxony, Germany. Landscape Ecol. 24: 533–546. doi: 10.1007/s10980-009-9330-3
- Ludwig, T., Storch, I. & Gartner, S. 2009b. Large-scale land use change may explain bird species declines in semi-natural areas: the case of Black Grouse population collapse in Lower Saxony, Germany. J. Ornithol. 150: 871–882. doi: 10.1007/s10336-009-0410-6
- Ludwig, G.X., Alatalo, R.V., Helle, P. & Siitari, H. 2010. Individual and environmental determinants of early brood survival in black grouse Tetrao tetrix. Wildlife Biol. 16: 367–378. doi: 10.2981/10-013
- McFarlane, J. 2002. Habitat associations of Black Grouse Tetrao tetrix broods in a native pinewood forest. Unpubl. MSc. Thesis, University of Reading.
- Moss, R. 1986. Rain, breeding success and distribution of Capercaillie Tetrao urogallus and Black Grouse Tetrao tetrix in Scotland. Ibis 128: 65–72. doi: 10.1111/j.1474-919X.1986.tb02093.x
- Murtaugh, P.A. 2009. Performance of several variable-selection methods applied to real ecological data. Ecol. Lett. 12: 1061–1068. doi: 10.1111/j.1461-0248.2009.01361.x
- Parr, R. & Watson, A. 1988. Habitat preferences of Black Grouse on moorland-dominated ground in northeast Scotland. Ardea 76: 175–180.
- Patthey, P., Signorell, N., Rotelli, L. & Arlettaz, R. 2012. Vegetation structural and compositional heterogeneity as a key feature in Alpine black grouse microhabitat selection: conservation management implications. Eur. J. Wildlife Res. 58: 59–70. doi: 10.1007/s10344-011-0540-z
- Pearce-Higgins, J.W. & Grant, M.C. 2006. Relationships between bird abundance and the composition and structure of moorland vegetation. Bird Study 53: 112–125. doi: 10.1080/00063650609461424
- Pearce-Higgins, J.W. & Yalden, D.W. 2004. Habitat selection, diet, arthropod availability and growth of a moorland wader: the ecology of European Golden Plover Pluvialis apricaria chicks. Ibis 146: 335–346. doi: 10.1111/j.1474-919X.2004.00278.x
- Pearce-Higgins, J.W., Grant, M.C., Robinson, M.C. & Haysom, S.L. 2007. The role of forest maturation in causing the decline of Black Grouse Tetrao tetrix. Ibis 149: 143–155. doi: 10.1111/j.1474-919X.2006.00623.x
- Picozzi, N. & Hepburn, L. 1984. A study of black grouse in north-east Scotland. International Grouse Symposium, York, 3: 462–480.
- Ramanzin, M., Fuser, S., Cominato, F. & Bottazzo, M. 2000. Summer habitat selection by black grouse in the Belluno province (Eastern Italian Alps). Cahiers d'Ethologie Fondamentale et Appliquee, Animale et Humaine 20: 461–472.
- R Development Core Team. 2011. R: A language and environment for statistical computing. 2.13.1, Vienna, http://www.R-project.org.
- Robin, X., Turck, N., Hainard, A., Tiberti, N., Lisacek, F., Sanchez, J.-C. & Müller, M. 2011. pROC: an open-source package for R and S+ to analyze and compare ROC curves. BMC Bioinf. 12: 77. doi: 10.1186/1471-2105-12-77
- Rodwell, J.S. (ed.) 1991. British Plant Communities: Mires and Heath. Cambridge University Press, Cambridge.
- Rodwell, J.S. (ed.) 1992. British Plant Communities: Grassland and Montane Communities. Cambridge University Press, Cambridge.
- Signorell, N., Wirthner, S., Patthey, P., Schranz, R., Rotelli, L. & Arlettaz, R. 2010. Concealment from predators drives foraging habitat selection in brood-rearing Alpine black grouse Tetrao tetrix hens: habitat management implications. Wildlife Biol. 16: 249–257. doi: 10.2981/09-028
- Sim, I.M.W., Eaton, M.A., Setchfield, R.P., Warren, P.K. & Lindley, P. 2008. Abundance of male Black Grouse Tetrao tetrix in Britain in 2005, and change since 1995–96. Bird Study 55: 304–313. doi: 10.1080/00063650809461536
- Sim, I.M.W., Ludwig, S.C., Grant, M.C., Loughrey, J.L., Rebecca, G.W. & Redpath, S. 2013. Seasonal variation in foraging conditions for Ring Ouzels Turdus torquatus in upland habitats and their effects on juvenile habitat selection. Ibis 155: 42–54. doi: 10.1111/ibi.12002
- Starling-Westerberg, A. 2001. The habitat use and diet of Black Grouse Tetrao tetrix in the Pennine hills of northern England. Bird Study 48: 76–89. doi: 10.1080/00063650109461205
- Summers, R.W., Green, R.E., Proctor, R., Dugan, D., Lambie, D., Moncrieff, R., Moss, R. & Baines, D. 2004. An experimental study of the effects of predation on the breeding productivity of capercaillie and black grouse. J. Appl. Ecol. 41: 513–525. doi: 10.1111/j.0021-8901.2004.00891.x
- Summers, R.W., Dugan, D. & Proctor, R. 2010. Numbers and breeding success of Capercaillies Tetrao urogallus and Black Grouse T. tetrix at Abernethy Forest, Scotland. Bird Study 57: 437–446. doi: 10.1080/00063657.2010.506209
- Vandenberghe, C., Prior, G., Littlewood, N.A., Brooker, R. & Pakeman, R. 2009. Influence of livestock grazing on meadow pipit foraging behaviour in upland grassland. Basic Appl. Ecol. 10: 662–670. doi: 10.1016/j.baae.2009.03.009
- Warren, P.K. & Baines, D. 2002. Dispersal, survival and causes of mortality in black grouse Tetrao tetrix in northern England. Wildlife Biol. 8: 91–97.
- Watson, A. & Moss, R. 2008. Grouse. HarperCollins Publishers, London.
- Wegge, P. & Kastdalen, L. 2008. Habitat and diet of young grouse broods: resource partitioning between Capercaillie (Tetrao urogallus) and Black Grouse (Tetrao tetrix) in boreal forests. J. Ornithol. 149: 237–244. doi: 10.1007/s10336-007-0265-7
- Wegge, P., Vesteras, T. & Rolstad, J. 2010. Does timing of breeding and subsequent hatching in boreal forest grouse match the phenology of insect food for the chicks? Annales Zoologici Fennici 47: 251–260. doi: 10.5735/086.047.0403
- Wood, S.N. 2006. Generalized Additive Models: An Introduction with R. Chapman & Hall/CRC, Boca Raton, FL.
- Zuur, A.F., Ieno, E.N., Walker, N.J., Saveliev, A.A. & Smith, G.M. 2009. Mixed Effects Models in Ecology with R. Springer, New York.
- Zuur, A.F., Ieno, E.N. & Elphick, C.S. 2010. A protocol for data exploration to avoid common statistical problems. Methods Ecol. Evol. 1: 3–14. doi: 10.1111/j.2041-210X.2009.00001.x