
ABSTRACT
Capsule: We describe an effective monitoring protocol for detecting wildlife presence using autonomous recording units (ARUs) under different density scenarios.
Aims: To describe an effective protocol for monitoring a night-time singing passerine, the Dupont’s Lark Chersophilus duponti, using ARUs.
Methods: We estimate, using both simulations and field-collected data, the number of devices needed to reliably detect the species under different density scenarios and to assess recording time and the number of working days needed to ensure species detection. We placed between four and six ARUs in three Dupont’s Lark populations with different bird densities. Devices were programmed to record for 90 minutes per day for four consecutive days. ARUs were deployed between April and June of 2017.
Results: We found large differences in the number of recorders needed to detect species presence under different density scenarios, with more ARUs required in less dense populations. The number of ARUs needed to be differed between estimates obtained by simulations and with field data. This could be related to movements of the monitored species while they were singing. According to our results, the monitoring period for detecting the Dupont’s Lark could be as little as one hour of recording (from one hour before dawn to dawn) and two monitoring days, the minimum monitoring time needed to detect the species in all populations surveyed, regardless of density scenarios.
Conclusion: Our results cannot be directly extrapolated to other singing species since singing behaviour and characteristics greatly differ between species. We describe five logical steps to develop effective wildlife monitoring protocols using ARUs for detecting species presence, which may be helpful for future studies and with different species.
Due to the global decline in biodiversity, there is an urgent need for rapid and effective monitoring programs to assess the conservation status of species and to maximize the effectiveness of conservation effort (Brandes Citation2008, Potamitis et al. Citation2014). The minimum knowledge needed for species conservation is whether target species are present within an area, and how they are distributed (Li et al. Citation2010). Furthermore, well-designed monitoring programs with standardized equipment and protocols can provide highly repeatable and reliable data to estimate population trends (Pereira & Cooper Citation2006, Buxton et al. Citation2013). In this context, the use of acoustic Autonomous Recording Units (ARUs hereafter) as a tool for monitoring a wide range of taxa have rapidly increased in the last few years (e.g. Alquezar & Machado Citation2015, Heinicke et al Citation2015, Hedley et al. Citation2017, Van Wilgenburgh et al. Citation2017). ARUs function on their own while offering a suitable and efficient alternative for wildlife monitoring (see review for birds in Leach et al. Citation2016). Moreover, monitoring programs based on ARUs are not subject to many of the biases of traditional field monitoring (detection differences between observers, temporal bias, etc.), since this is a non-invasive technique that creates a permanent, repeatable and archivable record of surveys (Acevedo & Villanueva-Rivera Citation2006, Brandes Citation2008), which can be checked by different observers.
The use of ARUs has some disadvantages that must not be overlooked and may even rule out their use for monitoring purposes. Recorders usually have lower sensitivity than a human listener (Hutto & Stutzman Citation2009, Yip et al. Citation2017), which may be relevant for monitoring rare species or those with reduced vocal activity, and they have costs related to device acquisition. However, the main obstacle that has hampered the widespread use of ARUs is the large amount of expert time needed to analyse recordings (Hutto & Stutzman Citation2009, Digby et al. Citation2013). In recent years, significant progress has been made in audio signal processing and automated signal recognition, making it possible to process large data sets in a timely manner (see review in Knight et al. Citation2017), and therefore facilitating the use of ARUs as an automated non-invasive monitoring technique (Buxton et al. Citation2013).
The number of ARUs deployed per site for wildlife monitoring depends on the radius within which it is possible to effectively detect distant songs of monitored species. This radius can differ greatly among recorders, habitats and species (Digby et al. Citation2013, Bota et al. Citation2017, Yip et al. Citation2017). Likewise, monitoring time using ARUs, including recording time per day and number of days of monitoring, greatly differs between model species and study objectives. Monitoring periods in previous studies have varied between a few minutes to several hours per day (e.g. 10 min in a single day, Celis-Murillo et al. Citation2012; 6 h per day during seven consecutive months, Heinicke et al. Citation2015), making data analysis difficult even with the help of automated signal recognition software. The monitoring protocol can even differ between studies with a similar purpose, causing bias and making comparisons difficult. For example, Holmes et al. (Citation2015) monitored bird presence by obtaining eight recordings each day (recording length varied from 15 to 75 minutes) during a mean number of ten work-days, while Goyette et al. (Citation2011) monitored bird presence with a single recording but at least 48 h of continuous recording. The development of effective and standardized monitoring protocols will lead to greater time and economic efficiency and, when possible, to a greater degree of standardization in data collection (Celis-Murillo et al. Citation2009, Venier et al. Citation2012). This may allow the collection of repeatable and robust data that is comparable over time and between sites, which may be used as an effective technique for monitoring habitat quality (Lin et al. Citation2017) and changes in species presence or abundance (Buxton & Jones Citation2012, Buxton et al. Citation2013).
Although a protocol for the use of ARUs should be a pre-requisite for any monitoring program, we found no study assessing the recording time and number of ARUs needed for monitoring species presence within a patch. In this paper, we aim to describe an effective protocol for detecting the presence of a night-time singing passerine using ARUs. We chose the Dupont’s Lark Chersophilus duponti as a study model. Traditional field surveys developed for monitoring the Dupont’s Lark have always been based on auditory contacts due to its mainly nocturnal singing and evasive day-time behaviour (Pérez-Granados & López-Iborra Citation2017). Moreover, European Dupont’s Lark populations are patchily distributed over a large number of remote sites throughout peninsular Spain at different densities (Suárez Citation2010), which makes a spatially homogenized and well-distributed sampling effort difficult. The species is classified as ‘Near Threatened’ in the IUCN Red List (BirdLife International Citation2017) and as ‘Vulnerable’ in the European Red List of Birds (BirdLife International Citation2015). Therefore, we consider acoustic monitoring with ARUs as especially well suited to improving monitoring programs of this species. This is evidenced by the fact that some managers have begun to suggest the use of ARUs as an aid for monitoring the Dupont’s Lark (authors’ own data).
The main objectives of this paper were to (1) test and describe the procedure of an effective monitoring protocol using ARUs and automated song analyses for a night-time singing passerine, the Dupont’s Lark, under different plausible density scenarios; (2) determine the minimum number of recorders needed to detect species presence using virtual and field data under different density scenarios; and (3) estimate the minimum recording length per night and number of nights of monitoring needed to detect species presence under three different bird density scenarios. While our study was focused on the Dupont’s Lark, we describe a series of steps to develop an effective monitoring protocol that may be useful for different taxa.
Methods
Simulations under different density scenarios
We mathematically estimated the minimum number of ARUs needed to reliably detect the presence of the Dupont’s Lark within a virtual 100 ha habitat patch. For the experiment, we considered an effective continuum distance of 128 m, which is the effective continuum distance estimated for our ARU for the studied species for opposite singing direction (see Field Recording section for how continuum distance was estimated). By using a virtual space, we sequentially added virtual ARU devices one by one in up to 16 locations (constrained to not overlap in their effective continuum distance). In this way, the entire virtual area would eventually be covered. We simulated the presence of singing individuals under four different plausible bird density scenarios (0.1, 0.25, 1, and 4 males/10 ha) and built accumulation curves of detectability rate, as a function of the number of ARUs placed. We assumed that each virtual male was a singing male. We considered 0.1 males/10 ha as an example of habitat patches occupied with a much reduced presence of the species. The density scenarios of 0.25 and 1 males/10 ha correspond to the average Dupont’s Lark density estimated in Spain (0.27 males/10 ha, Suárez Citation2010), and to that found in core areas, such as the Layna moorland (1 males/10 ha, Garza et al. Citation2005), respectively. We used the density of 4 males/10 ha as an example of the highest densities estimated for the species in specific habitat patches (Suárez Citation2010).
Study area
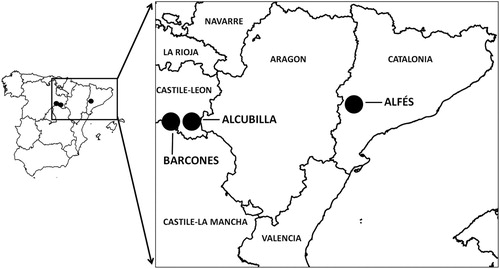
The study area comprised three Dupont’s Lark populations located in northeast Spain (). The Timoneda d’Alfés (hereafter Alfés) population was located in Lleida (Catalonia, 41.30°N, 0.37°E, ), occupying a low shrub-steppe dominated by Thyme Thymus vulgaris, Shepherd’s Tea Sideritis scordioides and rushrose (Helianthemum spp.). The Barcones (41.17°N, 2.49°W) and Alcubilla de las Peñas (hereafter Alcubilla; 41.15°N, 2.31°W) populations were located in Soria (Castile and León, ), both on natural steppes dominated by small shrubs, such as thyme (Thymus spp.), broom (Genista spp.) and lavender (Lavandula spp.). We selected these sites because they had a similar patch size (range 70–100 ha) but different Dupont’s Lark densities during 2017 (see below).
Figure 1. Location in northeast Spain of the three Dupont’s Lark populations surveyed during the breeding period of 2017.
Bird data
The abundance of Dupont’s Lark males at each site was estimated by a mapping method, based on four visits following line transects with a 500 m maximum detection band on each side of the observer (Pérez-Granados & López-Iborra Citation2017). Censuses were performed from 10 April to 20 June 2017 and only males were considered since females are presumed to be vocally inactive in this species. The distance of singing males from the observer was estimated acoustically and its location was recorded by a global positioning system (GPS) handset. The location of singing males detected in each visit were mapped (using ArcGIS 9.3, ESRI Citation2008) and a territory was defined when at least two registrations of a singing male (Bibby et al. Citation2000) were within a radius of 100 m, following the proposed methodology for counting Dupont’s Lark (Pérez-Granados & López-Iborra Citation2017). We assumed a probability of detection equal to 1, since Dupont’s Lark songs may be heard from up to 1 km away (Laiolo et al. Citation2007), and the entire habitat patches were covered during the censuses. Therefore, density (males/10 ha) in each population was calculated by dividing the total number of males estimated by patch size of suitable habitat. Censuses were carried out by walking at a constant speed (1–3 km) on dry and windless days. Census time was from 60 minutes before dawn to dawn, the maximum singing activity period for the species (Pérez-Granados & López-Iborra Citation2017). In Alcubilla, we estimated a mean density of 0.29 males/10 ha (2 males in 70 ha), 0.9 males/10 ha in Alfés (9 males in 100 ha) and 3.62 males/10 ha in Barcones (29 males in 80 ha). Therefore, we used these as study models of Dupont’s Lark populations with low (Alcubilla), medium (Alfés) and high density (Barcones).
Field recording using autonomous recording units
We custom designed our ARUs after performing field tests and a cost-effectiveness assessment for five acoustic recorders (Traba et al. Citation2017). In the assessment, we broadcasted Dupont’s Lark songs from nine fixed locations from 1 to 256 m, either towards or against the recorder positions aiming to estimate parameters such as maximum detection distance or effective continuum distance (distance at which at least one Dupont’s Lark song was automatically detected in all distance intervals, with no distance lag; own data). ARUs consisted of a USB Voice Recorder SK-001 with processor AC1517D72772-C and one integrated and single-channel electret microphone. Recorders were powered by 12 V/1.8 mAh Lipo batteries (minimum 15-hour autonomy recording continuously) and were also connected to a digital timer to program recorder activation and registration at selected times. Recordings were collected on 4 Gb microSD memory cards capable of storing 60 hours of continuous data. Equipment was protected in easily portable and weatherproof plastic boxes (60 × 80 × 160 mm) made cryptic by painting them greenish-brown with spots.
We placed six ARUs in each monitored population during the breeding season of 2017 (April–May). However, only four units worked properly in the Alfés population due to technical issues. Locations of recorders were selected to cover as much of the patch area as possible but were constrained to not overlap in their radius of effective continuum distance. ARUs were ground-located with omnidirectional microphones in an upward position and horizontally separated by at least 50 cm from natural vegetation to minimize sound blockage (Rempel et al. Citation2013). ARUs were left in each population for four consecutive days, and a digital timer was programmed to record for 90 minutes, from one hour before dawn to 30 minutes after dawn (Pérez-Granados & López-Iborra Citation2017). Recording time covers the maximum singing activity period of the species. Recordings were split into 30-minute length files for analytical purposes. Daily times of sunrise at the geographic location of the study areas were obtained from the Spanish Ministry of Development (http://www.fomento.es). We used a sample rate of 44.1 kHz and 16 bits in stereo mode for all recordings. Recordings were obtained in mp3 format and needed a post-transformation to wav format for analysis in Song Scope (see below).
Recording analyses
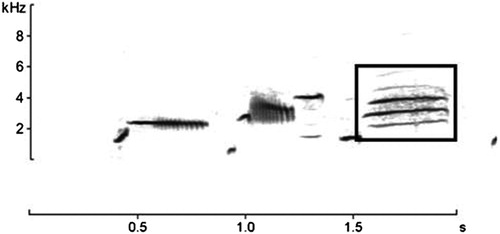
Automatic song recognition of Dupont’s Lark presence was performed using Song Scope 4.1.5 (Wildlife Acoustics Citation2011), which is one of the most efficient programs available for automatic song recognition (Knight et al. Citation2017). We created a target signal for Dupont’s Lark songs with the help of the spectrogram visualization tool in the software, which was used as a recognizer (Waddle et al. Citation2009). To build the recognizer, we used the final sequence of the species’ song; the ‘whee-ur-wheeee’ song described by Cramp (Citation1988), which is easily identified in a spectrogram and thus, can be easily detected by an automated classification software (). To build the recognizer, we adjusted sample rate and frequency ranges aiming to isolate the target signal and removed all lower and higher amplitude events (Waddle et al. Citation2009, Towsey et al. Citation2012). Song Scope output reported a number of events that matched the target signal. These events were visually and/or acoustically checked by the same researcher, to confirm Dupont’s Lark presence when needed.
Figure 2. Sonogram of a typical Dupont’s Lark song. Rectangle shows the final song of the species, which was used for building the recognizer.
Statistical analyses
We mathematically assessed the minimum number of ARUs needed to reliably detect the presence of the Dupont’s Lark under the four different density scenarios. We considered that the presence of the species was reliably detected when we reached 90% probability of detection. We estimated the number of times an individual was detected through 1000 randomizations using random locations for individuals and fixed locations for ARUs. We considered detection as the event when a virtual male fell within the effective radius of an ARU (128 m). Males were created to be static (i.e. not moving within a buffer), so these results should be considered as a minimum approximation to detection probability. The probability of detecting species presence for each simulated density scenario was evaluated through logistic regression using presence/absence of the species as a dependent variable and number of ARUs as a predictor variable. Data analyses were conducted in R 3.4.1 (R Core Team Citation2016). We also created accumulation curves of detectability rate with field data collected in the three populations surveyed as a function of the number of ARUs deployed.
Results
Simulations under different density scenarios
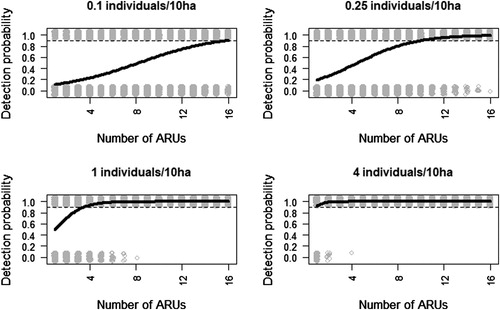
The number of ARUs needed to detect species presence in the considered virtual habitat patch (100 ha) differed greatly between the four density scenarios (). In the lowest density scenario (0.1 males/10 ha), 16 units were needed to ensure the detection of the species, while in those scenarios with a mean density of 0.25 and 1 males/10 ha, nine and four ARUs were sufficient to detect species presence with 90% of confidence, respectively (). Only one ARU was required to reach a similar confidence percentage when density increased to 4 males/10 ha, respectively ().
Figure 3. Estimates of the probability of detecting the presence of the Dupont’s Lark under four density scenarios in a 100 ha patch, given a different number of autonomous recording units (ARUs) deployed. Estimates were obtained through logistic regression using presence/absence as a dependent variable and the number of ARUs as a predictor variable. Grey points show the estimates (presence/absence) derived from 1000 randomizations using different random locations per individuals and regular locations for ARUs. The dotted line marks 90% probability to detect the species.
Estimation of ARUs needed to detect the species under real situations
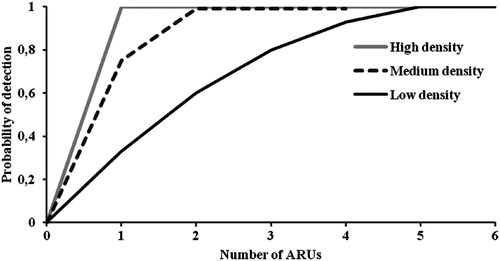
We found large differences in the number of ARUs needed to accurately detect the presence of the species between the three monitored populations. In the high density population, the species was detected in all locations where ARUs were placed (). However, two and four devices were needed to reliably detect Dupont’s Lark presence in the medium and low-density populations, respectively ().
Figure 4. The probability of detection of Dupont’s Lark as a function of the number of autonomous recording units (ARUs) deployed in three populations surveyed during the 2017 breeding period in Spain. Populations had different densities and curves were built for each density scenario separately. In the population of medium density only four ARUs were used and thus the curve is shorter.
Recording time and number of nights
Dupont’s Lark presence was detected in 39 out of 64 ARUs/night. In 37 of the cases (95%), the species was detected during the first night after ARUs were deployed. However, twice (5%) the species was not detected until the second night of monitoring, both cases in the low-density population. Therefore, the species was always detected within the first two nights of monitoring in all studied populations.
In relation to recording time, the species was always detected in the first hour of recording (N = 39), from one hour before dawn to dawn, with no new detections in the third recording phase (from dawn to 30 minutes after dawn). The best time for detecting the species was the period between one hour and 30 minutes before dawn, when the species was detected in 95% of the cases with known presence (N = 37), followed by the period between 30 minutes before dawn to dawn (82%, N = 32) and lastly the 30 minutes after dawn (46%, N = 18).
Discussion
In this paper, we describe for the first time a protocol for songbird monitoring using ARUs, in which we estimate the number of devices, the number of nights and recording time needed to ensure species detection. Our results suggest that this validation is needed and useful before starting a monitoring program with automatic acoustic recorders, since the probability of detection of the monitored species may vary greatly depending on bird singing characteristics, habitat and the number of ARUs deployed, recording time and the number of nights of monitoring. Moreover, we present a test of the number of ARUs needed to detect species presence based on simulations and field data. Our simulations showed that the number of devices needed to detect species presence depends on bird density ranging from 1 ARU per 100 ha under a high bird density scenario (4 males/10 ha) to 16 ARUs per 100 ha under the lowest density scenario (0.1 males/10 ha). We also found large differences in the number of ARUs required to detect species presence in the three surveyed populations according to mean bird density, with an increasing number of devices needed under lower bird density scenarios. The estimated number of ARUs needed to detect the monitored species in the highest density scenarios by both simulations and field data were in agreement, and indicate that Dupont’s Lark or a hypothetical species may be properly detected with a low number of devices and effort. However, estimates of the number of ARUs needed to reliably detect species presence in simulations performed with 0.25 and 1 male/10 ha were around two times greater than those obtained in the field in populations with similar densities. This contradiction highlights the need for field-testing results obtained by simulations under controlled situations. We are aware that much of the variation found can be explained by the fact that we considered virtual static individuals in simulations, while Dupont’s Lark tends to move while singing (Pérez-Granados & López-Iborra Citation2017, David Serrano pers. com.), which may increase the probability of individual detection.
Our results also highlight that a period of one hour of recording, from one hour before dawn to dawn, and two monitoring nights is sufficient time for detecting the presence in all surveyed Dupont’s Lark populations, regardless of population density. However, singing activity and singing behaviour differ greatly between species, which suggests a necessity to adequately estimate the maximum period of singing activity for monitored species before planning any monitoring programme, so as to increase the effectiveness and reduce time and cost of data analyses. For example, the first 30 minutes after dawn, when many of the European passerines are most vocally active, was the worst time for detecting the Dupont’s Lark during the monitoring period, due to its mainly nocturnal singing behaviour (Laiolo et al. Citation2007, Pérez-Granados & López-Iborra Citation2017). We also found differences in the number of nights of monitoring needed to reliably detect Dupont’s Lark as a function of bird density. The species was always detected during the first night of monitoring in the high and medium density populations, but it was not detected until the second night in the lowest density population. This could be related to different singing behaviour between populations according to mean density, since Dupont’s Lark song rate and song diversity are positively related to population size (Laiolo & Tella Citation2005, Citation2007, Laiolo et al. Citation2008). Likewise, the number of monitoring days needed to detect species presence also differs between species according to their singing behaviour. During spring 2017, we used the same ARU for detecting the presence of Western Capercaillies Tetrao urogallus in singing leks, and in some leks, the species was not detected until the seventh day of monitoring. In other leks, however, males were detected during the first day of monitoring (D. Guixé pers. comm.). Our results show that field tests to determine recording time and a number of nights needed for effective monitoring must be conducted before starting any monitoring programme using ARUs with other species, since they seem to differ greatly between considered species. Our results may be used as a source of comparison and protocol.
The use of ARUs for wildlife monitoring has rapidly increased in recent years (e.g. Heinicke et al. Citation2015, Hedley et al. Citation2017, Van Wilgenburgh et al. Citation2017), and with the rapidly decreasing costs of advanced technology (Hill et al. Citation2018), their use has already become an important tool in applied field studies (see review for birds in Shonfield & Bayne Citation2017). Therefore, the description of effective monitoring protocols can be useful to future studies and to improve monitoring programmes. We are aware that our study involved only a single model species, and surveys were carried out only during the breeding season, when detection probability is at its maximum. Therefore, we propose a minimum protocol for detecting the presence of a songbird species using ARUs. Our protocol is based on five steps that could be easily adapted to other species or contexts: (1) Estimate the effective distance at which the ARU is able to detect the species selected for monitoring; (2) estimate the number of nights/days of monitoring required to detect species presence with high probability; (3) assess the number and cost of devices needed for species detection under real field conditions; (4) limit the recording time to the period when singing activity is at a maximum; and (5) evaluate the cost and time required for data analyses. All recommendations should be assessed before beginning any monitoring programme, to reduce costs, keep the amount of recording time at a minimum and maximize monitoring effectiveness.
Acknowledgements
We also wish to thank J. Albarracín for his close collaboration and help. We would like to thank Adrián Barrero, Julia Gómez-Catasús, Daniel Bustillo-de la Rosa and Francesc Sardà-Palomera for their help throughout the study.
ORCID
Cristian Pérez-Granados http://orcid.org/0000-0003-3247-4182
Additional information
Funding
References
- Acevedo, M.A. & Villanueva-Rivera, L.J. 2006. Using automated digital recording systems as effective tools for the monitoring of birds and amphibians. Wildl. Soc. Bull. 34: 211–214. doi: 10.2193/0091-7648(2006)34[211:UADRSA]2.0.CO;2
- Alquezar, R.D. & Machado, R.B. 2015. Comparisons between autonomous acoustic recordings and avian point counts in open woodland savanna. Wilson J. Ornithol. 127: 712–723. doi: 10.1676/14-104.1
- Bibby, C.J., Burgess, N.D., Hill, D.A. & Mustoe, S. 2000. Bird Census Techniques. Academic Press, London.
- BirdLife International. 2015. European Red List of Birds. Office for Official Publications of the European Communitties, Luxembourg.
- BirdLife International. 2017. Chersophilus duponti (amended version of 2017 assessment). The IUCN Red List of Threatened Species e.T22717380A117697133.
- Bota G., Pérez-Granados C., Garza V., Giralt D., Rojo M. & Traba J. 2017. ¿Cuál graba mejor? Comparación de la eficacia de cinco grabadores de audio ante diferentes condiciones acústicas y distancia. XXIII Congreso Español de Ornitología [or Otnithological Spanish Congress], Badajoz, Poster.
- Brandes, T.S. 2008. Automated sound recording and analysis techniques for bird surveys and conservation. Bird Conserv. Int. 18: S163–S173.
- Buxton, R.T. & Jones, I.L. 2012. Measuring nocturnal seabird activity and status using acoustic recording devices: applications for island restoration. J. Field Ornithol. 83: 47–60. doi: 10.1111/j.1557-9263.2011.00355.x
- Buxton, R.T., Major, H.L., Jones, I.L. & Williams, J.C. 2013. Examining patterns in nocturnal seabird activity and recovery across the Western Aleutian Islands, Alaska, using automated acoustic recording. Auk 130: 331–341. doi: 10.1525/auk.2013.12134
- Celis-Murillo, A., Deppe, J.L. & Allen, M.F. 2009. Using soundscape recordings to estimate bird species abundance, richness, and composition. J. Field Ornithol. 80: 64–78. doi: 10.1111/j.1557-9263.2009.00206.x
- Celis-Murillo, A., Deppe, J.L. & Ward, M.P. 2012. Effectiveness and utility of acoustic recordings for surveying tropical birds. J. Field Ornithol. 83: 166–179. doi: 10.1111/j.1557-9263.2012.00366.x
- Cramp, S. 1988. The Birds of the Western Palearctic. Vol. V. Oxford University Press, Oxford.
- Digby, A., Towsey, M., Bell, B.D. & Teal, P.D. 2013. A practical comparison of manual and autonomous methods for acoustic monitoring. Methods Ecol. Evol. 4: 675–683. doi: 10.1111/2041-210X.12060
- Esri, I.N.C. 2008. ArcGIS 9.3. Environmental Systems Research Institute, Redlands.
- Garza, V., Suárez, F., Herranz, J., Traba, J., García de la Morena, E.L., Morales, M.B., González, R. & Castañeda, M. 2005. Space use and habitat selection of the endangered Dupont’s lark (Chersophilus duponti) in Spain: the breeding and postbreeding periods. Ardeola 52: 133–146.
- Goyette, J.L., Howe, R.W., Wolf, A.T. & Robinson, W.D. 2011. Detecting tropical nocturnal birds using automated audio recordings. J. Field Ornithol. 82: 279–287. doi: 10.1111/j.1557-9263.2011.00331.x
- Hedley, R.W., Huang, Y. & Yao, K. 2017. Direction-of-arrival estimation of animal vocalizations for monitoring animal behavior and improving estimates of abundance. Avian Conserv. Ecol. 12: 6. DOI: 10.5751/ACE-00963-120106.
- Heinicke, S., Kalan, A.K., Wagner, O.J., Mundry, R., Lukashevich, H. & Kühl, H.S. 2015. Assessing the performance of a semi-automated acoustic monitoring system for primates. Methods Ecol. Evol. 6: 753–763. doi: 10.1111/2041-210X.12384
- Hill, A.P., Prince, P., Piña Covarrubias, E., Doncaster, C. P., Snaddon, J. L. & Rogers, A. 2018. Audiomoth: evaluation of a smart open acoustic device for monitoring biodiversity and the environment. Methods Ecol. Evol. 9: 1199–1211. doi: 10.1111/2041-210X.12955
- Holmes, S.B., Tuininga, K., McIlwrick, K.A., Carruthers, M. & Cobb, E. 2015. Using an integrated recording and sound analysis system to search for Kirtland’s Warbler (Setophaga kirtlandii) in Ontario. Can Field-Naturalist 129: 115–120. doi: 10.22621/cfn.v129i2.1688
- Hutto, R.L. & Stutzman, R.J. 2009. Humans versus autonomous recording units: a comparison of point-count results. J. Field Ornithol. 80: 387–398. doi: 10.1111/j.1557-9263.2009.00245.x
- Knight, E., Hannah, K., Foley, G., Scott, C., Brigham, R. & Bayne, E. 2017. Recommendations for acoustic recognizer performance assessment with application to five common automated signal recognition programs. Avian Conserv. Ecol. 12: 14. DOI: 10.5751/ACE-01114-120214
- Laiolo, P. & Tella, J.L. 2005. Habitat fragmentation affects culture transmission: patterns of song matching in Dupont’s lark. J. App. Ecol. 42: 1183–1193. doi: 10.1111/j.1365-2664.2005.01093.x
- Laiolo, P. & Tella, J.L. 2007. Erosion of animal cultures in fragmented landscapes. Front. Ecol. Environ. 5: 68–72 doi: 10.1890/1540-9295(2007)5[68:EOACIF]2.0.CO;2
- Laiolo, P., Vögeli, M., Serrano, D. & Tella, J.L. 2007. Testing acoustic versus physical marking: two complementary methods for individual based monitoring of elusive species. J. Avian Biol. 38: 672–681. doi: 10.1111/j.2007.0908-8857.04006.x
- Laiolo, P., Vögeli, M., Serrano, D. & Tella, J.L. 2008. Song diversity predicts the viability of fragmented bird populations. PLoS ONE 3: e1822 doi: 10.1371/journal.pone.0001822
- Leach, E.C., Burwell, C.J., Ashton, L.A., Jones, D.N. & Kitching, R.L. 2016. Comparison of point counts and automated acoustic monitoring: detecting birds in a rainforest biodiversity survey. Emu 116: 305–309. doi: 10.1071/MU15097
- Li, S., Wang, D., Gu, X. & McShea, W. J. 2010. Beyond pandas, the need for a standardized monitoring protocol for large mammals in Chinese nature reserves. Biodivers. Conserv. 19: 3195–3206. doi: 10.1007/s10531-010-9886-x
- Lin, T.H., Fang, S.H. & Tsao, Y. 2017. Improving biodiversity assessment via unsupervised separation of biological sounds from long-duration recordings. Sci. Rep. 7: 4547. doi: 10.1038/s41598-017-04790-7
- Pereira, H.M. & Cooper, H.D. 2006. Towards the global monitoring of biodiversity change. Trends Ecol. Evol. 21: 123–129. doi: 10.1016/j.tree.2005.10.015
- Pérez-Granados, C. & López-Iborra, G.M. 2017. Assessment of counting methods used for estimating the number of territorial males in the endangered Dupont’s lark. Ardeola 64: 75–84. doi: 10.13157/arla.64.1.2017.sc2
- Potamitis, I., Ntalampiras, S., Jahn, O. & Riede, K. 2014. Automatic bird sound detection in long real-field recordings: applications and tools. App. Acoustics 80: 1–9. doi: 10.1016/j.apacoust.2014.01.001
- R Core Team. 2016. R: a language and environment for statistical computing. R Foundation for Statistical Computing, Vienna. http://www.R-project.org.
- Rempel, R.S., Francis, C.M., Robinson, J.N. & Campbell, M. 2013. Comparison of audio recording system performance for detecting and monitoring songbirds. J. Field Ornithol. 84: 86–97. doi: 10.1111/jofo.12008
- Shonfield, J. & Bayne, E.M. 2017. Autonomous recording units in avian ecological research: current use and future applications. Avian Conserv. Ecol. 12: 14. DOI: 10.5751/ACE-00974-120114.
- Suárez, F. (ed). 2010. [La alondra ricotí, Chersophilus duponti] Dirección General para la Biodiversidad. Ministerio de Medio Ambiente y Medios Rural y Marino, Madrid (in Spanish).
- Towsey, M., Planitz, B., Nantes, A., Wimmer, J. & Roe, P. 2012. A toolbox for animal call recognition. Bioacoustics 21: 107–125. doi: 10.1080/09524622.2011.648753
- Traba, J., Pérez-Granados, C., Bota, G., Giralt, D. & Albarracín, J.L. 2017. Nuevas tecnologías para viejos trabajos. Uso de grabadores automáticos para la detección y censo de especies raras y amenazadas. El caso de la alondra ricotí en Lleida y otras poblaciones pequeñas. Universidad Autónoma de Madrid. Madrid. Unpublished report.
- Van Wilgenburg, S.L., Sólymos, P., Kardynal, K.J. & Frey, M.D. 2017. Paired sampling standardizes point count data from humans and acoustic recorders. Avian Conserv. Ecol. 12. DOI: 10.5751/ACE-00975-120113.
- Venier, L.A., Holmes, S.B., Holborn, G.W., Mcilwrick, K.A. & Brown, G. 2012. Evaluation of an automated recording device for monitoring forest birds. Wildl. Soc. Bull. 36: 30–39. doi: 10.1002/wsb.88
- Waddle, J.H., Thigpen, T.F. & Glorioso, B.M. 2009. Efficacy of automatic vocalization recognition software for anuran monitoring. Herpetol. Conserv. Biol. 4: 384–388.
- Wildlife Acoustics. 2011. Song Scope User Manual: bioacoustics software (Version 4.0). Documentation. Wildlife Acoustics, Inc., Maynard, MA.
- Yip, D.A., Leston, L., Bayne, E.M., Sólymos, P. & Grover, A. 2017. Experimentally derived detection distances from audio recordings and human observers enable integrated analysis of point count data. Avian Conserv. Ecol. 12:11. DOI: 10.5751/ACE-00997-120111.