
ABSTRACT
Capsule: The first European Bird Census Council (EBCC) Atlas of European Breeding Birds has been widely used in scientific publications.
Aims: To quantify how scientific publications have used data from the first European Bird Census Council (EBCC) Atlas of European Breeding Birds, what the topics of these studies have been, and to identify key aspects in which a second European Breeding Bird Atlas will provide new opportunities for basic and applied science.
Methods: We searched Google Scholar to find papers published in scientific journals that cited the first atlas. We analysed the contents of a random selection of 100 papers citing this atlas and described the way these papers used information from it.
Results: The first atlas has been cited in 3150 scientific publications, and can be regarded as a fundamental reference for studies about birds in Europe. It was extensively used as a key reference for the studied bird species. A substantial number of papers re-analysed atlas data to derive new information on species distribution, ecological traits and population sizes. Distribution and ecology were the most frequent topics of studies referring to the atlas, but this source of information was used in a diverse range of studies. In this context, climate change, impact of agriculture and habitat loss were, by order, the most frequently studied environmental pressures. Constraints in the atlas, such as the poor coverage in the east of Europe, the lack of information on distribution change and the coarse resolution were identified as issues limiting the use of the atlas for some purposes.
Conclusions: This study demonstrates the scientific value of European-wide breeding bird atlases. A second atlas, with its almost complete coverage across Europe, the incorporation of changes in distribution between the two atlases and the inclusion of modelled maps at a resolution of 10 × 10 km will certainly become a key data source and reference for researchers in the near future.
The collection of biodiversity data over large geographical areas is essential in order to adequately inform conservation policy (Chiarucci et al. Citation2011, Schmeller et al. Citation2015). Great efforts have been made in recent years to integrate biodiversity information from thousands of sources into global data depositories, such as the Global Biodiversity Information Facility (GBIF Citation2019) and the Map of Life (MOL Citation2019), among others. These depositories gather a huge amount of open access data, and thus allow scientists to address relevant issues on biodiversity and conservation. However, an aspect that is sometimes neglected is that differences with respect to data sampling, storage and mobilization often lead to bias in large-scale biodiversity patterns (Beck et al. Citation2014).
Biodiversity data are compiled in very different ways across Europe (Voříšek & Marchant Citation2003, EuMon Citation2019). In western and central European countries, citizen science – understood as a strong partnership between amateur and professional scientists – has constituted a fundamental pillar for the compilation of biodiversity data (Bell et al. Citation2008, Dickinson et al. Citation2010). In contrast, the tradition of data collection in the eastern half of Europe and the Balkans has been often based on professional work directed by academies of science or similar governmental institutions (Budinski et al. Citation2010). In addition, methodological differences among countries are influenced by socio-political contexts, specific national targets, fieldwork and data mobilization approaches, and geographical particularities.
Conscious of the value of integrating national data to aid the understanding of large-scale patterns of distribution and abundance in birds, European ornithologists have a long tradition of cooperation among national organizations. Developing from a series of meetings aimed at greater international collaboration in ornithology, the European Ornithological Atlas Committee (EOAC) was set up in 1972. Its representatives soon realized that a Europe-wide atlas could be produced from national surveys if common standards were adopted (Greenwood Citation2017). The EOAC later changed its name and formalized its organizational structure to become the European Bird Census Council (EBCC), the organization that produced the EBCC Atlas of European Breeding Birds (Hagemeijer & Blair Citation1997), hereafter named EBBA1.
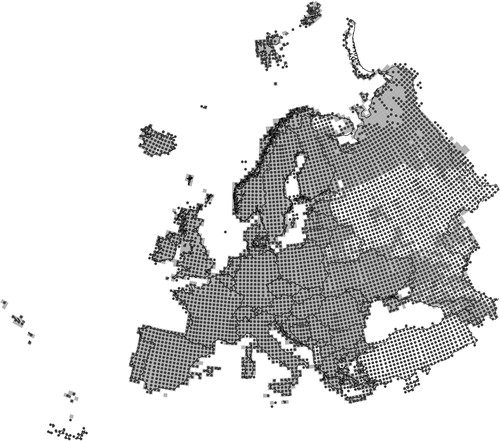
EBBA1 integrated data on the distribution and abundance of breeding birds, compiled at national level, into a single pan-European collaborative work. Thanks to the coordinated efforts of thousands of ornithologists and birdwatchers, accurate information on distribution and abundance was gathered for 495 species in 3950 50 × 50 km squares (). After publication EBBA1 data were made accessible to researchers, first under direct request to the EBCC Executive Committee and, since 2015, as open access via the Global Biodiversity Information Facility (GBIF Citation2019). EBBA1 has represented one of the few sources of information concerning distribution of bird populations at a continental scale and consequently has been widely employed in fundamental and applied research and for conservation-oriented publications (e.g. BirdLife International Citation2004). However, an analysis of the use of EBBA1 in research to assess its impact in the scientific community has not been done.
Figure 1. 50 × 50 km squares for which data were reported for EBBA1 (light grey squares) and for EBBA2 (dark grey dots). EBBA1 data came from 3949 squares and coverage for EBBA2 was 5095 squares (provisional values yet). These values correspond, respectively, to 74% and 96% of the total number of squares in the area shown in the map. It is very important to highlight that the completeness of the coverage was very low in EBBA1 in the northern half of Russia and in some parts of Caucasus and the Western Balkans. Data collection for EBBA2 was mainly carried out from 2013 to 2017 in the more than 50 participating countries, including much better coverage in the European parts of Russia and Kazakhstan, the Caucasus countries, the Canary Islands, Cyprus and the whole of Turkey.
In this paper, we show the potential of using such pan-European distribution data in research. More specifically, we review how EBBA1 was used in scientific literature and what the aims of these studies were. At the moment of writing this article, the Second European Breeding Bird Atlas (EBBA2) (Keller Citation2014, EBBA2 Citation2019) is finalizing the compilation of updated data on the distribution of all breeding bird species (). Following this review of the literature we discuss how this knowledge has been incorporated in the aims, organization and methodological choices for the EBBA2 project. Finally, we show our vision of current efforts in the integration of continental bird data and anticipate how EBBA2 will contribute to basic and applied research.
Methods
We considered Google Scholar as our source of information to analyse the use of EBBA1 in scientific publications. This search facility is freely and easily accessible, provides similar results to Thompson’s Institute for Scientific Information Citation Index (Pauly & Stergiou Citation2005), and it has become increasingly popular in recent years (de Winter et al. Citation2014). We conducted the literature search in December 2016. We queried the sequence of words ‘EBCC Atlas of European Breeding Birds’ and downloaded results in a database. Despite the potential scientific interest of information collected in books, theses, technical reviews and ‘grey’ literature, we removed these types of works from the original database and kept only papers published in scientific journals. Then we performed a random selection of 100 papers from the total available using the Wichmann–Hill number generator (Wichmann & Hill Citation1982). Selected papers (shown with a symbol * in this article) were read by SH to analyse the general use of EBBA1 in science.
We addressed three specific questions related to how EBBA1 was used in scientific publications: (1) was EBBA1 used only for its information about birds? Or did it also attract researchers’ attention regarding the way the project was organized? (2) Were EBBA1 data re-analysed in these scientific publications? (3) When new analyses of EBBA1 were performed, what were the purposes? In addition, we addressed five questions related to the subject matter of the papers that cited EBBA1: (1) What were the major research topics of papers that cited EBBA1? (2) What were the pressures on biodiversity addressed in the papers that cited EBBA1? (3) Was EBBA1 used more often in papers that studied observed change in the past or predicted future change? (4) Was EBBA1 more often used in international, national or subnational studies? (5) Was EBBA1 more often used in studies about a single bird species, multiple bird species or studies that included several groups (birds plus others)?
Results
How EBBA1 was used in scientific publications
Our search in Google Scholar showed that 3150 scientific papers published in journals referred to ‘EBCC Atlas of European Breeding Birds’. From the 100 papers randomly selected for this study 87 papers were in written in English and 13 in nine other languages: German (5), Russian (1), Spanish (1), French (1), Italian (1), Polish (1), Dutch (1), Catalan (1) and Norwegian (1). All these papers are listed in online Appendix S1.
A total of 96 papers analysed in this study were interested in the EBBA1 data on breeding bird species and four papers focused on the methodology and on how the project was organized. A total of 76 papers referred to the general patterns of species distribution, abundance or ecology shown in EBBA1, but did not use atlas data to conduct new analyses. Nevertheless, 19 papers re-analysed EBBA1 data for three main purposes: analyses of species distribution (8 papers), determining species ecological traits (7) and analyses focusing on population sizes (4).
Subject matter of the papers that cited EBBA1
EBBA1 was cited for many different scientific purposes within the field of biodiversity research. Nevertheless, two topics stood out: species distribution (50 papers) and ecology (44 papers). Other topics such as climate, conservation, trends or abundance were addressed by a smaller number of papers ().
Figure 2. Number of papers citing EBBA1 that were attributed to each of the analysed main topics.
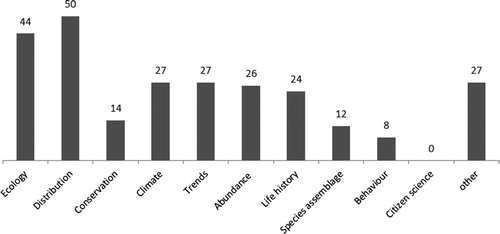
Climate change was the environmental pressure more frequently reported in papers referencing EBBA1, accounting for a total of 12 papers. Concern on how changes in agricultural practices are affecting farmland birds was the topic of five papers, habitat loss and environmental impact associated with invasive alien species were studied in four papers each and pollution was addressed in three papers.
EBBA1 was a reference for 22 papers that incorporated an assessment of temporal change in past-to-present approaches. Future projections were at least partly addressed in five papers.
Our survey showed that 54 of the analysed papers studied patterns at subnational level, 28 papers at national level; 18 papers worked at the European scale (or substantial part of the continent) and five addressed research at the global scale.
EBBA1 presented the data in a relatively coarse 50 × 50 km grid. Among the studies citing EBBA1, 16 studied biogeographical or macroecological patterns at the same spatial resolution used in this atlas. In 25 papers analyses were conducted at finer resolutions, usually using EBBA1 as background information but in few cases re-analysing its data and then applying the results at finer resolution.
EBBA1 was cited predominantly in papers on birds, namely in 48 papers on single species and 46 treating several species. Five papers focused on birds and other biological groups. Only one paper was not interested in birds but exclusively in plants.
Discussion
How EBBA1 was used in scientific publications
Our analyses show that EBBA1 was used in very different ways. Very often EBBA1 was employed as background information for studies about a particular species, such as that of the status of the Bearded Reedling Panurus biarmicus in Italy (Brichetti & Grattini Citation2008)*or the decline of the Red-backed Shrike Lanius collurio in Zealand, Denmark (Pedersen et al. Citation2011)*. In other cases, EBBA1 information was viewed in a wider context and represented a general reference for the distribution of groups of bird species, such as for the ranges of boreal birds (Virkkala & Rajasärkkä Citation2007)*.
A substantial proportion of the sampled papers not only cited EBBA1 data but presented novel analyses using it. Some of the papers that re-analysed the data were interested in deriving information on species distribution. For example, EBBA1 data were used (together with data from the Atlas of Southern African Birds, Harrison et al. Citation1997), to model species distributions at the Last Glacial Maximum and then analyse the contrasting late-Quaternary histories for Southern and Northern Hemisphere bird species (Huntley et al. Citation2013)*. EBBA1 was also used to derive species ecological traits based on the species’ respective distributions. For example Gaüzère et al. (Citation2015)* used EBBA1 data to calculate species-specific temperature indices, representing the preferred climate conditions of species based on temperatures within their area of distribution and then showed a fine-scale and short-term adjustment of community composition to temperature changes. An example of EBBA1 data use to derive information on species population size is the study of Møller et al. (Citation2011)* who obtained population sizes from this atlas to determine that migratory divides constitute barriers to dispersal with consequences for ecology and evolution of populations.
Topics in papers referring to EBBA1
Main topics
EBBA1 was widely used as a reference for bird species distribution, population size and ecology in many scientific publications interested in a variety of scientific topics. Many distributional studies conducted at national or regional scales referred to EBBA1 to provide a wide geographical context for the species of interest. This background information was applied in a variety of circumstances, such as the delimitation of Important Bird Areas in Macedonia (Velevski et al. Citation2010)* and the distribution of birds of prey in Belarus (Dombrovski & Ivanovski Citation2005)*. Information from EBBA1 was widely used as a suitable reference in papers on species ecology. A first example is a study that used bird-land cover associations based on EBBA1 data in order to determine the influence of this predictor (and others) on beta diversity for European birds (Keil et al. Citation2012)*. A second example is the use of EBBA1 as a reference for the habitat preferences of Dartford Warbler Sylvia undata in the context of assessing its status in the UK (Wotton et al. Citation2009)*.
Conservation also emerged as a very relevant topic and information from EBBA1 was used for a wide variety of purposes. For instance, the evaluation of the network of protected areas by Sándor & Domşa (Citation2012)* who determined additional areas to better preserve forest specialist birds on the basis of a thorough analysis of habitat preferences, the assessment of species of conservation concern as described by Keller et al. (Citation2010)* who assessed the international importance of the breeding populations of bird species in Switzerland by estimating the percentage of the national population using EBBA1 as reference, and the evaluation of land use policies as described by Eggers et al. (Citation2009)*, who used the EBBA1 dataset to evaluate whether biofuel policies were detrimental to biodiversity in agricultural landscapes in Europe.
Pressures on biodiversity
Five out of the six main categories of environmental pressure according to Aichi Target B (Secretariat of the Convention on Biological Diversity Citation2014) were found as topics in the analysed papers, namely climate change, agricultural practices, habitat loss, invasive alien species and pollution. EBBA1 data had a prominent role in modelling climatic ranges of bird species in the context of predictions of impact of climate change on their populations either at continental (e.g. Huntley et al. Citation2004)*, national (e.g. Reif et al. Citation2013, Koleček et al. Citation2014)* and local level (e.g. Flousek et al. Citation2015)*. Beyond our random selection of papers in journals, it is noticeable to mention that EBBA1 was essential to model European species distributions under future climatic scenarios (Huntley et al. Citation2008). Effects of agricultural practices on birds were also addressed by some of the analysed papers. For instance, Meller et al. (Citation2015)* used EBBA1 data and predicted that the magnitude of range shifts due to climate change was far greater than the impact of land conversion to bioenergy plantations within the European Union.
Temporal focus
Since EBBA1 maps provided just a single time reference, and there is no comparable data source for another period yet, no study used the data from this atlas to explicitly analyse temporal changes in bird distribution. However, some authors used the information written in the species accounts in EBBA1 to describe general patterns of distribution or population change, such as in the study of the decline in Tree Sparrow Passer montanus populations in Poland (Tomiałojć Citation2012)*. EBBA1 data were cited in several publications to project species distributions into the future, such as the prediction of a considerable risk of extinction within the Bavarian Forest National Park as a result of global warming (Bässler et al. Citation2010).
Scale
To date EBBA1 is certainly among the most relevant original works that map the occurrence of breeding birds in the whole of Europe. Therefore, it has been widely employed as a key reference for the European distribution of birds in studies carried out at subnational, national, continental and global scales. For example, Chiron et al. (Citation2009)* used EBBA1 data to explore the relationship between the geographical pattern of richness of native bird species and that of exotic bird species in Europe. However, EBBA1 was mostly used as a reference concerning species distribution at subnational level, such as in the study of the impact of radiation from the Chernobyl nuclear power plant on birds by Møller et al. (Citation2010)*.
Spatial resolution
The detail at which a geographical dataset defines the location of its features is a key element for studies on species distribution. EBBA1 provided data in a 50 × 50 km grid and, as shown in many of the examples mentioned so far, this cell size met the needs of many of the analyses required to make progress in diverse fields of the ornithology. For example, Carrascal & Seoane (Citation2009)* aggregated original 10 × 10 km data for Bonelli’s Eagle Aquila fasciata from a Spanish atlas to a coarser 50 × 50 km resolution because they considered that in the context of analysing of factors affecting its distribution in Spain, the latter provided a higher certainty about the species occurrence in each cell (absences more likely to be real).
Biodiversity focus
EBBA1 has undoubtedly created one of the most complete databases on the distribution of birds in Europe. Other large-scale studies have reached a similar status for other taxonomic groups. Together they have conformed an excellent dataset for many studies interested in biodiversity in a broader sense. For example, Huntley et al. (Citation2004)* used distribution data from plants, birds and insects to predict that climatic model performance was related neither to major taxonomic group nor to trophic level.
Perspectives for the new European Breeding Bird Atlas
At the time of compiling information for the analyses shown in this article, a total of 3150 scientific journal papers referred to the ‘EBCC Atlas of European Breeding Birds’. A new Google Scholar search would find that this is clearly an outdated number. All these values illustrate the recognition EBBA1 has received in the scientific community, but also the very high research potential of an atlas update.
The analysis of publications citing EBBA1 revealed issues that are important to be taken into account for other projects and in particular for the Second European Breeding Bird Atlas, hereafter called EBBA2. Some of the papers analysed in this study made specific comments on the limitations of EBBA1 data, referring especially to deficiencies in the coverage, such as in the eastern part of the continent and the Balkans (Keil et al. Citation2012)*. EBBA1 gaps of information resulted mainly from limitations in coordination, fieldwork capacity and data flow at that time. To launch the new project and update in the best possible manner the EBBA1 information, EBCC constituted an EBBA2 steering committee whose members had experience in organizing surveys, analysing the data and interpreting the results. These members came from different parts of Europe because bird atlas approaches differ depending on the biogeographical, cultural, traditional and economic contexts (Greenwood Citation2007). Then, an EBBA2 coordination team was established to deliver the central functions of running the atlas project and of keeping a fluent communication within the network of scientists developing methodologies at the European level, coordinators organizing fieldwork at national level and skilled ornithologists doing the fieldwork. This close collaboration guaranteed the top-down integration from a bottom-up approach taking the very diverse situation in Europe into account (Herrando et al. Citation2014).
The analysis of the papers that cited EBBA1 showed that many studies focused on changes in occurrence. However, none could use that dataset to study changes in distribution (see Temporal focus). Updating EBBA1 information will provide many opportunities to analyse changes in distribution and, thus to investigate the environmental pressures driving these changes. Therefore, one of the most important methodological aspects of EBBA2 was to maximize comparability between the two atlases. Consequently, the same UTM 50 × 50 km grid, breeding codes and abundance codes as used in EBBA1 were adopted for EBBA2. This grid was also selected in compliance with projects working on other taxonomic groups, for example, see Sillero et al. (Citation2014) for the new atlas of amphibians and reptiles of Europe, which will provide a good basis for cross-taxa analyses in the future (see Biodiversity focus). However, robust analyses of change do not only depend on the use of the same geographical units but also on the particularities of the fieldwork done in each square in each atlas. To overcome this difficulty, EBBA1-EBBA2 species distribution change was incorporated in the EBBA2 project by means of taking into account information on the fieldwork process for the two atlases. In fact, change was not calculated for all squares but for a subsample that were sufficiently well covered in the two atlases. These squares were determined after a series of analyses that incorporated information on the reported completeness of coverage and the total number of species detected as well as their deviance from modelled expected richness, among others. Finally, in the overall framework of improving the quality of the data, EBBA2 implemented a novel approach by incorporating highly standardized surveys within a sample of 10 × 10 km squares. The more immediate aim of this survey was to generate detailed maps of species breeding occurrence (see next paragraph), but these standardized surveys could provide potential added value for robust comparisons in the future (see approach implemented for this purpose in Balmer et al. Citation2013).
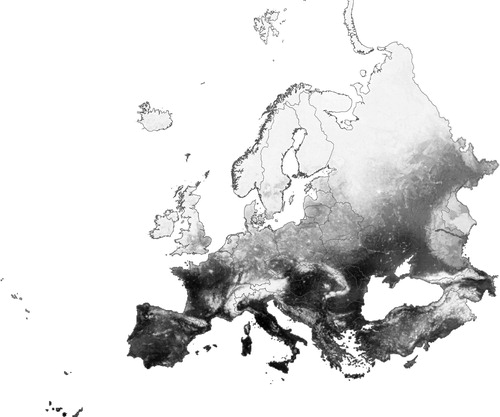
Gaston et al. (Citation2008)* pointed out that, despite the progress made by EBBA1 for the quantitative assessment of species ranges, this coarse resolution limited its direct value for most practical conservation planning exercises. The higher the resolution the better the inferences that can be made concerning issues like distribution (e.g. presence in protected areas) and ecology (e.g. habitat requirements, climatic niches). Thus, in addition to the compilation of data at the 50 × 50 km scale, a protocol to collect standardized data across the whole of Europe was implemented in EBBA2 which allowed modelling of species occurrence at a resolution of 10 × 10 km. This information was mostly derived from timed visits (complete lists of species obtained at a given site and in given time) specifically designed for atlas work and from standardized common bird monitoring schemes. Given the complexity of the data, with many different sources, field methods and intensities of coverage across Europe, the EBCC convened a group of experts in a Spatial Modelling Group to approach this pan-European spatial distribution modelling in the best possible way. A final selection of more than 35 000 EBBA2 standard surveys obtained in over 17 000 different 10 × 10 km squares was available for modelling (). This dataset incorporated several elements to allow the robust assessment of the detection probability for many species, i.e. repeated visits at a sample of available squares, date, field method and duration of the survey. A total of 40 environmental predictors, plus detection probability, were used to model species distribution averaging 10 different models (see for an example for Turtle Dove Streptopelia turtur). Finally, a cross-validation procedure was conducted in order to quantify the predictive accuracy of the model (Herrando et al. Citation2017).
Figure 3. Location of the 17 000 10 × 10 km squares with EBBA2 standardized surveys. In the context of this project, all these squares were surveyed in a standardized manner between one and ten times. Each survey have a complete list of all species recorded in a given time frame at a particular site and on a single day.
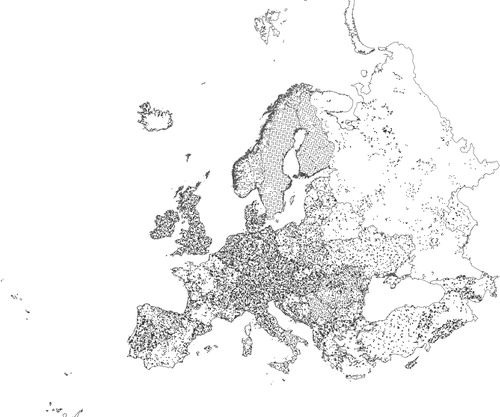
Figure 4. Pilot map showing the probability of occurrence for the Turtle Dove Streptopelia turtur in all 10 × 10 km squares in Europe based on EBBA2 spatial distribution modelling (light-dark grey indicates low-high probability of occurrence, respectively).
Outlook for research
The present study documents the applications of EBBA1 in scientific publications and provides examples of why and how researchers may approach the coming EBBA2 data. This provides the possibility to forge an early connection with future research and encourage new ideas on how the new data can be used and how to increase the use of papers using this data. At the time of writing this article EBBA2 is still an ongoing project. The plan is to publish a book by late 2020 and produce a web-based product some time after publication.
We are convinced that EBBA2 will deliver data and information that will offer excellent and unique opportunities for further scientific analyses and publications. Spatio-temporal comparisons based on the atlas data are a powerful asset that could be applied to understand population dynamics of breeding birds across Europe. We see ample opportunities for use concerning the major topics that already have been addressed using the EBBA1 data, including environmental pressures according to Aichi Target B (see Pressures on biodiversity), such as impacts of climate and land-use changes or the spread of invasive (bird) species. Other subjects of interest could be the effects of the Natura2000 network and other conservation policies, identification of new priority areas for conservation, determination of species hotspots (also concerning other taxonomic groups), risks associated with propagation of zoonoses, and flyway research.
Within the context of biodiversity declines across Europe, the new European Breeding Bird Atlas represents a unique opportunity for researchers and policy makers to deliver valuable research to underpin conservation action across the continent. We are confident that, as it happened with its predecessor, EBBA2 will become a landmark for bird conservation in this region.
Acknowledgements
We would like to thank all national coordinators and data providers as well as ten-thousands of ornithologists and birdwatchers across Europe that built EBBA1 a few decades ago and those that are now making EBBA2 possible. We also thank the many organizations and people that provided financial support in both projects.
ORCID
Sergi Herrando http://orcid.org/0000-0002-5153-7970
Verena Keller http://orcid.org/0000-0002-5905-8739
References
- Balmer, D.E., Gillings, S., Caffrey, B.J., Swann, R.L., Downie, I.S. & Fuller, R.L. 2013. Bird Atlas 2007–11: The Breeding and Wintering Birds of Britain and Ireland. BTO Books, Thetford.
- Bässler, C., Müller, J., Hothorn, T., Kneib, T., Badeck, F. & Dziock, F. 2010. Estimation of the extinction risk for high-montane species as a consequence of global warming and assessment of their suitability as cross-taxon indicators. Ecol. Indic. 10: 341–352. doi: 10.1016/j.ecolind.2009.06.014
- Beck, J., Böller, M., Erhardt, A. & Schwanghart, W. 2014. Spatial bias in the GBIF database and its effect on modelling species’ geographic distributions. Ecol. Inform. 19: 10–15. doi: 10.1016/j.ecoinf.2013.11.002
- Bell, S., Marzano, M., Cent, J., Kobierska, H., Podjed, D., Vandzinskaite, D., Reinert, H., Armaitiene, A., Grodzińska-Jurczak, M. & Muršič, R. 2008. What counts? Volunteers and their organisations in the recording and monitoring of biodiversity. Biodivers. Conserv. 17: 3443–3454. doi: 10.1007/s10531-008-9357-9
- BirdLife International. 2004. Birds in Europe: Population Estimates, Trends and Conservation Status. BirdLife Conservation Series No 12.
- Brichetti, P. & Grattini, N. 2008. Distribuzione, consistenza ed evoluzione delle popolazioni di basettino Panurus biarmicus nidificanti in Italia nel periodo 1980-2006. Avocetta 32: 47–53 (in Italian).
- Budinski, I., Čulina, A., Mikulić, K. & Jurinović, L. 2010. Bird species that have significantly changed breeding range on Croatian coastal area: comparison of 30 years old data and recent knowledge. Bird Census News 23: 49–58.
- Carrascal, L.M. & Seoane, J. 2009. Factors affecting large-scale distribution of the Bonelli’s eagle Aquila fasciata in Spain. Ecol. Res. 24: 565–573. doi: 10.1007/s11284-008-0527-8
- Chiarucci, A., Bacaro, G. & Scheiner, S.M. 2011. Old and new challenges in using species diversity for assessing biodiversity. Philos. Trans. R. Soc. Lond. B Biol. Sci. 366: 2426–2437. doi: 10.1098/rstb.2011.0065
- Chiron, F., Shirley, S. & Kark, S. 2009. Human-related processes drive the richness of exotic birds in Europe. Proc. R. Soc. B 276: 47–53. doi: 10.1098/rspb.2008.0994
- de Winter, J.C.F., Zadpoor, A.A. & Dodou, D. 2014. The expansion of Google Scholar versus Web of Science: a longitudinal study. Scientometrics 98: 1547–1565. doi: 10.1007/s11192-013-1089-2
- Dickinson, J.L., Zuckerberg, B. & Bonter, D.N. 2010. Citizen science as an ecological research tool: challenges and benefits. Annu. Rev. Ecol. Evol. Syst. 41: 149–172. doi: 10.1146/annurev-ecolsys-102209-144636
- Dombrovski, V. C. & Ivanovski, V.V. 2005. New data on numbers and distribution of birds of prey breeding in Belarus. Acta Zool. Litu. 15: 218–227. doi: 10.1080/13921657.2005.10512615
- EBBA2. 2019. http://ebba2.info.
- Eggers, J., Tröltzsch, T., Falcucci, A., Maioranow, L., Verburgz, P.H., Framstad, E., Louette, G., Maes, D., Szabolcs, N., Ozinga, W. & Delbaere, B. 2009. Is biofuel policy harming biodiversity in Europe? Glob. Change Biol. Bioenergy 1: 18–34. doi: 10.1111/j.1757-1707.2009.01002.x
- EuMon. 2019. EU-wide monitoring methods and systems of surveillance for species and habitats of community interest. http://eumon.ckff.si/.
- Flousek, J., Telenský, T., Hanzelka, J. & Reif, J. 2015. Population trends of Central European montane birds provide evidence for adverse impacts of climate change on high-altitude species. PLoS ONE 10: e0139465. doi:10.1371/journal.pone.0139465.
- Gaston, K.J., Jackson, S.F., Nagy, A., Cantú-Salazar, L. & Johnson, M. 2008. Protected areas in Europe. Ann. New York Acad. Sci. 1134: 97–119. doi: 10.1196/annals.1439.006
- Gaüzère, P., Jiguet, F. & Devictor, V. 2015. Rapid adjustment of bird community compositions to local climatic variations and its functional consequences. Glob. Change Biol. 21: 3367–3378. doi: 10.1111/gcb.12917
- GBIF. 2019. Global Biodiversity Information Facility. http://www.gbif.org/.
- Greenwood, J.J.D. 2007. Citizens, science and bird conservation. J. Ornithol. 148: 77–124. doi: 10.1007/s10336-007-0239-9
- Greenwood, J.J.D. 2017. The History of the EBCC atlas of European Breeding birds. Vogelwelt 137: 3–18.
- Hagemeijer, W. & Blair, M. 1997. The EBCC Atlas of European Breeding Birds. T. & A.D. Poyser, London.
- Harrison, J.A., Allan, D.G., Underhill, L.G., Herremans, M., Tree, A.J., Parker, V. & Brown, C. 1997 The Atlas of Southern African Birds. BirdLife South Africa, Johannesburg.
- Herrando, S., Keller, V., Voříšek, P., Kipson, M., Franch, M., Anton, M., Pla, M., Villero, D., Sierdsema, H., Kampichler, C., Telenský, T., Gillings, S., Johnston, A., Gottschalk, T., Guélat, J., Sattler, T., Brotons, L., Titeux, N., Jiguet, F., Kéry, M. & Milanesi, P. 2017. High resolution maps for the new European Breeding Bird Atlas: A first provision of standardised data and pilot modelled maps. Vogelwelt 137: 33–41.
- Herrando, S., Voříšek, P. & Keller, V. 2014. The methodology of the new European breeding bird atlas: finding standards across diverse situations. Bird Census News 26: 3–11.
- Huntley, B., Allen, J.R., Barnard, P., Collingham, Y.C. & Holliday, P.R. 2013. Species distribution models indicate contrasting late-Quaternary histories for Southern and Northern Hemisphere bird species. Glob. Ecol. Biogeogr. 22: 277–288. doi: 10.1111/j.1466-8238.2011.00751.x
- Huntley, B., Collingham, Y.C., Willis, S.G. & Green, R.E. 2008. Potential impacts of climatic change on European breeding birds. PLoS ONE 3: e1439. doi:10.1371/journal.pone.0001439.
- Huntley, B., Green, R.E., Collingham, Y.C., Hill, J.K., Willis, S.G., Bartlein, P.J., Cramer, W., Hagemeijer, W.J.M. & Thomas, C.J. 2004. The performance of models relating species geographical distributions to climate is independent of trophic level. Ecol. Lett. 7: 417–426. doi: 10.1111/j.1461-0248.2004.00598.x
- Keil, P., Schweiger, O., Kühn, I., Kunin, W.E., Kuussaari, M., Settele, J., Henle, K., Brotons, L., Pe’er, G., Lengyel, S., Moustakas, A., Steinicke, H. & Storch, D. 2012. Patterns of beta diversity in Europe: the role of climate, land cover and distance across scales. J. Biogeogr. 39: 1473–1486. doi: 10.1111/j.1365-2699.2012.02701.x
- Keller, V. 2014. EBBA2 – a new European Atlas of Breeding Birds. Bird Census News 26: 3–5.
- Keller, V., Ayé, R., Müller, W., Spaar, R. & Zbinden, N. 2010. Die prioritären Vogelarten der Schweiz: Revision 2010. Ornithol. Beob. 107: 265–285 (in German).
- Koleček, J., Albrecht, T. & Reif, J. 2014. Predictors of extinction risk of passerine birds in a Central European country. Anim. Conserv. 17: 498–506. doi: 10.1111/acv.12117
- Meller, L., Thuiller, W., Pironon, S., Barbet-Massin, M., Hof, A. & Cabeza, M. 2015. Balance between climate change mitigation benefits and land use impacts of bioenergy: conservation implications for European birds. Glob. Change Biol. Bioenergy 7: 741–751. doi: 10.1111/gcbb.12178
- MOL. 2019. Map of Life. https://mol.org/.
- Møller, A.P., Erritzøe, J., Karadas, F. & Mousseau, T.A. 2010. Historical mutation rates predict susceptibility to radiation in Chernobyl birds. J. Evol. Biol. 23: 2132–2142. doi: 10.1111/j.1420-9101.2010.02074.x
- Møller, A.P., Garamszegi, L.Z., Peralta-Sánchez, J.M. & Soler, J.J. 2011. Migratory divides and their consequences for dispersal, population size and parasite–host interactions. J. Evol. Biol. 24: 1744–1755. doi: 10.1111/j.1420-9101.2011.02302.x
- Pauly, D. & Stergiou, K.I. 2005. Equivalence of results from two citation analyses: Thomson ISI’s Citation Index and Google’s Scholar service. Ethics Sci. Environ. Politics 2005: 33–35. doi: 10.3354/esep005033
- Pedersen, P.E., Petersen, T.L., Jørgensen, P.S. & Tøttrup, A.P. 2011. The breeding population of red-backed shrike Lanius collurio in Gribskov, Denmark. Dan. Ornitol. Foren. Tidsskr. 105: 179–182.
- Reif, J., Prylová, K., Šizling, A.L., Vermouzek, Z., Šťastný, K. & Bejček, V. 2013. Changes in bird community composition in the Czech Republic from 1982 to 2004: increasing biotic homogenization, impacts of warming climate, but no trend in species richness. J. Ornithol. 154: 359–370. doi: 10.1007/s10336-012-0900-9
- Sándor, A.D. & Domşa, C. 2012. Special protected areas for conservation of Romanian forest birds: status assessment and possible expansion using predictive tools. Acta Zool. Bulgar. 64: 367–374.
- Secretariat of the Convention on Biological Diversity. 2014. Global Biodiversity Outlook 4. Montréal.
- Schmeller, D.S., Julliard, R., Bellingham, P.J., Böhm, M., Brummitt, N., Chiarucci, A., Couvet, D., Elmendorf, S., Forsyth, D.M., García-Moreno, J., Gregory, R.D., Magnusson, W.E., Martin, L.J., McGeoch, M.A., Mihoub, J.-B., Pereira, H.M., Proença, V., van Swaay, C.A.M, Yahara, T. & Belnap, J. 2015. Towards a global terrestrial species monitoring program. J. Nat. Conserv. 25: 51–57. doi: 10.1016/j.jnc.2015.03.003
- Sillero, N., Campos, J., Bonardi, A., Corti, C., Creemers, R., Crochet, P.-A., Isailović, J.C., Denoël, M., Ficetola, G.F., Gonçalves, J., Kuzmin, S., Lymberakis, P., de Pous, P., Rodríguez, A., Sindaco, R., Speybroeck, J., Toxopeus, B., Vieites, D.R. & Vences, M. 2014. Updated distribution and biogeography of amphibians and reptiles of Europe. Amphib. Reptil. 35: 1–31. doi: 10.1163/15685381-00002935
- Tomiałojć, L. 2012. Changes in tree sparrow Passer montanus populations from urban parks. Int. Stud. Sparrows 36: 4–17. doi: 10.1515/isspar-2015-0010
- Velevski, M., Hallmann, B., Grubač, B., Lisičanec, T., Stoynov, E., Lisičanec, E., Avukatov, V., Božič, L. & Stumberger, B. 2010. Important bird areas in Macedonia: sites of global and European importance. Acrocephalus 31: 181–282. doi: 10.2478/v10100-010-0009-2
- Virkkala, R. & Rajasärkkä, A. 2007. Uneven regional distribution of protected areas in Finland: consequences for boreal forest bird populations. Biol. Conserv. 134: 361–371. doi: 10.1016/j.biocon.2006.08.006
- Voříšek P. & Marchant J.H. 2003. Review of large/scale generic population monitoring schemes in Europe. Bird Census News 16: 16–40.
- Wichmann, B.A. & Hill, I.D. 1982. Algorithm AS 183: an efficient and portable pseudo-random number generator. J. R. Stat. Soc. Series C (Applied Statistics) 31: 188–190.
- Wotton, S., Conway, G., Eaton, M., Henderson, I. & Grice, P. 2009. The status of the Dartford Warbler in the UK and the Channel Islands in 2006. Br. Birds 102: 230–246.