
ABSTRACT
Capsule: The Crested Lark Galerida cristata as an example of a species which selects habitats which have undergone agricultural intensification.
Aims: To describe habitat preferences of the Crested Lark in western Poland.
Methods: We surveyed 30 randomly chosen study plots (1 km2) in western Poland to detect breeding pairs of Crested Larks. Sentinel and direct observations in the field were used to provide habitat data. Generalized linear mixed models were used to determine what type of environments habitats were selected by the Crested Larks.
Results: We recorded a total of 106 pairs of Crested Larks in 30 study plots. Birds inhabited farmland environments, where their preferred habitats included buildings, silage, and arable land with cereals.
Conclusion: Silage, which is associated with agricultural intensification within agricultural landscapes, increased the chances of the occurrence of Crested Larks.
The populations of many animal species inhabiting agricultural ecosystems are currently in decline (Donald et al. Citation2001, Benton et al. Citation2002, Smith et al. Citation2004, Green et al. Citation2005, Sparling et al. Citation2009, Hagman et al. Citation2012). The most important reasons for these biodiversity losses are the overuse of artificial fertilizers (Pimentel et al. Citation1992), the increased application of nutrients which cause eutrophication (Kruune Citation1964, O’Connor & Shrubb Citation1990), the increased use of herbicides, changes in crop types and sowing times, the drainage of land, and a large-scale decline in habitat heterogeneity (Benton et al. Citation2003). Birds are among the most endangered groups of animals inhabiting agricultural areas (Donald et al. Citation2001). Several species are currently described as indicators of high biodiversity in farmland ecosystems, e.g. the White Stork Ciconia ciconia (Tobolka et al. Citation2012), the Common Cuckoo Cuculus canorus (Kosicki & Hromada Citation2018), and some raptor species (Kosicki et al. Citation2016). However, using a single species as a general indicator imposes many constraints and is sometimes misleading from a methodological point of view (Haest Citation2019). Therefore, in order to monitor changes in species richness, more complex indices are superior tools for the assessment of more general trends (Canterbury et al. Citation2000, O’Connell et al. Citation2000, Gregory et al. Citation2004, Gregory & van Strien Citation2010). One of the indicators of changes in bird communities in agricultural environments is the Farmland Bird Index (hereafter FBI) (Gregory et al. Citation2004). The FBI is an official and prevalent index in the European Union (EU). It rates the condition of the rural environment in every country in the EU and is included among both structural and sustainable development indicators, which track the condition of analysed populations and assess the quality of human life. Continuous monitoring of the FBI shows that the population of European farmland birds has declined since 2009 in Poland, in connection with changes in climate and management of agriculture (Chylarecki & Jawińska Citation2007). Many authors have listed intensification of land management as a highly negative factor affecting bird populations (Donald et al. Citation2001, Benton et al. Citation2002, Newton Citation2004, Green et al. Citation2005, Guerrero et al. Citation2012, Jeliazkov et al. Citation2016, Manton et al. Citation2019). Farmland bird populations are smaller in countries where agriculture has been intensified (Donald et al. Citation2001). In Poland, as in many Central and Eastern European (CEE) countries, individual arable fields are smaller than their counterparts in Western Europe (WE). Smaller agricultural plots and natural field margins have a positive impact on biodiversity (Tryjanowski et al. Citation2011). However, in large countries, major differences exist between regions. For example, the western part of Poland has developed large-scale agriculture, while in the eastern part, more non-intensive farming is common (Głębocki et al. Citation2014). A similar pattern can be observed in Germany, Slovakia, and Hungary (Reif et al. Citation2011). There is a corresponding regional variance in bird population trends (Reif et al. Citation2011): in more intensively managed farmland, the FBI is declining, whereas in less intensively farmed regions, bird populations are more stable (Chylarecki & Jawińska Citation2007). However, not all bird species suffer from agricultural intensification. For example, in the case of a small group of thermophilic farmland bird species, populations have increased or remained stable in areas characterized by intensive agriculture (Chylarecki Citation2013).
One bird species whose population is stable in intensively used farmland is the Crested Lark Galerida cristata, also listed in the FBI. Over the years, the distribution of Crested Larks has extended to Europe, Central Asia, Minor Asia, and north-eastern and sub-Saharan Africa (Guillaumet et al. Citation2006). Nowadays, however, the Crested Lark is extinct in several European countries, including Sweden, Luxembourg, Norway, and Switzerland; and the species is very rare in Great Britain (Snow & Perrins Citation1998). Decades ago, the Crested Lark was common in Poland, in both rural and suburban environments (Cramp Citation1988, Lesiński Citation2009). Nowadays, it appears very rarely in cities (but see Šímová et al. Citation2015); it can be observed mostly on the outskirts of urban areas or in ruderal areas or around landfills. This bird tends to choose habitats associated with villages and nearby human settlements as nesting territories, and it prefers the vicinity of large farms, with buildings near fields. However, open, dry, and sandy places appear to appeal to it as well (Kuczyński & Chylarecki Citation2012) and Crested Larks often live in fallow fields, but this type of land use is decreasing (Santos et al. Citation2002).
The Crested Lark in Poland is most numerous in the western part of the country, i.e. the Greater Poland and Kuyavia regions, where large-scale farming dominates. In other parts of the country, it is rare or absent. Its population density for Poland as a whole, estimated based on predictive mapping, is 0.110 pairs/km2, and the population is considered stable (Kuczyński & Chylarecki Citation2012). However, more traditional methods of bird counting revealed that the Crested Lark population is actually declining. In the 1990s there were 0.013–0.026 breeding pairs/km2 in Poland overall, whereas the province of Greater Poland contained 0.050–0.067 pairs/km2 (Bednorz et al. Citation2000, Chylarecki Citation2013). This number has been decreasing; in 2004 there were no more than 0.011–0.014 pairs/km2 in Greater Poland (Kuźniak, unpublished data), and in 2008–2012, 0.008–0.011 pairs/km2 in Poland as a whole (Chodkiewicz et al. Citation2015). However, this species is frequent in large monocultural fields, even though this kind of land use reduces the biodiversity and population size of some other farmland birds (e.g. White Stork and Grey Partridge Perdix perdix) in Poland (Tryjanowski et al. Citation2011).
Nevertheless, the specific habitat preferences of the Crested Lark are not well known. Some papers suggest that it selects habitats near railways and industrial areas (Lesiński Citation2009). Others have reported the species as breeding in grassland or open cultivated areas. It has also been observed that the Crested Lark avoids dense vegetation cover (Peris & Montelongo Citation2014). However, the number of birds has been positively correlated with the intensity of disturbance, and the species is characterized by a short escape distance from people and cars (Glutz von Blotzheim Citation1985, Meffert & Dziock Citation2012). In western Poland, the Crested Lark breeds mainly close to village buildings, but also on communal farms (former State Agricultural Farms), straw or silage dumping areas, and building sites, and rarely on vegetable farms, at roadsides or in industrial areas (Wylegała et al. Citation2009).
As a result, since intensive agricultural management reduces the size of most populations of farmland birds, but not that of the Crested Lark, the factors that determine its distribution should be investigated and the characteristics of the land-use mosaic which lead them to select this specific habitat should be determined. Here, we aim to describe the habitat selection of the Crested Lark in this species’ high-density areas.
Methods
Study area
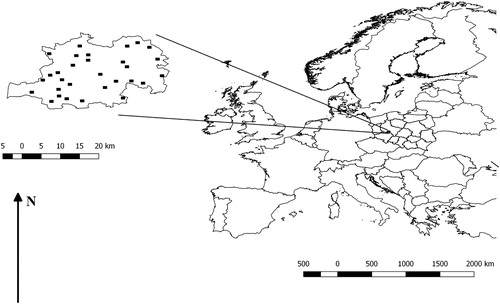
We conducted the study in western Poland within an area of agricultural land in the Gostyń district, an area of 810.34 km², located between 51°58ʹ39.5ʺ N 17°19ʹ57.6ʺ E and 51°41ʹ52.8ʺ N 16°43ʹ47.1ʺ E, with the town of Gostyń in the middle (51°52′45″ N, 17°0′45ʺ E). The density of human population in this area, which includes 5 towns and 136 villages, is 94 people/km2. The area is dominated by agricultural land (76.8%), particularly arable fields (70.5%) interspersed with meadows (5.5%), pastures (0.6%), small woods (0.2%), forests (14.3%), and human settlements (8.9%) (Tobółka Citation2012, Tobolka et al. Citation2015).
Selection of study plots
We used Quantum geographic information systems (GIS) open source software to select study plots. Within the borders of Gostyń district, we divided the map into squares of 1 km2 each. First, we divided the entire Gostyń district into 922 pre-study plots (1 × 1 km), then we excluded squares that were far from villages or small cities. We also removed those covered by larger forest complexes (over 10% of the forest cover) and those in the centre of cities or villages (over 60% of the urban cover), as it had been shown that Crested Lark prefers agricultural and ruderal land and avoids forested areas (Kuczyński & Chylarecki Citation2012). Finally, we selected 30 squares with a minimum distance for 2 km to each other (). Prior to carrying out statistical tests, we checked spatial autocorrelations between study plots with the abundance of Crested Lark. We found no significant spatial autocorrelation between plots (Moran’s I = –0.075, P = 0.233).
Figure 1. Map of the study area. Each black square designates a single study plot of 1 × 1 km.
Bird survey and data collection in the field
Presence of Crested Lark pairs in study plots
Each study plot was visited three times: in April, May, and June (or at the beginning of July, i.e. until the 5th July) 2017. We covered the entire square (1 × 1 km) with irregular transects, using existing roads and field margins in order to check every potential habitat for Crested Larks. Each place was investigated between sunrise and up to 5 h following, exclusively during good weather conditions (no rain or strong wind). When Crested Larks were detected, we marked their number on maps with a description of their behaviour and the direction of their flights. We grouped observations from three different periods within each square. We considered a patch of the area where we had observed Crested Larks at least twice to be occupied territory. Then, we connected the movement of birds to determine the centre of their habitat. We considered a circle with a radius of 50 metres around the centre to be a standardized territory for use in subsequent analyses (Guillaumet et al. Citation2010). From these data, we were able to calculate a density of Crested Lark pairs per study plot (in 30 squares of 1 km2).
Detailed survey of Crested Lark habitat
We detected 106 territories in 30 study plots (1 × 1 km squares). On each detected territory we generated a circular subplot of 7850 m2 (50 m radius) to calculate environmental variables. Additionally, we randomly chose the same number of reference subplots of the same size (50 m radius), where we had not detected Crested Larks during any of the three inspections in the field. Our absence data (one per existing territory) were so-called pseudo-absence records according to methods proposed by previous studies (Ferrier et al. Citation2002, Elith et al. Citation2006, Müller et al. Citation2009). Finally, 106 detected territories and the 106 not inhabited circles constituted our sample for further analysis. Within 78 circles (39 territories and 39 non-territories; more than 36% of all) in 11 randomly chosen squares, we recorded and mapped land-use types directly in the field, as follows: asphalt (all roads covered by asphalt), building (houses, barns, pigsties, and others), spring cereal, winter cereal, maize, debris (aggregations of debris, rubbish, and old farm machinery), green land (permanent green areas containing trees and/or shrubs, gardens, and orchards), bare soil, manure (natural fertilizer of all kinds), silage (piles of silage), rapeseed fields, and vegetables (vegetable patches near houses or fields of vegetables such as potatoes, tomatoes, cabbage, etc.). We recorded more variables to show which habitats were selected by Crested Larks. For the remaining 134 circles we used satellite remote sensing. Not all types of land-use were possible to calculate remotely due to low resolution of satellite images. Remotely, we determined: bare soil, buildings, spring cereal, winter cereal, maize, green land, meadow (pastures, meadows, and permanent green feed crops such as alfalfa), and rapeseed fields.
Processing of land-cover and land-use data
We manually input data collected in the field into Quantum GIS software as a separate layer for each type of land use mentioned above. Based on these layers, we calculated the share of the land cover for each Crested Lark territory and referential circle. Additionally, we used data from Sentinel 2, which is a collection of data from two high-resolution multi-spectral satellites (https://sentinel.esa.int/web/sentinel/missions/sentinel-2) forming part of the European Space Agency’s space mission. Both of these satellites acquire information by collecting sunlight reflected from the earth in 13 spectral bands (ESA Citation2014). The final product is a set of images, each 100 × 100 km, covering the entire earth. Our area of interest is encompassed in one image. The original images from Sentinel-2 had to be atmospherically corrected and converted to bottom-of-atmosphere values. For this purpose, we used the Semi-Automatic Classification Plugin (SCP) for QGIS (Congedo Citation2016). This plugin also enables semi-automatic classification of the land cover. Based on proper band composition (true and false colours e.g. red/green/blue) and data acquired in the field, we produced ‘training data’ necessary to classify the land cover correctly. We used the same land-use types as for data collected in the field. After running the SCP, we received our output data, i.e. land-cover classification from satellite remote sensing data for all plots. Then we intersected output from the SCP with our areas of interest. We collected data from all places classified as buildings, maize, grassland, ground, meadow, spring and winter cereals, and rapeseed. The remaining land-use types were classified based solely on field observation.
Statistical analyses
Density of Crested Lark pairs
In order to test the effects of environmental factors on the number of Crested Lark pairs detected within 1 km2 study plots, we used a generalized linear mixed model (GLMM) with Poisson distribution and logarithm link function and plot identity as a random factor. We used the following explanatory variables in the model: bare soil, buildings, spring cereal, winter cereal, maize, green land, meadow, and rapeseed. The explanatory variables were transformed using natural logarithms (+1). To avoid multicollinearity, we excluded the bare soil variable from the model. Multicollinearity in the remaining explanatory variables in all models was not excessive (variance inflation factor, VIF < 2). The final model validation was checked using diagnostic plots here and in the subsequent analysis.
Occurrence of the Crested Lark
We used data on the detailed distribution of Crested Larks to build a set of generalized linear mixed models (GLMM) with a binomial error structure and logit link function to determine the effect of environmental variables on the probability of occurrence. By presence, we meant territories detected during fieldwork (coded 1); by absence, we meant randomly chosen points, with no minimum distance between them, at which Crested Larks were not detected (coded 0). In the model, we used the following variables: asphalt, building, spring cereal, winter cereal, maize, debris, green land, bare soil, manure, silage, rapeseed, and vegetables; these were obtained from our direct observations in the field and data on land cover supported by data from Sentinel 2. The explanatory variables were transformed using natural logarithms (+1). We used plot identity as a random factor. To avoid multicollinearity, we excluded spring cereal from the model. Multicollinearity in the remaining explanatory variables in all models was not excessive (VIF < 2).
Additionally we used Akaike’s information criterion adjusted for small sample sizes (AICc) to identify the most parsimonious model from each candidate set. Based on the full model, we ranked all possible model combinations according to their ΔAICc values and used models with the lowest AICc values along with associated weight values (the probability that a given model is the best) as those best describing the data. We considered candidate models differing by less than 2 AICc units (ΔAICc < 2.0) to be equally informative and subject to possible model averaging. For averaging, we used models with weights ΔAICc values lower than 4 (Burnham & Anderson Citation2002). Spatial autocorrelation was calculated using the ‘ape’ package (Paradis & Schliep Citation2018).
We performed all analyses in R 3.4.2 (R Core Developmental Team Citation2017) using the ‘lme4’ (Bates et al. Citation2015), ‘MuMIn’ (Barton Citation2016), ‘car’ (Fox & Weisberg Citation2019) and ‘ggplot2’ (Wickham Citation2016) packages.
Results
We recorded 106 pairs of Crested Larks in 30 study plots (each 1 km2). Mean abundance in rural landscapes without large complexes of forests was 3.53 pairs/km2 (median = 3; range = 0–12). In two squares we found no Crested Larks. The GLMM, based on data from Sentinel environmental factors, showed a significant positive correlation between the presence of Crested Larks and the land cover share of spring cereals (Z = 2.19, P = 0.041) and winter cereals (Z = 3.82, P < 0.001). Rapeseed was significantly negatively correlated with the presence of Crested Larks (Z = −2.32, P = 0.032). This model explained 41.57% of the variation (, ).
Figure 2. Results of a generalized linear mixed model showing the relationships between the number of Crested Larks within study plots of 1 km2 and land cover shares of (a) winter cereal, (b) spring cereal, and (c) rapeseed.
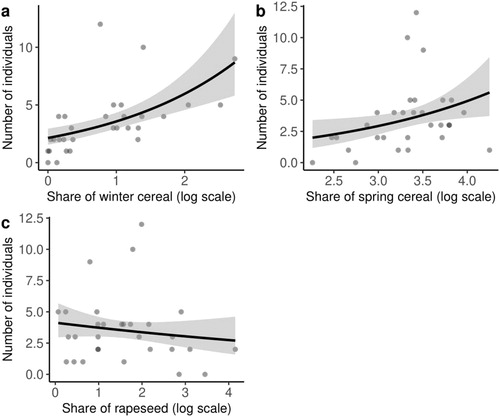
Table 1. Results of a generalized linear model of abundance of the Crested Lark in relation to land cover shares of habitat type data obtained from Sentinel 2. R2 = 41.57%.
Based on AICc values for model selection, 10 models of the occurrence of breeding Crested Larks were equally good and explained 49–53% of the variation (online supplementary Table S1). The probability of occurrence of Crested Larks was positively correlated with the land cover share of buildings (Z = 5.84, P < 0.001) and silage within a 50 m buffer (Z = 2.20, P = 0.028, , ).
Figure 3. Results of a generalized linear mixed model showing the relationship between the probability of occurrence of breeding Crested Larks and land cover shares of building and silage surfaces within a radius of 50 m.
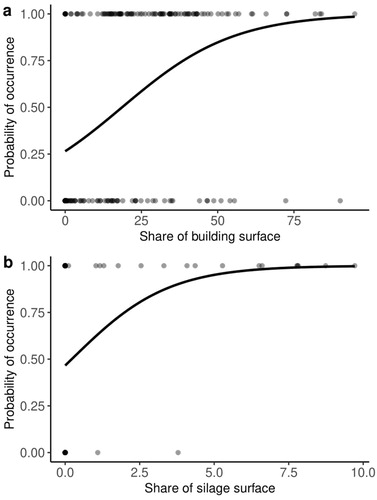
Table 2. Results of a generalized linear mixed model of the probability of the occurrence of the Crested Lark in relation to land use share data obtained from the field survey and Sentinel 2.
Discussion
In this study, we found a relatively high level of abundance of the Crested Lark in comparison to previous studies from Poland (Bednorz et al. Citation2000, Sikora et al. Citation2007, Lesiński Citation2009, Kuczyński & Chylarecki Citation2012). Additionally, this study revealed a density of breeding Crested Larks greater than those found in studies from other countries of western Europe, such as Italy (Sorace Citation2002), although lower than that found in Slovakia (Danko et al. Citation2002). This suggests that the area of our study, which is representative of the larger region of central and western Poland, is an important breeding ground for Crested Larks in this part of Europe. Agricultural management here seems to be favourable for the species in contrast to other parts of Poland (Kuczyński & Chylarecki Citation2012). Moreover, a low level of precipitation (153 mm/m2 in total for the study area in March, April, and June), in contrast to other parts of Poland (Woś Citation1999), and the light soils dominating in the region (Stach & Podsiadłowski Citation2002) are comparable to the prime, semi-desert habitats for this species (Guillaumet et al. Citation2006).
Analysis of land cover within 1 × 1 km squares revealed that the presence of breeding Crested Larks was positively correlated with the land cover of arable fields sown with winter or spring cereals. This suggests that Crested Larks prefer relatively low vegetation or bare soil, such as cereal fields. They avoid arable fields covered by higher vegetation such as rapeseed, which are sown in early autumn in the preceding year and grow during the entire winter period. During early spring rapeseed fields are covered by relatively high vegetation. The analysis of land use within each territory and reference point reveals that the most important predictors of Crested Lark presence are the land cover share of buildings and silage. Sentinel, combined with our observations in the field, enabled us to calculate these kinds of land use with a high degree of accuracy. A large silage surface occurs when cattle are kept inside buildings and silage is used to store their food. This is very common, particularly near large farms where great numbers of cattle are kept. The silage usually consists of maize, beet leaves or beet pulp covered by foil and soil. Often maize stored in silage derives from the second harvest, in cases where winter barley is harvested early in the summer (beginning of June) and maize is sown as a second crop on the same field. Therefore, silage may be considered an indicator of intensified farming and a high level of animal breeding (Strzetelski et al. Citation2001, Podkówka Citation2003). These silages are not overgrown by vegetation and thus constitute elevated sites for singing male larks during early spring and winter (ML personal observation), as well as foraging sites. Silage is used year-round by farmers, hence it is surrounded mostly by bare soil with very scarce vegetation, which matches the Crested Lark’s habitat selection (Guillaumet et al. Citation2006). Many times during our fieldwork we observed birds singing from the top of stored silage and foraging on open silage, which suggests that silage also provides foraging habitat for Crested Larks, however, we did not collect detailed information concerning the birds’ diet or the occurrence of insects in open silage. Buildings often indicate the presence of silage and also serve as elevated sites facilitating singing at the beginning of the breeding season. The occurrence of Crested Larks is associated with more intensively managed land as opposed to wetter areas with more vegetation, such as meadows and pastures.
The Crested Lark, therefore, seems to be one of the bird species that benefits from intensification of agricultural production. However, in this paper, we analysed only the occurrence of breeding larks and land-use. To state more about the relationships between agricultural intensification and abundance of Crested Larks in a long-term perspective, we need more data on breeding success and survival rates in relation to habitat selection. Breeding close to human settlements has several disadvantages, for example, the increased risk of predation by domestic cats (Balogh et al. Citation2011), which is a severe threat for terrestrial birds globally (Loss & Marra Citation2017).
Change of landscape management is a crucial factor for the decline of many farmland bird species. However, our results suggest that farmland intensification may have a positive effect on the abundance of Crested Larks in western Poland. Due to climate change, many landscapes may become transformed into drier habitats with less vegetation cover, similar to the semi-desert habitats suitable for Crested Larks. Our results showed that agricultural intensification associated with increasing human settlement, silage use, and cereal fields increases the chances of the occurrence of breeding Crested Larks.
References
- Balogh, A.L., Ryder, T.B. & Marra, P.P. 2011. Population demography of Gray Catbirds in the suburban matrix: sources, sinks and domestic cats. J. Ornithol. 152: 717–726. doi: 10.1007/s10336-011-0648-7
- Barton, K. 2016. Package “MuMIn”: Multi-Model Inference. R package, Version 1.15. 6. https://cran.r-project.org/web/packages/MuMIn/index.html (Accessed 22 October 2016).
- Bates, D., Maechler, M., Bolker, B. & Walker, S. 2015. Fitting linear mixed-effects models using lme4. J. Stat. Softw. 67: 1–48. doi: 10.18637/jss.v067.i01
- Bednorz, J., Kupczyk, M., Kuźniak, S. & Winiecki, A. 2000. Ptaki Wielkopolski, monografia faunistyczna. Bogucki Wydawnictwo Naukowe, Poznań (in Polish).
- Benton, T.G., Bryant, D.M., Cole, L. & Crick, H.Q.P. 2002. Linking agricultural practice to insect and bird populations: a historical study over three decades. J. Appl. Ecol. 39: 673–687. doi: 10.1046/j.1365-2664.2002.00745.x
- Benton, T.G., Vickery, J.A. & Wilson, J.D. 2003. Farmland biodiversity: is habitat heterogeneity the key? Trends Ecol. Evol. 18: 182–188. doi: 10.1016/S0169-5347(03)00011-9
- Burnham, K.P. & Anderson, D.R. 2002. Model Selection and Multimodel Inference: a practical information-theoretic approach, 2nd ed. Springer, New York.
- Canterbury, G.E., Martin, T.E., Petit, D.R., Petit, L.J. & Bradford, D.F. 2000. Bird communities and habitat as ecological indicators of forest condition in regional monitoring. Cons. Biol. 14: 544–558. doi: 10.1046/j.1523-1739.2000.98235.x
- Chodkiewicz, T., Kuczyński, L., Sikora, A., Chylarecki, P., Neubauer, G., Ławicki, Ł & Stawarczyk, T. 2015. Population estimates of breeding birds in Poland in 2008–2012. Ornis Pol. 56: 149–189.
- Chylarecki, P. 2013. Czynniki kształtujące zmiany liczebności pospolitych ptaków Polski w latach 2000–2012. Bogucki Wyd. Nauk., Poznań.
- Chylarecki, P. & Jawińska, D. 2007. Monitoring Pospolitych Ptaków Lęgowych: Raport z lat 2005–2006. OTOP, Warszawa (in Polish).
- Congedo, L. 2016. Semi-automatic Classification Plugin Documentation. doi: 10.13140/RG.2.2.29474.02242/1
- Cramp, S. E. 1988. The Birds of the Western Palearctic. Handbook of the Birds of Europe, the Middle East and North Africa. Oxford University Press, Oxford.
- Danko, Š, Darolová, A. & Krištín, A. 2002. Birds Distribution in Slovakia. Veda, Bratislava.
- Donald, P.F.E., Green, R.E. & Health, M. 2001. Agricultural intensification and the collapse of Europe's farmland bird populations. Proc. R. Soc. B Biol. Sci 268: 25–29. doi: 10.1098/rspb.2000.1325
- Elith, J., Graham, H., P, C., Anderson, R., Dudík, M., Ferrier, S., Guisan, A. & Li, J. 2006. Novel methods improve prediction of species’ distributions from occurrence data. Ecography 29: 129–151. doi: 10.1111/j.2006.0906-7590.04596.x
- ESA. 2014. European Space Agency Bulletin 157. https://www.esa.int/About_Us/ESA_Publications/ESA_Bulletin_157_Feb_2014.
- Ferrier, S., Drielsma, M., Manion, G. & Watson, G. 2002. Extended statistical approaches to modelling spatial pattern in biodiversity in northeast New South Wales. II. Community-level modelling. Biodiv. Cons. 11: 2309–2338. doi: 10.1023/A:1021374009951
- Fox, J. & Weisberg, S. 2019. An {R} Companion to Applied Regression, 3rd ed. Sage, Thousand Oaks, CA.
- Głębocki, B., Kacprzak, E., Kaczmarek, U., Kalbarczyk, E., Kluba, M., Kołodziejczak, A., Kossowski, T., Perdał, R. & Rudnicki, R. 2014. Zróżnicowanie przestrzenne rolnictwa. Powszechny spis rolny 2010. Główny Urząd Statystyczny, Warszawa (in Polish).
- Glutz von Blotzheim, U.N. 1985. Handbuch der Vögel Mitteleuropas. AULA-Verlag, Wiesbaden.
- Green, R.E., Cornell, S.J., Scharlemann, J.P.W. & Balmford, A. 2005. Farming and the fate of wild nature. Science 307: 550–555. doi: 10.1126/science.1106049
- Guerrero, I., Morales, M.B., Oñate, J.J., Geiger, F., Berendse, F., Snoo, G., Eggers, S., Pärt, T., Bengtsson, J., Clement, L.W., Weisser, W.W., Olszewski, A., Ceryngier, P., Hawro, V., Liira, J., Aavik, T., Fischer, C., Flohre, A., Thies, C. & Tscharntke, T. 2012. Response of ground-nesting farmland birds to agricultural intensification across Europe: landscape and field level management factors. Biol. Conserv. 152: 74–80. doi: 10.1016/j.biocon.2012.04.001
- Guillaumet, A., Pons, J.C., Godelle, B. & Crochet, P.A. 2006. History of the Crested Lark in the Mediterranean region as revealed by mtDNA sequences and morphology. Mol. Phylogenet. Evol. 39: 645–656. doi: 10.1016/j.ympev.2006.01.002
- Guillaumet, A., Gonin, J., Prodon, R. & Crochet, P.A. 2010. The geographic and seasonal dimensions of habitat use in Galerida larks: implications for species coexistence and range limits. Ecography 33: 961–970. doi: 10.1111/j.1600-0587.2009.06087.x
- Gregory, R.D. & van Strien, A. 2010. Wild bird indicators: using composite population trends of birds as measures of environmental health. Ornithol. Sci. 9: 3–22. doi: 10.2326/osj.9.3
- Gregory, R.D., Noble, D.G. & Custance, J. 2004. The state of lay of farmland birds: population trends and conservation status of lowland farmland birds in the United Kingdom. Ibis 146: 1–13. doi: 10.1111/j.1474-919X.2004.00358.x
- Haest, B. 2019. Cuckoos: the holy grail of avian biodiversity conservation? Ecol. Indic. 97: 59–66. doi: 10.1016/j.ecolind.2018.10.007
- Hagman, M., Elmberg, J., Kärvemo, S. & Löwenborg, K. 2012. Grass snakes (Natrix natrix) in Sweden decline together with their anthropogenic nesting-environments. Herpetol. J. 22: 199–202.
- Jeliazkov, A., Mimet, A., Chargé, R., Jiguet, F., Devictor, V. & Chiron, F. 2016. Impacts of agricultural intensification on bird communities: new insights from a multi-level and multi-facet approach of biodiversity. Agri. Ecosyst. Environ. 216: 9–22. doi: 10.1016/j.agee.2015.09.017
- Kosicki, J.Z. & Hromada, M. 2018. Cuckoo density as a predictor of functional and phylogenetic species richness in the predictive modelling approach: extension of Tryjanowski and Morelli (2015) paradigm in the analytical context. Ecol. Indic. 88: 384–392. doi: 10.1016/j.ecolind.2018.01.009
- Kosicki, J.Z., Zduniak, P., Ostrowska, M. & Hromada, M. 2016. Are predators negative or positive predictors of farmland bird species community on a large geographical scale? Ecol. Indic. 62: 259–270. doi: 10.1016/j.ecolind.2015.11.003
- Kruune, A.A. 1964. The number of species in grassland. Jaarb. Inst. Biol. Scheik. Onderz. Landb. Gew. 253: 167–175.
- Kuczyński, L. & Chylarecki, P. 2012. Atlas pospolitych ptaków lęgowych Polski. GIOŚ, Warszawa (in Polish).
- Lesiński, G. 2009. Breeding ecology and population decline of the Crested lark Galerida cristata in Warsaw. Ornis Hung. 17–18: 1–11.
- Loss, S.R. & Marra, P.P. 2017. Population impacts of free-ranging domestic cats on mainland vertebrates. Front. Ecol. Environ. 15: 502–509. doi: 10.1002/fee.1633
- Manton, M., Angelstam, P. & Naumov, V. 2019. Effects of land use intensification on avian predator assemblages: a comparison of landscapes with different histories in Northern Europe. Diversity 11: 70. doi: 10.3390/d11050070
- Meffert, P. & Dziock, F. 2012. What determines occurrence of threatened bird species on urban westlands. Biol. Conserv. 153: 87–96. doi: 10.1016/j.biocon.2012.04.018
- Müller, D., Schröder, B. & Müller, J. 2009. Modelling habitat selection of the cryptic Hazel Grouse Bonasa bonasia in a montane forest. J. Ornithol. 150: 717–732. doi: 10.1007/s10336-009-0390-6
- Newton, I. 2004. The recent declines of farmland bird populations in Britain: an appraisal of causal factors and conservation actions. Ibis 146: 579–600. doi: 10.1111/j.1474-919X.2004.00375.x
- O'Connell, T.J., Jackson, L.E. & Brooks, R.P. 2000. Bird guilds as indicators of ecological condition in the central Appalachians. Ecol. Appl. 10: 1706–1721. doi: 10.1890/1051-0761(2000)010[1706:BGAIOE]2.0.CO;2
- O’Connor, R.J. & Shrubb, M. 1990. Farming and Birds. Cambridge University Page, Cambridge.
- Paradis, E. & Schliep, K. 2018. ape 5.0: an environment for modern phylogenetics and evolutionary analyses in R. Bioinformatics. 35: 526–528. doi: 10.1093/bioinformatics/bty633
- Peris, S. & Montelongo, T. 2014. Birds and small urban parks: a study in a high plateau city. Turkish J. Zool. 38: 316–325. doi: 10.3906/zoo-1305-20
- Pimentel, D., Stachow, U., Takacs, D.A., Brubaker, H.W., Dumas, A.R., Meaney, J.J., O’Neil, J.A.S., Onsi, D.E. & Corzilius, D.B. 1992. Conserving biological diversity in agricultural/forestry systems. Bioscience 42: 354–362. doi: 10.2307/1311782
- Podkówka, W. 2003. Kiszonka wysokoenergetyczna pasza z kukurydzy. Kukurydza 1: 63–64 (in Polish).
- R Core Developmental Team. 2017. R: A language and environment for statistical computing. R Foundation for Statistical Computing, Vienna, Austria. https://www.R-project.org/.
- Reif, J., Böhning-Gaese, K., Flade, M., Schwarz, J. & Schwager, M. 2011. Population trends of birds across the iron curtain: brain matters. Biol. Conserv. 144: 2524–2533. doi: 10.1016/j.biocon.2011.07.009
- Santos, T., Tellería, J.L. & Carbonell, R. 2002. Bird conservation in fragmented Mediterranean forests of Spain: effects of geographical location, habitat and landscape degradation. Biol. Conserv. 105: 113–125. doi: 10.1016/S0006-3207(01)00210-5
- Sikora, A., Rohde, Z., Gromadzki, M., Neubauer, G. & Chylarecki, P. 2007. The Atlas of Breeding Birds in Poland 1985–2004. Bogucki Wydawnictwo Naukowe, Poznań (in Polish).
- Šímová, P., Šťastný, K. & Šálek, M. 2015. Refugial role of urbanized areas and colonization potential for declining Crested Lark (Galerida cristata) populations in the Czech Republic, Central Europe. J. Ornithol. 156: 915–921. doi: 10.1007/s10336-015-1203-8
- Smith, R.K., Jennings, N.V., Robinson, A. & Harris, S. 2004. Conservation of European hares Lepus europaeus in Britain: is increasing habitat heterogeneity in farmland the answer? J. Appl. Ecol. 41: 1092–1102. doi: 10.1111/j.0021-8901.2004.00976.x
- Strzetelski, P., Jurkiewicz, A. & Strzeleski, J. 2001. Kiszonka z kukurydzy w żywieniu bydła. Biul. Inf. I. Zoot. 39: 49–62.
- Snow, D.W. & Perrins, C.M. 1998. The Birds of the Western Palearctic Concise Edition. Oxford University Press, Oxford.
- Sorace, A. 2002. High density of bird and pest species in urban habitats and the role of predator abundance. Ornis Fenn. 79: 60–71.
- Sparling, D.W., Fellers, G.M. & McConnell, L.L. 2009. Pesticides and amphibian population declines in California. Environ. Toxicol. Chem. 20: 1591–1595. doi: 10.1002/etc.5620200725
- Stach, A. & Podsiadłowski, S. 2002. Pulverizing and wind erosion as influenced by spatial variability of soils texture. Quaest. Geogr. 22: 67–78.
- Tobółka, M. 2012. White Stork Ciconia ciconia population in the Gostyń and Kościan districts in 2005–2011. Ptaki Wielkop 1: 91–101 (in Polish).
- Tobolka, M., Sparks, T.H. & Tryjanowski, P. 2012. Does the White Stork Ciconia ciconia reflect farmland bird diversity? Ornis Fenn. 89: 222–228.
- Tobolka, M., Zolnierowicz, K.M. & Reeve, N.F. 2015. The effect of extreme weather events on breeding parameters of the White Stork Ciconia ciconia. Bird Study 62: 377–385. doi: 10.1080/00063657.2015.1058745
- Tryjanowski, P., Hartel, T., Báldi, A., Szymański, P., Tobółka, M., Herzon, I., Goławski, A., Konvička, M., Hromada, M., Jerzak, L., Kujawa, K., Lenda, M., Orłowski, G., Panek, M., Skórka, P., Sparks, T.H., Tworek, S., Wuczyński, A. & Żmihorski, M. 2011. Conservation of farmland birds faces different challenges in Western and Central-Eastern Europe. Acta Ornithol. 46: 1–12. doi: 10.3161/000164511X589857
- Wickham, H. 2016. ggplot2: elegant graphics for data analysis. Springer-Verlag, New York.
- Woś, A. 1999. Climate of Poland. Wydawn. Naukowe PWN, Warszawa (in Polish).
- Wylegała, P., Krąkowski, B., Sieracki, P., Kasprzak, A. & Rosin, Z. 2009. Abundance, density and breeding sites of the Crested Lark Galerida cristata in the Wielkopolska agricultural landscape. Not. Orn. 50: 312–318 (in Polish).